O R I G I N A L A R T I C L E
Open Access
Performance evaluation of multi-stage
open-loop impedance pump
V. C. C. Lee
1*, Y. A. Abakr
2and K. C. Woo
2Abstract
Background:Impedance pump is a simple valveless pumping mechanism, which transports fluid through the
mismatch of impedance in the system. Mismatch in impedance occurs when an asymmetrical periodic excitation is exerted on the elastic tube. Periodic asymmetrical excitation will then produce a unidirectional flow. Considering a multi-stage system with a single and constant power source, it is well expected that there would be pumping limitation to which the enhancement can reach.
Methods:A multi-stage open-loop impedance pump is developed in the current work. The current work
experimentally analyzes and evaluates the pumping performance of a multi-stage open-loop impedance pump, with emphasis on the flow rates induced and pumping limitation. Analyses of flow rates, pressure head and excitation frequencies are performed in its non-dimensional form.
Results:Taking a single-stage system as benchmark, enhancement of 35 and 33.3% is shown in the flow rate and
pressure head respectively for a two-stage system. Enhancement of 110 and 60% is shown in flow rate and pressure head of a three-stage system in comparison to the single-stage system. For four-stage system, however, only 27 and 46.7% increments are demonstrated in the flow rate and pressure head, respectively.
Conclusions:The implementation of multi-stage system with single constant power input is demonstrated to be
limited only to the three-stage system where the declined pumping performance is exhibited in a four-stage system.
Keywords:Valveless, Multi-stage, Impedance pump, Performance evaluation, Limitation
Background
Impedance pump is a simple pumping mechanism, which transports liquid through the mismatch of im-pedance in the system. It is very simple in design and offers a promising new technique for producing and enhancing flow rates for both macro- and micro-scale devices (Avrahami and Gharib 2008; Rinderknecht et al. 2005).
Impedance pump is a type of valveless pump which does not require vanes or blades to operate. In addition, it offers a low-noise and low-energy al-ternatives to current pumping system (Lee et al. 2011). A typical open-loop impedance pump consists of an elastic tube, connected to rigid tubing, where the rigid section is connected to a reservoir. Excitation at a
single location (not in the middle) of the fluid-filled elastic tube will result in unidirectional flow. This is due to the mismatch in impedance in the elastic tube. Such pumping mechanism has shown to be highly sensi-tive towards the impedance in the tube, the location, and excitation frequency (Avrahami and Gharib 2008; Lee et al. 2015; Manopoulus et al. 2006; Hickerson 2005; Timmermann and Ottesen 2009).
The first demonstration of valveless impedance pumping was performed by Gerhart Liebau in 1954, using an elastic tube connected to reservoirs at differ-ent heights (Liebau 1954, 1955). Following Liebau’s work in 1954, there have been several works studying the underlying physics of the system, be it numerical or experimental. The major contributions include Hickerson in 2005, Loumes in 2007, Rosenfeld in 2010, Meier in 2011, and Lee in 2014. All these works show significant milestones in the advancement of * Correspondence:[email protected];http://www.curtin.edu.my
1Faculty of Engineering and Science, Curtin University Sarawak Malaysia, CDT 250, 98009 Miri, Sarawak, Malaysia
Full list of author information is available at the end of the article
impedance pump, emphasizing on the exploration and application of impedance pump in different domains. To date, three designs of flow rate enhancement imped-ance pumping system were reported.
Loumes introduced a concept on multi-layer bio-inspired impedance pump. Flow output and inner wall motion are found to be highest at the resonant fre-quency. Excitation force needed to produce a signifi-cant flow was demonstrated to be relatively smaller than a single-layer pump. Having said, with the simi-lar excitation force, a simi-larger flow rate can be induced. This design is operating at a single-stage system con-figuration. In 2010, Rosenfeld’s studied on the effects of sequential excitations on a single elastic tube and showed promising results where increase in flow rates was observed (Rosenfeld and Avrahami 2010). Simi-larly, Lee worked on a two-stage system, integrated from two single-stage systems (Lee et al. 2013, 2014), and also showed an enhancement in the flow rates. However, Rosenfield’s design showed higher complexities, where synchronizations of locations and excitation frequencies are prerequisites for an efficient pumping. Lee’s design, on the other hand, is much simpler as the operating condi-tions are similar to a single-stage system. Locacondi-tions and excitation frequencies for pumping are shown to be un-affected by the multi-stage configuration. The interim res-ervoir in between stages has also showed to be a valuable part of the system, serving as the driving mechanism in flow rate enhancement (Lee and Chong 2016).
While enhancement in flow rates is shown possible, there lies a question to which the enhancement can
sustain under single and constant power source. The current work analyzes and evaluates the pumping per-formance of such a multi-stage open-loop impedance pump, with emphasis on the flow rates induced and pumping limitation.
Methods
Experiments were conducted for the analysis and evalu-ation of the pumping performance for the multi-stage system. Four systems will be tested, that is
(i) A conventional single-stage system (ii) A two-stage system
(iii) A three-stage system, and (iv) A four-stage system
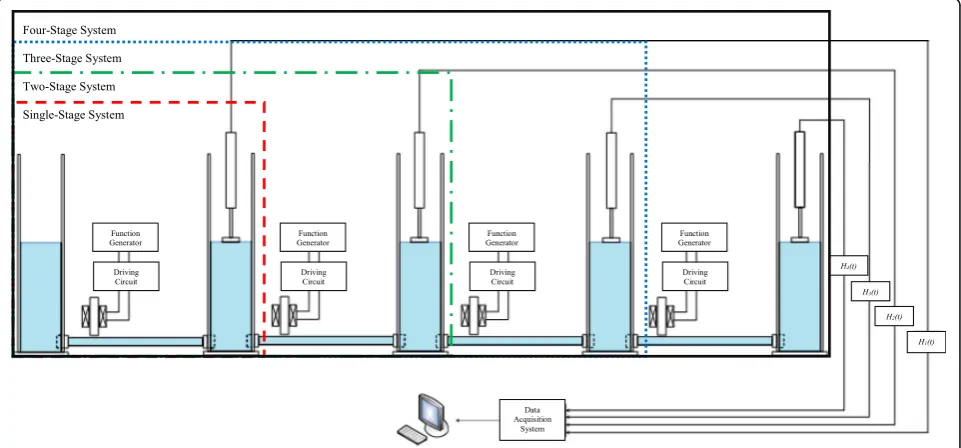
The schematic diagram of a full four-stage system is shown in Fig. 1. Location of compression is character-ized in its non-dimensional form for the ease of com-parison. xi will be used to denote the instantaneous
location of the mechanism while Li represents the total length of the elastic tube. Subscript, i, of 1–4 will be used to represent four different tubes. All four excitation mechanism is fixed at tube location xi=
Li = 0.1. Detailed experimental methods and materials are available in Ref (Lee et al. 2014). Water is used as the working fluid in all experiments.
Analyses of the flow dynamics are in its non-dimensional form. Excitation frequencies are presented as the Womersley number (α), as expressed in Eq. (1)
α¼r ffiffiffiffiffiffi
ρω μ
r
ð1Þ
Flow rates (Q) are normalized against the highest in-duced flow rate in a single-stage system for better illus-tration of the enhancement (Eq. 2). Pressure head (H) is normalized with respect to the initial pressure head at height of 250 mm (Eq. 3).
Qn¼ Qmulti‐stage
Qsingle‐stage;max
ð2Þ
Hn¼Hh H
¼250mm ð3Þ
With reference to Ref (Timmermann and Ottesen 2009), the theoretical resonant frequency is expressed as a function of the wave propagation,c, as shown in Eq. 4,
fr¼0:17c ð4Þ
Substituting the wave propagation, c, as a function of the tube and fluid properties, the resonant frequency hence becomes
fr¼0:17 ffiffiffiffiffiffiffi
Eh 2ρr s
ð5Þ
where
ris the radius of the tube ρis the water density ωis the excitation frequency μis the coefficient of liquid viscosity
Eis Young’s modulus of the elastic tube, and
his the thickness of the tube
Resonant frequency is theoretically calculated to be 4.8 Hz using Eq. (5). Hence, a range of frequencies around the resonant frequency will be experimented to obtain the excitation frequency nearest to the resonance.
Results and discussion
Pumping performance of a multi-stage open-loop im-pedance pump was analyzed and evaluated. This section consists of five subsections. First four subsections dis-cuss on the pumping performance of each stages. The fifth subsection discusses the performance analyses and evaluation of a multi-stage system.
A single-stage system
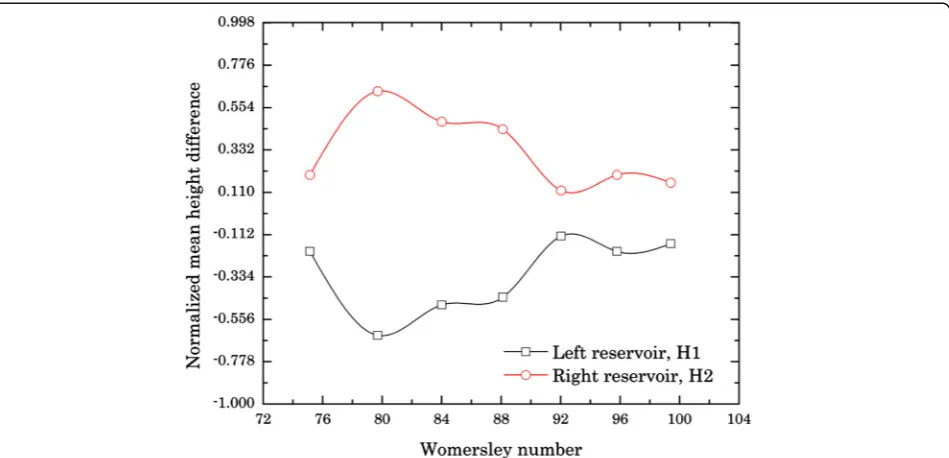
A single-stage system experiments were conducted with selective range of the Womersley number from 75.15 to 99.41, which corresponds to frequencies of 4 to 7 Hz, which was deduced to be the resonance range for efficient pumping as calculated theoretically using Eq. (5). Experimental results are shown in Figs. 2 and 3. The
trend shows a non-linear dependency of pump’s
re-sponses towards the Womersley number. It is observed that the highest achievable height difference is 167 mm with deliverable pumping rate of 7.64 L min−1 at the Womersley number of 79.7 which corresponds to fre-quency of 4.5 Hz. This point of interest will serve as the benchmark pumping rate for comparison with the multi-stage systems of two-stage, three-stage, and four-stage systems. As shown in Fig. 2, the highest pumping
rate occurs at the Womersley number of 79.9 (4.5 Hz), marking this number to be the resonance condition which is predicted theoretically to be 4.8 Hz with a dif-ference of 6.3% due to the physical limitation of the actuators. Due to the instrumental limitation of hard-ware, the actuator was unable to work with frequency of 4.8 Hz. Hence, frequency interval of 0.5 is used instead. Frequency for efficient resonant pumping was located to be at 4.5 Hz. A plot of flow rate against pressure head
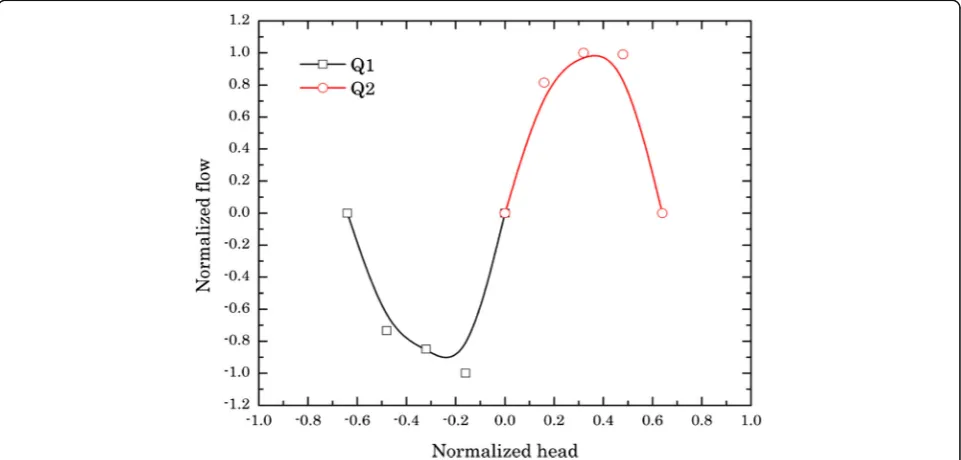
(Q−H diagram) is shown in Fig. 4, indicating the flow development in a single-stage system.
The relation betweenQandHis portrayed as a sinus-like curve.Qis normalized such that the maximum achievable flow rate is denoted as 1 whileHis normalized with respect to the initial pressure head at water level of 250 mm in the reservoir.Q1is the flow rate observed in the left reservoir, shown to be the source reservoir whileQ2is the flow rate observed in the right reservoir, the deliverable reservoir.Q1
Fig. 3Normalized deliverable pumping rate with respect to the Womersley number for a single-stage system
shows a negative flow rate indicating a decrement in the pressure head while Q2shows a positive flow rate indi-cating an increment in the pressure head. This shows that the transportation of water occurred in a unidirec-tional from left to right. The highest flow rate in the decreasing reservoir, Q1, is observed to be at the pres-sure head of 0.25 while for the increasing reservoir,Q2, is observed to be at 0.5; indicating the pumping work in the decreasing reservoir is higher than the increasing reservoir. This phenomenon is due to the impedance difference along the tube. At the compression location, xi=
Li of 0.1, the impedance at the right end tube is smaller as compared to the left end tube. Therefore, the water would tend to move towards the region with lesser impedance. As the water flow through the tube, pressure gradient between both reservoirs changes as well, creating a higher pressure in the right reservoir. With higher pressure in the right reservoir, the forces required to overcome the fluid inertia in the reservoir hence increases, thus required longer time to reach a higher pressure head.
A two-stage system
In accordance to Ref (Lee et al. 2014), it was shown that effective excitation frequency of the two-stage system at resonance, similarly, is at 4.5 Hz. This shows that the resonant frequency for a multi-stage system is independ-ent of the number of stages. Pumping is most efficiindepend-ent at the compression location synchronization of xi=
Li = 0.1.
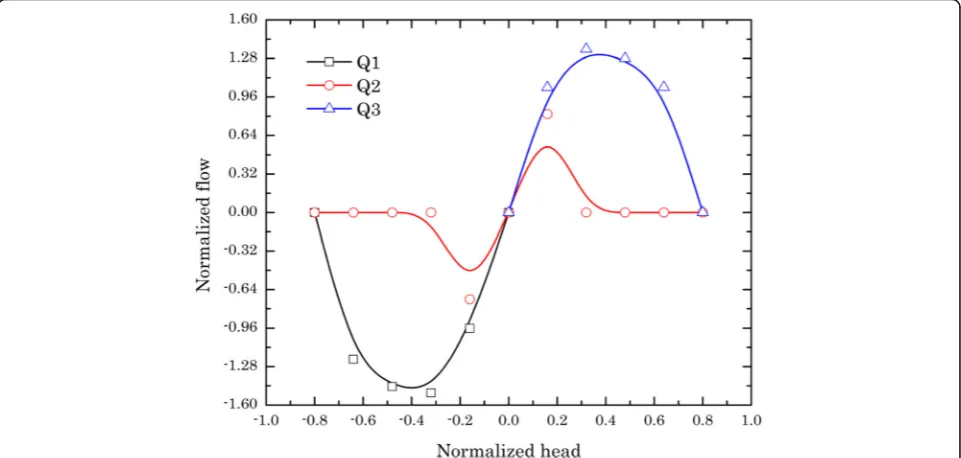
With this, Q−H diagram of a two-stage system is
plotted and shown in Fig. 5. Q1represents the flow rate measured in the left reservoir,Q2is the flow rate in the middle reservoir, andQ3is the flow rate measured in the right reservoir. The flow rates are normalized based on the highest flow rate found in a single-stage system that serves as benchmark of 1.0. In Fig. 5, the main transpor-tation work is observed to be from the left reservoir to the right reservoir. It is shown such that Q1 is in the negative direction showing water flowing out of the res-ervoir while Q3 is in the positive direction indicating water flowing in. Q2 on the other hand is shown to be oscillating at the initial level with pressure head of ±0.1 and flow rate of ±0.8. This shows that with a two-stage system, the middle reservoir serves as a transportation medium between the two end reservoirs. Similar phenomenon is also shown numerically in Ref (Lee and Chong 2016). The highest flow rate forQ1andQ3is ob-served to be at pressure head of 0.3 with flow rates of −1.5 and 1.35, respectively. The maximum pressure head of ±0.8 is shown where the flow rate reaches zero read-ing, giving a total pressure head of 1.6.
A three-stage system
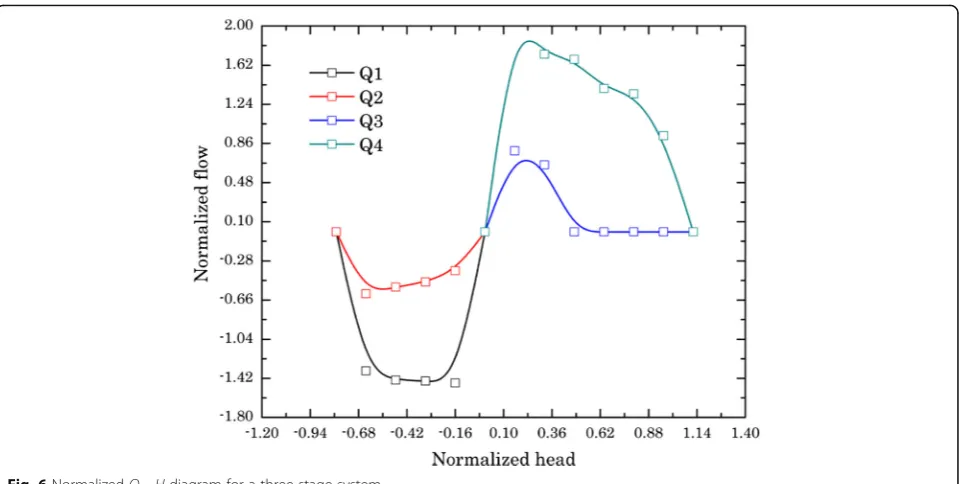
Flow rates of a three-stage system were measured and presented in Fig. 6. Flow rate in the first reservoir, Q1, is observed to increase drastically to the maximum flow rate at pressure head of−0.16, where gradient is shown to be extremely steep. The flow rate is then gradually decreases to−0.64 with very small gradient and stops at the maximum pressure head of −0.8. Similarly, for flow rate in the second reservoir, Q2stops at pressure head
of−0.8, the formation to the maximum flow rate is how-ever different such that the flow rate is observed to grad-ually increase to maximum at a pressure head of −0.64. Drastic drop is then observed from−0.64 to−0.8. Based on the figure, bothQ1andQ2are shown to have negative flow rates indicating them as the source reservoirs for the system.
Flow rate in the third reservoir,Q3, is observed to have positive flow indicating water flowing into the reservoir. The maximum flow rate is observed at pressure head of 0.16; the flow rate is then shown to decrease and stop at pressure head of 0.48. Based on the curve, flow rate in the third reservoir is observed to be minimal. Looking into Q4, high positive flow rate is observed to reach a maximum of 2.1 at pressure head of 0.16. Flow rate is then observed to decrease gradually until pressure head of 1.12. Based on the curves, it is observed that the main deliverable pumping work is from Q1and Q2to the last two reservoirs where flow rates are shown to be very high. Deliverable rates are observed to have double in-crement of 1.1 than the single-stage system. Normalized increment of 0.7 is observed between the two- and three-stage systems.pt?>
A four-stage system
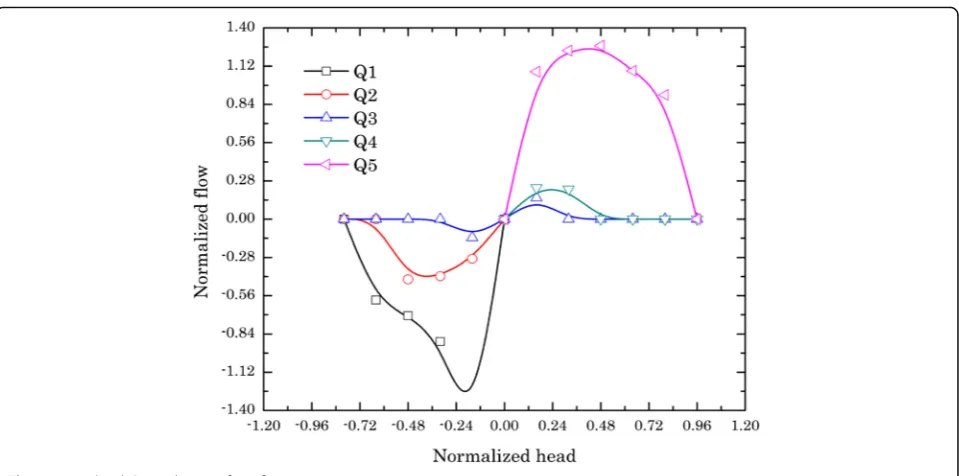
Figure 7 illustrates the Q−H diagram for a four-stage system. Based on the figure, it is shown that the source of water transportation is from Q1 and Q2. The main source is shown to be Q1, while Q2 is shown to be the secondary source similar to the three-stage system. The curve trend is however different such that Q1 reduces more drastically as compared to the three-stage system;
maximum flow rate is observed to be at the similar pres-sure head of−0.16. Q2is observed to have similar trend for both three- and four-stage system where the max-imum flow rate is observed to be at −0.48. Flow rate at the intermediate reservoir, Q3, is observed to oscillate around the initial pressure head, similar to the curve shown for two-stage system as shown in Fig. 5.
Q4andQ5are observed to be the deliverable reservoir where positive flow rates are shown in Fig. 7. Q4shows minimal flow rate and stops at pressure head of 0.48, similar to the curve shown in the three-stage system.Q5 on the other hand shows a higher flow rate as compared to Q4. Q5represents the final deliverable flow rate for a four-stage system and based on the flow rate shown; Q5 is obviously lower than the three-stage system, indicating that for a multi-stage open-loop impedance pump, the maximum number of stages that can be implemented with notable and significant enhancement is only limited to three-stages. It should be noted that this limitation is subjected only to a single and constant power source.
Performance analysis and evaluation
Performance of different stages in multi-stage open-loop impedance pump as function for pressure heads and flow rates was compared and analyzed. The per-formance was compared non-dimensionally where the pressure head is with respect to the initial pressure head at water level of 250 mm and the flow rate is with respect to the maximum flow rate induced (7.64 L min−1) in a conventional single-stage system. Performance of a single-stage system was made the
benchmark of comparison where the highest flow rate achieved is normalized to the number of 1. The pres-sure head on the other hand was observed to reach the highest increment of normalized value 0.6 giving a total pressure head difference of 1.2. The Q−H dia-gram of a single-stage system charting the perform-ance of single-stage system is shown in Fig. 4.
Extensive experiments were performed for the two-stage impedance pump on the complex parameters gov-erning its performance. A maximum pressure head of 0.8 was obtained giving a total pressure head difference of 1.6; this indicates an improvement of 33.3% on the achievable pressure head difference. The highest flow rate of 1.35 was induced in the two-stage system, show-ing an improvement of over 35% on the instantaneous flow rate in the system. Water was however observed to be oscillating at its initial water level in the interim level for a two-stage system. The interim reservoir also shown to be the transportation and driving mechanism for flow rate enhancement (Lee and Chong 2016).
The experiments on multi-stage were furthered with the investigation on a three-stage system. As shown in Fig. 6, maximum incremental pressure head was observed to be 1.12, giving a total pressure head difference between the first and last reservoir of 1.92. A percentage increment of 60% was observed in the pressure head with respect to a single-stage system. The maximum flow rate of 2.1 was observed for the three-stage system, showing an incre-ment of 110% as compared to the single-stage system. Comparison with the two-stage system shows an improve-ment of 20 and 55.6% in the pressure head and flow rate, respectively (Table 1).
Figure 7 shows theQ−Hdiagram of a four-stage sys-tem. A maximum pressure head of 0.96 with a total pressure head difference of 1.76 and maximum flow rate of 1.27. Comparing with the previous trend of per-formance of multi-stage system, the four-stage system had obviously decreases in its performance. A perform-ance increment of 46.7 and 27% was observed in the pressure head and flow rate respectively as compared to a single-stage system. Improvement of 10% in pres-sure head was shown comparing with two-stage system; it was however shown a decrease of 5.9% comparing flow rate in four- and two-stage system. A complete de-crease in performance was observed when comparing with the three-stage system where a percentage decre-ment of 8.3 and 39.5% was observed for the pressure head and flow rate, respectively.
Based on the experimental studies conducted, for an even number of multi-stage system, it is shown that the interim reservoir serves as a medium of fluid transportation where water is observed to oscillate around the initial water level. A separate study (Lee and Chong 2016) showed that the oscillation is due to the flow circulation within the reservoir, which works
Fig. 7NormalizedQ−Hdiagram for a four-stage system
Table 1Percentage differences comparison of maximum
achievable head and flow of different stages of impedance pump
Stage (s) Pressure head (%) Flow rate (%)
1 Benchmark Benchmark
2 33.3 35
3 60 110
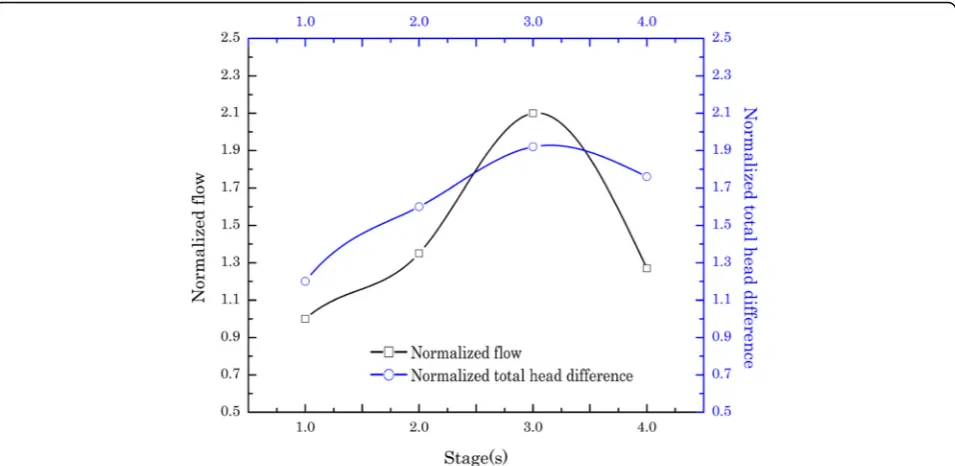
as driving mechanism in increasing the flow rates. For odd number of multi-stage system, transportation of fluid is observed to be the reflection of each other with respect to the symmetric of the system. Main work of fluid transportation is observed to be from the first reservoir from the left end of the system for all cases. As the studies on multi-stage system work with one single and constant power source, the perform-ance of different stages can be explicitly measured and compared. Actuators are drawing from only one power source through a parallel connection; therefore, less power will be drawn to the actuators as the number of stages increased. This will create less compression forces on the elastic tubes. With less compression in-duced from the mechanism due to lower power input, lower flow rate is generated. As the compression force and excitation frequencies are closely related to the speed of wave, it is therefore essential that the com-pression force is maintained such that the speed of wave is maintained at optimum for the highest effi-ciency for the system. Speed of wave of approximately 30 cm/s is observed in the tube, with the power input of 720 W and excitation frequency of 4.5 Hz. Perform-ance of the pump is observed to increase as the num-ber of stages increases. This can be observed in both the pressure heads and flow rates induced in this multi-stage system. Based on the studies performed, it is however shown that the maximum number of stages that the pump can go with power source of 720 W is three-stage as decline in performance is observed in the four-stage system; indicating the source power
input is incapable to produce the sufficient wave speed for the system to work at its finest.Q−Hperformance with respect to number of stages is presented in Fig. 8.
Conclusions
For a multi-stage system drawing power from a single constant power source, it is well expected that there would be a limitation to which the enhancement can reach. Analysis and evaluation on the pumping per-formance of such a multi-stage system are conducted in the current work to study the highest possible en-hancement with the increase of stages, as well as the system’s limitation. All studies are conducted using only a single power source of 720 W. A single-stage system was made the benchmark of multi-stage sys-tem here, where a normalized flow rate of 1 and nor-malized pressure head of 0.6 are established. With the increase in the number of stages, an improvement in the performance is observed. Enhancement of 35 and 33.3% is shown in the flow rate and pressure head re-spectively for a two-stage system. Enhancement of 110 and 60% is shown in flow rate and pressure head of a three-stage system in comparison to the single-stage system. For four-single-stage system, however, only 27 and 46.7% increments are demonstrated in the flow rate and pressure head, respectively. The implementa-tion of multi-stage system with single constant power input is demonstrated to be limited only to the three-stage system where the declined pumping perform-ance is exhibited in a four-stage system.
Acknowledgements
The authors would like to thank the Ministry of Science, Technology and Innovation of Malaysia for providing the financial support in this project; Faculty of Engineering and Science (Curtin University Sarawak) and Faculty of Engineering (University of Nottingham Malaysia Campus) for providing the facilities and equipment for conducting this research.
Authors’contributions
VCC conducted the experimental work, and contributed the major part of the paper. YA and KC participated in the analysis and evaluation of experimental data. All authors read and approved the final manuscript.
Competing interests
The authors declare that they have no competing interests.
Publisher’s Note
Springer Nature remains neutral with regard to jurisdictional claims in published maps and institutional affiliations.
Author details
1Faculty of Engineering and Science, Curtin University Sarawak Malaysia, CDT 250, 98009 Miri, Sarawak, Malaysia.2Faculty of Engineering, University of Nottingham Malaysia Campus, Jalan Broga, 43500 Semenyih, Selangor Darul Ehsan, Malaysia.
Received: 9 January 2017 Accepted: 1 March 2017
References
Avrahami, I., & Gharib, M. (2008). Computational studies of resonance wave pumping in compliant tubes.Journal of Fluid Mechanics, 608, 139–60. Hickerson, AI (2005). An experimental analysis of the characteristic behaviours of
an impedance pump. Ph.D. Thesis, California Institute of Technology. Lee, VCC, & Chong, JC (2016). Effects of intermediary reservoir in a two stage
impedance pump. In: International UNIMAS STEM ENCON 2016. Lee, V. C. C., Abakr, Y. A., Woo, K. C., & Al-Atabi, M. (2011). Experimental
investigation of open loop multi-stage impedance pumping system.Journal of Engineering Science and Technology, 6(5), 551–7.
Lee, V. C. C., Abakr, Y. A., & Woo, K. C. (2013). Valveless pumping using a two-stage impedance pump.Frontiers in Mechanical Engineering, 8(3), 311–8. Lee, V. C. C., Gan, H. S., Abakr, Y. A., & Woo, K. C. (2014). Bulk flow behaviour of a
two-stage impedance pump.Engineering Letters, 22, 53–62.
Lee, V. C. C., Abakr, Y. A., & Woo, K. C. (2015). Dynamics of fluid in oscillatory flow: the Z component.Journal of Engineering Science and Technology, 10(10), 1361–71.
Liebau, G. (1954). Über ein ventilloses pumpprinzip.Naturwissenschaften, 41, 327 (in German).
Liebau, G. (1955). Die stromungsprinzipien des herzens.Zietschrift f’r Kreislauf-forschung, 44, 677–84 (in German).
Loumes, L (2007). Multilayer impedance pump: a bio-inspired valveless pump with medical applications. Ph.D. Thesis, California Institute of Technology. Manopoulus, C. G., Mathioulakis, D. S., & Tsangaris, S. G. (2006). One dimensional
model of valveless pumping in a closed loop and a numerical simulation. Physics of Fluids, 18, 017106.
Meier, J (2011). A novel experimental study of a valveless impedance pump for applications at Lab-On-Chip, microfluidic, and biomedical device size scales. Ph.D. Thesis, California Institute of Technology.
Rinderknecht, D., Hickerson, A. I., & Gharib, M. (2005). A valveless micro impedance pump driven by electromagnetic actuation.Journal of Micromechanics and Microengineering, 15, 861–6.
Rosenfeld, M., & Avrahami, I. (2010). Net flow rate generation by a multi-pincher impedance pump.Computers and Fluids, 39(9), 1634–43.
Timmermann, S., & Ottesen, J. T. (2009). Novel characteristics of valveless pumping.Physics of Fluids, 21, 053601.
Submit your manuscript to a
journal and benefi t from:
7 Convenient online submission
7Rigorous peer review
7 Immediate publication on acceptance 7Open access: articles freely available online 7 High visibility within the fi eld
7Retaining the copyright to your article