ORIGINAL ARTICLE
Physiological effects of visual stimulation
with full-scale wall images composed
of vertically and horizontally arranged wooden
elements
Masashi Nakamura
1†, Harumi Ikei
2,3†and Yoshifumi Miyazaki
3*Abstract
Wood is a raw material that is used not only in the production of structural members for various buildings, but also in the interior finishes that are directly seen and touched by the occupants. Wood has also been recognized as a human-friendly material, but few studies have experimentally confirmed the physiological benefits it brings to humans. There-fore, the aim of the present study was to investigate the physiological effects of visual stimulation with wood. Two types of full-scale square, wooden-wall images composed of vertically or horizontally arranged lumber, were prepared using computer graphics and projected onto a large display to create the visual stimuli, and a gray image was also prepared as a control. Twenty-eight female Japanese university students participated in the study. The participants initially spent 60 s viewing the gray background (rest period) and then observed each of the wooden-wall images and the gray image separately in a random order for 90 s each. During the visual stimulation, the oxyhemoglobin (oxy-Hb) concentration as an indicator of prefrontal brain activity and heart rate variability as an indicator of autonomic nervous activity were continuously measured in each participant. Subjective evaluation of each visual stimulus was then performed using a modified semantic differential method and the Profile of Mood States 2nd Edition test. It was found that visual stimulation with either of the wooden interior wall images induced a significant decrease in oxy-Hb concentration in the left and right prefrontal cortex compared with the gray image. Furthermore, the subjective evaluation showed that the wooden-wall images provided a significantly more “comfortable,” “relaxed,” and “natural” impression than the gray image and decreased the negative mood states, with the vertically arranged wooden-wall image having a more positive effect than the horizontally arranged image.
Keywords: Wood, Wooden interior wall, Horizontally arranged wall, Vertically arranged wall, Visual stimulation, Near-infrared spectroscopy, Heart rate variability, Physiological relaxation, Psychological benefit
© The Author(s) 2019. This article is distributed under the terms of the Creative Commons Attribution 4.0 International License (http://creat iveco mmons .org/licen ses/by/4.0/), which permits unrestricted use, distribution, and reproduction in any medium, provided you give appropriate credit to the original author(s) and the source, provide a link to the Creative Commons license, and indicate if changes were made.
Introduction
Wood is one of the most important natural materials in modern-day human living environments. Wood is used not only as a structural material in various architectural buildings, but also an interior material that is directly seen and touched by building occupants. One plausible
explanation for why wood has been used by humans for such a long time is that it brings various psychological and physiological benefits, as the warm color and various grain patterns of wood stimulate humans visually, while its low thermal conductivity and moderate hardness and stiffness bring tactual warmth and softness.
In modern society, people spend a considerable length of time indoors. Consequently, research has been under-taken to better understand the positive psychological and physiological effects of the natural environment on humans [1–3], which has led to an increased focus on creating natural environments indoors to improve
Open Access
*Correspondence: [email protected]
†Masashi Nakamura and Harumi Ikei are co-first authors who contributed equally to this work
3 Center for Environment, Health and Field Sciences, Chiba University, Kashiwa, Chiba 227-0882, Japan
occupants’ well-being [4], and the use of wood for inte-rior treatments may be considered one way of bringing nature indoors [5–7].
The progress of studies on the relationships between wood and human has been still insufficient to date. However, the psychological benefits that wood brings to humans have been relatively well examined [5, 8]. These studies have mainly focused on the psychologi-cal responses evoked by visual, haptic, and/or olfactory stimulation by wood using sensory evaluation methods [9–16]. A part of these studies was developed into the marketing research of wood products [17–20]. Some multi-modal studies have also been carried out [21, 22].
By contrast, few studies have experimentally inves-tigated the physiological benefits of wood to humans. In a recent review of approximately 50 published arti-cles on psychophysiological responses to interior wood treatments, Burnard et al. [4] attempted to classify the research into three categories: “environmental,” “psycho-logical,” and “biological”. However, only four of the 50 articles were placed in the biological (i.e., physiological) category. Furthermore, while Ikei et al. [23] commented that the amount of research on the physiological effects of wood on humans was gradually increasing, only five of the 41 articles published between 1992 and 2016 that they reviewed focused on the physiological effects of visual stimulation with wood, compared with 20 arti-cles that considered olfactory stimulation by wood. In addition, Nakamura [24] found that only 8 of 60 articles published between 1986 and 2011 that focused on wood and wooden interiors as visual stimuli used some kind of physiological indices to evaluate the human responses that were evoked by wood.
Due to this lack of research, the physiological effects of visual stimulation with wood and wooden products are almost completely unknown, despite the frequent use of wood for interior walls, floors, ceilings, and furniture. Consequently, several important questions still remain unanswered, such as does wood act as a visual stimulus and provide humans with physiologically positive effects? How much wood is needed in the interior space to bring a physiologically positive effect on occupants? Do knots, which are often avoided for visual aesthetic reasons [25,
26], actually lead to physiologically negative effects on observers? Does a different lumber arrangement on the interior walls (i.e., vertical vs. horizontal) affect the physi-ological effect on observers?
The aim of the present study was to examine the physi-ological effects of visual stimulation with wood. To do this, participants were asked to observe different wooden interior wall images, during which time the activities in the left and right prefrontal cortex and heart rate
variability were measured as indices of their central and autonomic nervous system activities, respectively.
Methods Participants
Twenty-eight female Japanese university students partici-pated in the present study. These participants had a mean age (± standard deviation) of 22.3 ± 2.1 years, mean right and left eyesight scores of 1.0 ± 0.2 and 1.0 ± 0.3 (includ-ing corrected), a mean height of 158.8 ± 6.0 cm, and a mean weight of 51.9 ± 5.9 kg. Individuals who smoked were being treated for any disease, or had their menstrual period during the study period were excluded from the study. All participants were informed about the aim and procedures of the study, following which they gave writ-ten consent to participate. The study was conducted in accordance with the guidelines of the Declaration of Hel-sinki, and the protocol was approved by the Ethics Com-mittee of the Center for Environment, Health and Field Sciences, Chiba University, Japan (project identification code number 35) and was registered in the University Hospital Medical Information Network of Japan (UMIN; unique ID: UMIN000034011).
Visual stimulation
Preparation of wooden‑wall images
Presentation of visual stimuli
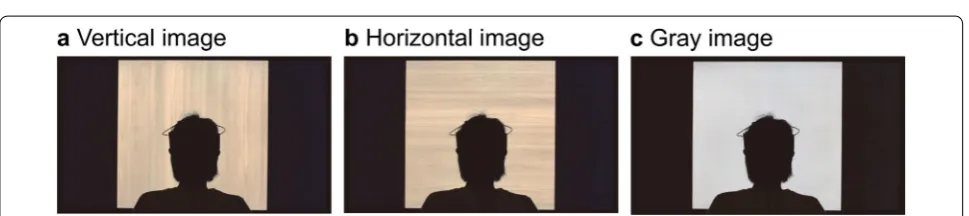
The three images shown in Fig. 1 were presented to each of the participants as visual stimuli. The images were projected at a size of 1053 mm × 1053 mm onto
a 4 K-compatible high-vision liquid-crystal display that was 1872 mm wide, 1053 mm high, and had a resolu-tion of 3840 × 2160 pixels (85 V type, TH-85AX900;
Panasonic, Osaka, Japan).
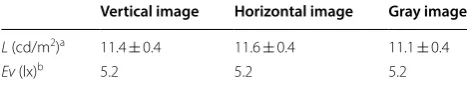
The display was set in a dark experimental chamber and each participant sat in an office chair located 1.1 m away from the display. The brightness of the display was adjusted to a relatively low level to avoid eyestrain of the participants who were observing the visual stimuli consecutively. The luminance of the display and illu-minance at eye level for the participants were meas-ured using a color meter (CS-100A; Konica Minolta, Tokyo, Japan) and an illuminance spectrophotometer (CL-500A; Konica Minolta, Tokyo Japan), respectively, which showed that all images provided almost the same luminance and illuminance (Table 1).
Study protocol
Physiological measurements were performed in an arti-ficial climate chamber that was maintained at 24 °C, 50% relative humidity, and 50 lx illumination at the Center for Environment, Health and Field Sciences, Chiba Univer-sity. Each participant received an exposition of the exper-iment in a waiting room before entering the chamber. After fitting the sensors for physiological measurement, each participant received a description of the measure-ment procedure while seated and observed a dummy image (a brick wall) as an experimental rehearsal. The display was then switched to a gray background and the lights in the room were turned off. The participants viewed the gray background for 60 s (rest period), follow-ing which they observed each of the wooden-wall images and gray image separately for 90 s each while remaining seated. The wooden-wall images and gray image were presented in a random order for each participant to elim-inate any potential viewing order effects. During the vis-ual stimulation, the participants’ physiological responses were continuously measured. Following the visual stim-ulation, the display was switched to a dark background, the lights were turned on, and a subjective evaluation was conducted. Figure 2 outlines the experimental procedure that was used, while Fig. 3 shows three scenes during the visual stimulation.
Physiological measurements
Near‑infrared time‑resolved spectroscopy (TRS)
TRS was used to indicate the participants’ brain activi-ties during the visual stimulation [27, 28]. This method is based on the principle that an increase in local brain activity causes the blood flow to the brain to increase, leading to significant perfusion, such that the quantity of brain blood flow exceeds oxygen consumption [29].
Fig. 1 Three images that were used as the visual stimuli. a Wooden interior wall image arranged vertically; b wooden interior wall image arranged horizontally; c gray image (control)
Table 1 Physical properties of the three images that were projected on the large display
L luminance of the display, Ev illuminance at eye level for the participants
aL was measured at five points at equal intervals in the vertical and horizontal
directions using a color meter (CS-100A; Konica Minolta, Tokyo, Japan) and the mean and standard deviation were calculated (mean ± SD)
bEv was measured three times at eye level for the participants using an
illuminance spectrophotometer (CL-500A; Konica Minolta, Tokyo Japan) and the average value was calculated. The variation in Ev values was very low (from 5.21 lx to 5.26 lx)
Vertical image Horizontal image Gray image
L (cd/m2)a 11.4 ± 0.4 11.6 ± 0.4 11.1 ± 0.4
Consequently, the oxyhemoglobin (oxy-Hb) concentra-tion increases, which can be detected by the change in absorbance of near-infrared light irradiating the brain. Hoshi et al. [30] reported that increases or decreases in the quantity of blood flow in the brain are consistent with changes in oxy-Hb. After its discovery in 1992, Ferrari et al. [31] presented a brief historical overview of func-tional near-infrared spectroscopy in 2012 that funcfunc-tional activation of the human cerebral cortex associated with oxygenation and hemodynamic changes can be explored using near-infrared spectroscopy (NIRS). TRS was one of the NIRS approaches that progressed over these 20 years.
The prefrontal cortex is a part of the brain that is responsible for higher order judgements, such as problem-solving and decision-making. Cui et al. [32] scanned participants using simultaneous NIRS (plac-ing NIRS probes over the frontal brain region includ(plac-ing the prefrontal region) and functional magnetic reso-nance imaging during a battery of cognitive tasks and found that NIRS signals were highly correlated with functional magnetic resonance imaging measurements. This finding suggests that NIRS enables the detection of
brain activity in the prefrontal cortex region. Some pre-vious studies reported that the oxy-Hb concentration in the prefrontal cortex significantly reduced and the sub-jective relaxed feeling significantly improved simulta-neously in participants who had been exposed to visual [33–35], tactile [36–38], auditory [39], or olfactory [40] stimulation.
Considering these findings, in the present study, sen-sors were mounted on each participant’s forehead at approximately Fp1 and Fp2 of the international 10–20 system for electroencephalography, and the oxy-Hb concentration in the left and right prefrontal cortex was measured during the 60-s rest period and each 90-s visual stimulation period using the TRS-20 sys-tem (Hamamatsu Photonics, Shizuoka, Japan). Since the data-sampling interval of the TRS-20 system fluctuated from 1.07 to 1.12 s, the interval was converted to 1.0 s for each data point using a linear interpolation technique to obtain 1-Hz data for the oxy-Hb concentration in the left and right prefrontal cortex. The difference of each data point from the mean value during the last 30 s of the rest period was then calculated. In addition, the overall mean
Fig. 2 Diagram of the experimental protocol. Horizontal and vertical wooden-wall images and gray image (control) were presented in a random order to each participant to eliminate any potential viewing order effects. TRS near-infrared time-resolved spectroscopy; HRV heart rate variability
Fig. 3 Scene during visual stimulation. a Wooden interior wall image arranged vertically; b wooden interior wall image arranged horizontally; c
value during each 90-s visual stimulation period was calculated.
Heart rate variability (HRV) and heart rate
The HRV and heart rate of each participant were meas-ured as indicators of the autonomic nervous system activity [41, 42]. HRV was analyzed for the periods between consecutive R waves (RR intervals) on an trocardiogram that was measured using a portable elec-trocardiograph (Activtracer AC-301A; GMS, Tokyo, Japan), with a sampling frequency of 1 kHz. The power levels of the low-frequency (LF; 0.04–0.15 Hz) and high-frequency (HF; 0.15–0.40 Hz) components of HRV were then calculated using the maximum-entropy method (MemCalc/Win; GMS, Tokyo, Japan). The HF power was considered to reflect parasympathetic nervous activity, which is generally enhanced during relaxation, while the LF-to-HF ratio (LF/HF) was considered to reflect sym-pathetic nervous activity, which is enhanced at the time of awakening or in stressful situations. To normalize the HRV parameters across the participants, a natural loga-rithmic transformation was applied to the calculated val-ues [43]. Changes in the values of HF and LF/HF every 30 s and the overall mean during each 90-s visual stimu-lation period were determined.
Psychological measurements
Psychological measurements were performed using a modified semantic differential (SD) method and the Profile of Mood State 2nd Edition (POMS 2). The SD method subjectively assesses the mental state of a par-ticipant through a questionnaire that is composed of pairs of opposing adjectives, each of which is evaluated on a 13-point scale [44]. In the present study, the four adjective pairs “comfortable–uncomfortable,” “relaxed– awakening,” “natural–artificial,” and “varied–ordered” were used to evaluate the extent of feeling comfortable, relaxed, natural, and homogeneous, respectively.
The POMS 2 is a well-established measure of psy-chological distress derived from factor analysis that has been shown to have high levels of reliability and valid-ity [45–48]. This test simultaneously evaluates seven moods: tension–anxiety (T–A), depression–dejec-tion (D–D), anger–hostility (A–H), fatigue–inertia (F–I), confusion–bewilderment (C–B), vigor–activity (V–A), and friendliness (F). The total mood disturbance (TMD) score is then calculated from the formula [(T– A) + (D–D) + (A–H) + (F–I) + (C–B) − (V–A)]. The TMD score reflects the general mood state, whereby the higher the score is, the more negative are the feelings of the par-ticipant and vice versa. In the present study, the Japanese
version of the POMS 2 was used, which is a shortened form with 35 questions, to reduce the burden on the participants.
Statistical analysis
Physiological responses to the three visual stimuli (the vertically and horizontally arranged wooden-wall images and the gray wall image) were examined by compar-ing changes in the physiological indices and the overall mean values over the 90-s visual stimulation periods using paired t tests with the Holm correction. To exam-ine differences in the psychological indices among three wall images, the Wilcoxon signed-rank test was used with the Holm correction. In both cases, two-sided tests were used, because it was unknown which wooden-wall image would bring the more restful state to the participants physiologically and psychologically. All statistical analy-ses were performed using the Statistical Package for the Social Sciences software (SPSS version 21.0; IBM Corp., Armonk, NY, USA), and a p value of less than 0.05 was considered statistically significant.
Results
Physiological effects TRS
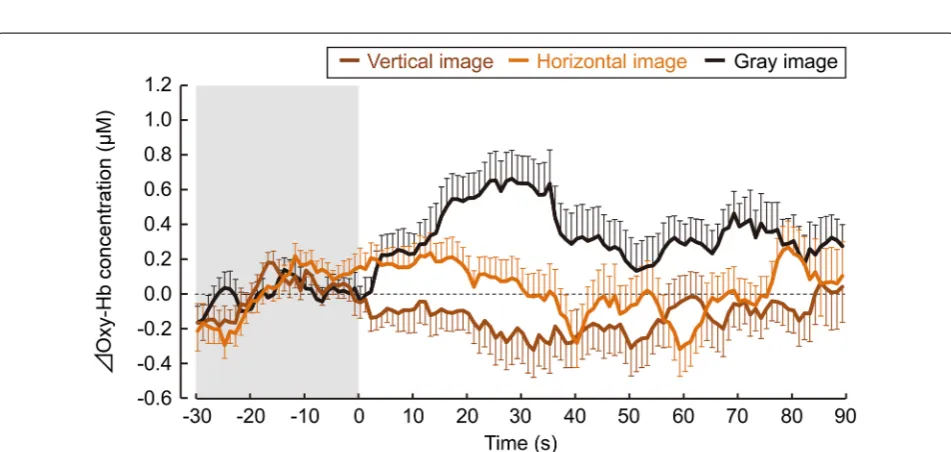
Changes in the oxy-Hb concentrations in the left and right prefrontal cortex during visual stimulation are shown in Figs. 4 and 5, respectively. During observation of the vertical wooden-wall image, the Oxy-Hb concentration gradually decreased in the first half of the observation period and then mostly remained below zero thereafter. By contrast, when the gray image was observed, the oxy-Hb concentrations in the left and right prefrontal cortex immediately increased at the start of the observation period and remained higher than the initial levels with the two wooden-wall images throughout the observation period. Finally, in the case of the horizontal wooden-wall image, the oxy-Hb concentra-tion laid between that of the gray and vertical wooden-wall images and was slightly greater than zero during most of the visual stimulation period. There was no significant dif-ference in the mean oxy-Hb concentration baseline dur-ing the last 30-s rest period (gray areas in Figs. 4, 5) among the three visual stimuli [left prefrontal cortex: vertical image = 44.92 ± 1.13 µM (mean ± standard error), horizon-tal image = 45.36 ± 1.16 µM, gray image = 45.42 ± 1.22 µM; right prefrontal cortex: vertical image = 43.90 ± 1.23 µM, horizontal image = 44.57 ±1.20 µM, and gray image = 43.67 ± 1.33 µM]. The unit M indicates molar con-centration, and it equals to mol/dm3.
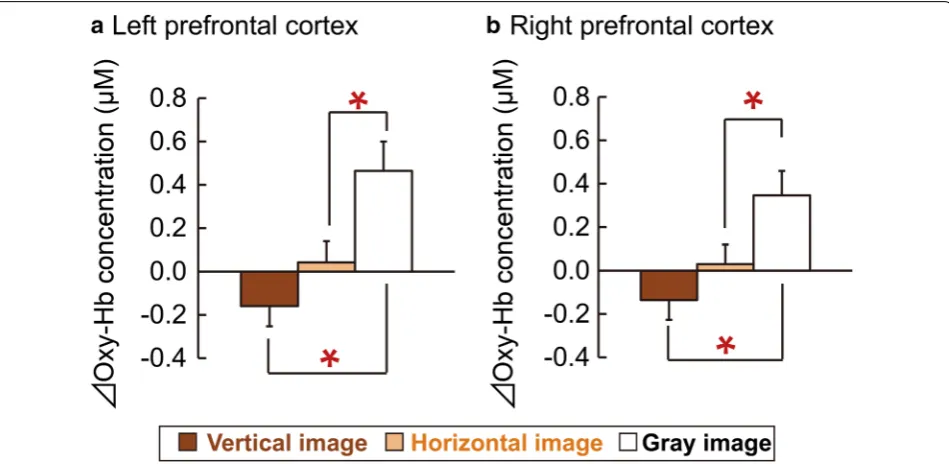
the gray image are shown in Fig. 6. Observation of the wooden-wall images led to significantly lower oxy-Hb concentrations than observation of the gray image in the left and right prefrontal cortex (left prefrontal cortex: vertical image =− 0.16 ± 0.09 µM, horizontal
image = 0.04 ± 0.10 µM, gray image = 0.46 ± 0.14 µM; right prefrontal cortex: vertical image =− 0.14 ± 0.09 µM, hori-zontal image = 0.03 ± 0.09 µM, gray image 0.35 ± 0.11 µM). Although the overall mean oxy-Hb concentration was lower during observation of the vertical wooden-wall
Fig. 4 Changes in the oxyhemoglobin (oxy-Hb) concentrations in the left prefrontal cortex. The oxy-HB concentrations of participants during visual stimulation with vertical and horizontal wooden-wall images and a gray image (control) were measured every second over a 90-s period. The difference in each data point from the mean value during the last 30 s of the rest period (gray area) is presented in this chart. Data are expressed as means ± standard errors (N= 28)
image than during observation of the horizontal wooden-wall image, this difference was not significant.
HRV and heart rate
There were no significant differences in the HF value (an index of parasympathetic nervous activity), the LF/HF ratio (an index of sympathetic nervous activ-ity), or the heart rate of participants among the three visual stimuli (i.e., the horizontal wooden wall, vertical wooden wall, and gray images). The changes in the 30-s means and overall means of the HF value, LF/HF ratio, and heart rate are shown in Additional file 1: Figs. S1– S3, respectively.
Psychological effects
Figure 7 shows the results of the modified SD method, which was used to evaluate the subjective feelings of “comfortable–uncomfortable,” “relaxed–awakening,” “natural–artificial,” and “varied–ordered” among ticipants after the observation of each image. The par-ticipants had significantly more “comfortable,” “relaxed,” “natural,” and “varied” feelings after they had observed the wooden-wall images compared with the gray image (p< 0.05). Furthermore, observation of the vertical wooden-wall image evoked a significantly more “relaxed” feeling than the horizontal wooden-wall image and the gray image (p < 0.05).
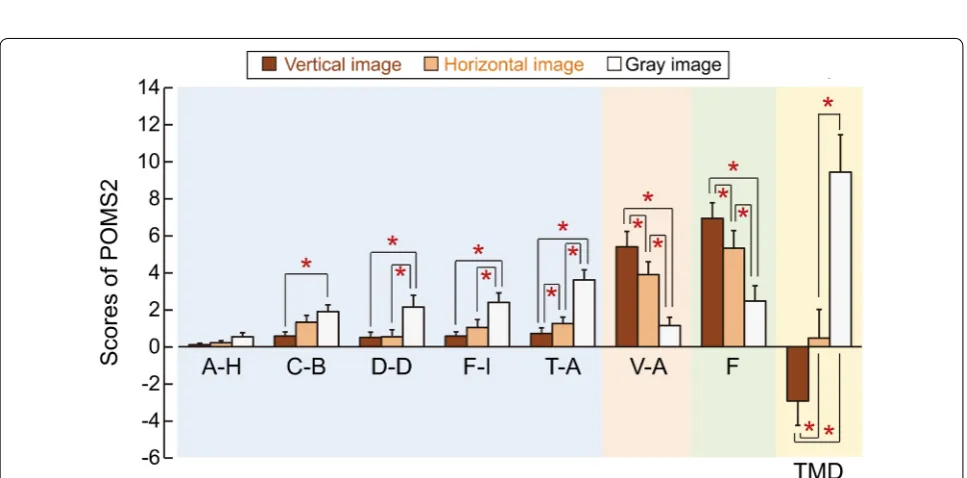
In the POMS 2 test, significant differences were detected among the wooden wall and gray images for
all POMS 2 subscales except A–H (Fig. 8). The negative mood state scores of the D–D, F–I, and T–A subscales were significantly lower for the wooden-wall images than for the gray image (p < 0.05), while the negative mood state score of the C–B subscale was significantly lower for the vertical wooden-wall image than for the gray image (p < 0.05). Furthermore, in the T–A subscale, the score was also significantly lower for the vertical wooden-wall image than for the horizontal wooden-wall image (p < 0.05). By contrast, the positive mood state scores of the V–A and F subscales were significantly higher for the wooden-wall images than for the gray image (p < 0.05), as well as for the vertical wooden-wall image compared with the horizontal wooden-wall image (p < 0.05). The TMD score, which pro-vides a comprehensive assessment of the negative mood state, was significantly lower for the wooden-wall images than for the gray image (p < 0.05) and was also signifi-cantly lower for the vertical wooden-wall image than for the horizontal wooden-wall image (p < 0.05) (Fig. 8).
Discussion
The present study examined the physiological effects of visual stimulation with wooden-wall images by assess-ing the left and right prefrontal cortex activities through measurement of the oxy-Hb concentrations using TRS and the autonomic nervous activity through measure-ment of HRV and the heart rate. In addition, the psy-chological effects were also examined through subjective assessments by the participants.
Fig. 6 Overall mean oxyhemoglobin (oxy-Hb) concentrations in the left and right prefrontal cortex. The oxy-HB concentrations of participants are shown for the entire 90-s observation period during visual stimulation with vertical and horizontal wooden-wall images and a gray image (control).
It was found that visual stimulation with wooden-wall images projected on a large display significantly decreased the oxy-Hb concentrations in the left and right prefrontal cortex based on the overall mean values during the 90-s observation period, but had no significant effect on the autonomic nervous activities of the participants
(HRV and heart rate). Similarly, Song et al. [35] reported that a significant decrease in the oxy-Hb concentration in the right prefrontal cortex of the observers who were vis-ually stimulated with a forest image projected on a large screen compared with that of the observers who were vis-ually stimulated with a city image. However, they found
Fig. 7 Subjective evaluations of participants based on the modified semantic differential method questionnaire. The questionnaire was given to participants after viewing vertical and horizontal wooden-wall images and a gray image (control). a Comfortable feeling; b relaxed feeling; c natural feeling; d homogeneous feeling. Values are means ± standard errors (N= 28). * p < 0.05 (Wilcoxon signed-rank test with the Holm correction)
no significant effect on autonomic nervous system activi-ties. In a screen image study on oxy-Hb concentration changes in the prefrontal cortex, Hoshi et al. [49] showed that pleasant feelings decrease oxy-Hb concentrations, whereas unpleasant feelings increase its concentrations. Taken together, the significant decrease in oxy-Hb con-centrations in the left and right prefrontal cortices found in the present study suggests that visual stimulation with wooden-wall images can effectively calm prefrontal cor-tex activities while having no impact on autonomic nerv-ous system activities.
In the present study, significant decreases in the oxy-Hb concentration were noted in the left and right pre-frontal cortices. In the previous TRS studies using various sensory stimuli, significant differences were noted in only the left prefrontal cortex [34, 37, 50], only the right pre-frontal cortex [33, 35, 39, 40, 51, 52], or both cortices [36, 38, 53–55]. Thus, it is not clear whether a significant decrease in the oxy-Hb concentration occurs in the right prefrontal cortex, left prefrontal cortex, or both cortices, and further investigations are needed in the future.
As the significant effects of visual stimulation on the autonomic nervous activities of participants (HRV and heart rate) have been confirmed many times previously [34, 52, 56–58], measurements and analyses similar to those in the previous studies were adopted in the present study. However, no significant differences were noted in the HF value, LF/HF ratio, and heart rate of participants in the present study. It is possible that the visual stimula-tion used in the present study was insufficient to induce significant changes in autonomic nervous activities, although it was sufficient with regard to prefrontal cortex activity. The suspected impact of some factors, such as the spectral characteristics of the large display to present the visual stimuli, type of grain pattern, and magnitude of the contrast of grain pattern, on the results should be verified in the future experiments. Nevertheless, the pre-sent study provides the first evidence of the physiologi-cal effects produced by visual stimulation with full-sphysiologi-cale wooden-wall images presented on a large display.
The results of the subjective evaluations were consist-ent with those for the prefrontal cortex activities. With the modified SD method, the scores for “comfortable,” “relaxed,” “natural,” and “varied” feelings were signifi-cantly higher for the wooden-wall images than for the gray image (Fig. 7), while in the POMS 2 test, the negative mood state scores of the D–D, F–I, and T–A subscales and the TMD score were significantly lower and the posi-tive mood state scores of the V–A and F subscales were significantly higher for the wooden-wall images than for the gray image (Fig. 8). These findings support the observed calming down of the prefrontal cortex activi-ties by the observation of the wooden-wall images, as
this would lead to these positive psychological responses. One particularly interesting finding was that the wooden-wall images were evaluated as being slightly “varied”— i.e., were neither “ordered” nor excessively “varied” visually—which probably affected the physiological and/ or psychological responses of the participants.
In terms of the two wooden-wall images, the vertical wooden-wall image had a significantly higher score for “relaxed” feeling with the modified SD method (Fig. 7) and significantly lower scores on the T–A subscale and for TMD and significantly higher scores on the V–A and F subscales in the POMS 2 test (Fig. 8) than the horizontal wooden-wall image. In addition, the oxy-Hb concentra-tions in the left and right prefrontal cortex tended to be lower during the 90-s observation of the vertical wooden-wall image than during observation of the horizontal wooden-wall image (Figs. 4, 5), although the difference in the overall mean oxy-Hb concentrations in both wooden-wall images was not statistically significant (Fig. 6), indicat-ing that the psychological effect of the visual stimulation with the vertical wooden-wall image was consistent with the prefrontal brain activity. As shown in Fig. 6, visual stim-ulation involving the vertical wooden-wall image provided negative values of the overall mean oxy-Hb concentrations in the left and right prefrontal cortices, whereas the hori-zontal wooden-wall image provided slightly positive val-ues. This difference in the activities of the prefrontal cortex between vertical and horizontal wooden-wall images might affect the above-mentioned subjective evaluations.
The vertical and horizontal wooden-wall images were essentially identical, originating from the same image rotated by 90 degrees, and yet they elicited different physiological and psychological responses. This strongly suggests that the strength of the positive effect of visual stimulation with natural materials such as wood will depend on the design of the interior walls. This is the first observation of the vertical and horizontal arrangements of wooden-wall images having different physiological and psychological effects, so the mechanism that causes this difference is currently unknown. Therefore, a differ-ent experimdiffer-ental design and new visual stimuli should be used in the future to confirm this finding.
Conclusions
Visual stimulation with wooden-wall images signifi-cantly decreased the oxy-Hb concentrations in the left and right prefrontal cortex compared with observa-tion of a gray image, indicating a calming of the pre-frontal cortex activities. Furthermore, the observation of the wooden-wall images had a positive psychologi-cal effect on participants, significantly improving the perception of “comfortable,” “relaxed,” and “natural” feelings, and bringing about positive mood states and significantly repressing negative mood states, which is consistent with the observed changes in the prefrontal cortex activities. Together, these findings indicate that the observation of a wooden-wall image induces physi-ological and psychphysi-ological relaxation.
Supplementary information
Supplementary information accompanies this paper at https ://doi. org/10.1186/s1008 6-019-1834-0.
Additional file 1. Additional figures.
Abbreviations
TRS: near-infrared time-resolved spectroscopy; oxy-Hb: oxyhemoglobin; HRV: heart rate variability; HF: high frequency; LF: low frequency; SD: semantic differential; POMS 2: profile of mood state 2nd edition; T–A: tension–anxiety; D–D: depression–dejection; A–H: anger–hostility; F–I: fatigue–inertia; C–B: confusion–bewilderment; V–A: vigor–activity; F: friendliness; TMD: total mood disturbance.
Acknowledgements
The authors are grateful to Tokyo log wholesalers’ association for their appro-priate discussion.
Authors’ contributions
MN contributed to the conceptualization, investigation, methodology, visuali-zation, and writing of the original draft. HI contributed to the conceptualiza-tion, data curaconceptualiza-tion, formal analysis, investigaconceptualiza-tion, methodology, visualizaconceptualiza-tion, and review and editing of the report. YM contributed to the conceptualiza-tion, data curaconceptualiza-tion, funding acquisiconceptualiza-tion, investigaconceptualiza-tion, methodology, project administration, supervision, validation, visualization, and review and editing of the report. All authors read and approved the final manuscript.
Funding
This work was performed as part of a research project Funded by Tokyo log wholesalers’ association.
Availability of data and materials
The data sets used and/or analyzed during the current study are available from the corresponding author on reasonable request.
Competing interests
The authors declare that they have no competing interests.
Author details
1 Graduate School of Agriculture, Kyoto University, Sakyo-ku, Kyoto 606-8502, Japan. 2 Forestry and Forest Products Research Institute, Tsukuba, Ibaraki 305-8687, Japan. 3 Center for Environment, Health and Field Sciences, Chiba University, Kashiwa, Chiba 227-0882, Japan.
Received: 25 June 2019 Accepted: 1 October 2019
References
1. Ulrich RS, Simons RF, Losito BD, Fiorito E, Miles MA, Zelson M (1991) Stress recovery during exposure to natural and urban environments. J Environ Psychol 11:201–230
2. Kaplan S (1995) The restorative benefits of nature: toward an integrative framework. J Environ Psychol 15:169–182
3. Song C, Ikei H, Miyazaki Y (2016) Physiological effects of nature therapy: a review of the research in Japan. Int J Environ Res Public Health 13:781 4. Burnard MD, Kutnar A (2015) Wood and human stress in the built indoor
environment: a review. Wood Sci Technol 49:969–986
5. Rice J, Kozak RA, Meitner MJ, Cohen DH (2006) Appearance wood prod-ucts and psychological well-being. Wood Fiber Sci 38:644–659 6. Nyrud AQ, Bysheim K, Bringslimark T (2010) Health benefits from wood
interior in a hospital room. In: SWST (ed) Proceedings of the international convention of Society of Wood Science and Technology and United Nations Economic Commission for Europe– Timber committee. Geneva, Switzerland, October, 11–14 2010. Society of Wood Science and Technol-ogy and United Nations Economic Commission for Europe, Paper WS–56 7. Fell D (2010) Wood in the human environment: Restorative properties
of wood in the built indoor environment. PhD Dissertation, University of British Columbia, Vancouver, BC, Canada
8. Nyrud AQ, Bringslimark T (2010) Is interior wood use psychologically ben-eficial? A review of psychological responses toward wood. Wood Fiber Sci 42:1–17
9. Broman NO (1995) Attitudes toward Scots pine wood surface: a multivari-ate approach. Mokuzai Gakkaishi 41:994–1005
10. Broman NO (1996) Two methods for measuring people’s preferences for Scots pine wood surfaces: a comparative multivariate analysis. Mokuzai Gakkaishi 42:130–139
11. Nakamura M, Miyake Y, Nakano T (2012) Effect of image characteristics of edge-grain patterns on visual impressions. J Wood Sci 58:505–512 12. Nakamura M, Nakagawa S, Nakano T (2015) Evaluation of visual impact of
multiple image characteristics observed in edge-grain pattern. J Wood Sci 61:19–27
13. Overvliet KE, Soto-Faraco S (2011) I can’t believe this isn’t wood! An inves-tigation in the perception of naturalness. Acta Psychol 136:95–111 14. Nakamura M, Kikuchi Y, Hotta S, Fujiwara Y, Konoike T (2018) Evaluation of
the sensory roughness of some coated wood surfaces by image analysis. Eur J Wood Wood Prod 76:1571–1580
15. Miyazaki Y, Yatagai M, Kobayashi S (1993) Sensory evaluation of essential oils and their components. Mokuzai Gakkaishi 39:843–848 (in Japanese)
16. Terauchi F, Aoki H, Ohgama T, Kubo M, Suzuki T (1994) Evaluation of odors from woods and wood oils–Odors from extracts using supercritical carbon dioxide and essential oils by hot water distillation from coniferous woods. Bull JSSD 41:11–18 (in Japanese)
17. Jonsson O, Lindverg S, Roos A, Lindström M (2008) Consumer percep-tions and preferences on solid wood, wood-based panels, and compos-ites: a repertory grid study. Wood Fiber Sci 40:663–678
18. Nyrud AQ, Roos A, Rødbotten M (2008) Product attributes affect-ing consumer preference for residential deck materials. Can J For Res 38:1385–1396
19. Manuel A, Leonhart R, Broman O, Becker G (2015) Consumers’ percep-tions and preference profiles for wood surfaces tested with pairwise comparison in Germany. Ann For Sci 72:741–751
20. Manuel A, Leonhart R, Broman O, Becker G (2016) How do consumers express their appreciation of wood surfaces? Norway spruce floors in Germany as an example. Ann For Sci 73:703–712
21. Hotta S, Kikuchi Y, Nakamura M, Konoike T, Yamauchi K (2017) Effect of surface appearance on tactile roughness of coated wood. J Soc Mater Sci Jpn 66:719–724 (in Japanese)
22. Dematté ML, Zucco GM, Roncato S, Gatto P, Paulon E, Cavalli R, Zanetti M (2018) New insights into the psychological dimension of wood-human interaction. Eur J Wood Wood Prod 76:1093–1100
23. Ikei H, Song C, Miyazaki Y (2017) Physiological effect of wood on humans: a review. J Wood Sci 63:1–23
24. Nakamura M (2012) Appearance of wood and wooden interior. Mokuzai Gakakishi 58:1–10 (in Japanese)
26. Høbiø O, Nyrud AQ (2010) Consumer perception of wood surfaces: the relationship between stated preference and visual homogeneity. J Wood Sci 56:276–283
27. Ohmae E, Ouchi Y, Oda M, Suzuki T, Nobesawa S, Kanno T, Yoshikawa E, Futatsubashi M, Ueda Y, Okada H, Yamashita Y (2006) Cerebral hemody-namics evaluation by near-infrared time-resolved spectroscopy: correla-tion with simultaneous positron emission tomography measurements. Neuroimage 29:697–705
28. Ohmae E, Oda M, Suzuki T, Yamashita Y, Kakihana Y, Matsunaga A, Kan-mura Y, TaKan-mura M (2007) Clinical evaluation of time-resolved spectros-copy by measuring cerebral hemodynamics during cardiopulmonary bypass surgery. J Biomed Opt 12:062112
29. Fox PT, Raichle ME (1986) Focal physiological uncoupling of cerebral blood flow and oxidative metabolism during somatosensory stimulation in human subjects. Proc Natl Acad Sci USA 83:1140–1144
30. Hoshi Y, Kobayashi N, Tamura M (2001) Interpretation of near-infrared spectroscopy signals: a study with a newly developed perfused rat brain model. J Appl Physiol 90:1657–1662
31. Ferrari M, Quaresima V (2012) A brief review on the history of human functional near-infrared spectroscopy (fNIRS) development and fields of application. NeuroImage 63:921–935
32. Cui X, Bray S, Bryant DM, Glover GH, Reiss AL (2011) A quantitative com-parison of NIRS and fMRI across multiple cognitive tasks. NueroImage 54:2808–2821
33. Igarashi M, Yamamoto T, Lee J, Song C, Ikei H, Miyazaki Y (2014) Effects of stimulation by three-dimensional natural images on prefrontal cortex and autonomic nerve activity: a comparison with stimulation using two-dimensional images. Cogn Process 15:551–556
34. Ochiai H, Song C, Ikei H, Miyazaki Y (2017) Effects of visual stimulation with bonsai trees on adult male patients with spinal cord injury. Int J Environ Res Public Health 14:1017
35. Song C, Ikei H, Miyzakai Y (2018) Physiological effects of visual stimulation with forest imagery. Int J Environ Res Public Health 15:213
36. Ikei H, Song C, Miyazaki Y (2017) Physiological effects of touching wood. Int J Environ Res Public Health 14:801
37. Ikei H, Song C, Miyazaki Y (2018) Physiological effects of touching hinoki cypress (Chamaecyparis obtusa). J Wood Sci 64:226–236
38. Ikei H, Song C, Miyazaki Y (2018) Physiological effects of touching the wood of hinoki cypress (Chamaecyparis obtusa) with the soles of the feet. Int J Environ Res Public Health 15:2135
39. Jo H, Song C, Ikei H, Enomoto S, Kobayashi H, Miyazaki Y (2019) Physi-ological and psychPhysi-ological effects of forest and urban sounds using high-resolution sound sources. Int J Environ Res Public Health 16:2649 40. Igarashi M, Ikei H, Song C, Miyazaki Y (2014) Effects of olfactory
stimula-tion with rose and orange oil on prefrontal cortex activity. Complement Ther Med 22:1027–1031
41. Task Force of the European Society of Cardiology and the North Ameri-can Society of Pacing and Electrophysiology (1996) Heart rate variability: standards of measurement, physiological interpretation and clinical use. Circulation 93:1043–1065
42. Kobayashi H, Ishibashi K, Noguchi H (1999) Heart rate variability; an index for monitoring and analyzing human autonomic activities. Appl Hum Sci 18:53–59
43. Kobayashi H, Park BJ, Miyazaki Y (2012) Normative references of heart rate variability and salivary alpha-amylase in a healthy young male popula-tion. J Physiol Anthropol 31:9
44. Osgood CE, Suci GJ, Tannenbaum PH (1957) The measurement of mean-ing. University of Illinois Press, Urbana
45. Lin S, Hsiao YY, Wang M (2014) Test review: the profile of mood states 2nd edition. J Psychoeduc Assess 32:273–277
46. Yokoyama K, Watanabe K (2015) Japanese translation of POMS 2: profile of mood states, 2nd edn. Kaneko Shobo, Tokyo (in Japanese)
47. Heuchert JP, McNair DM (2012) POMS 2: profile of mood states, 2nd edn. Multi-Health Systems Inc, New York
48. McNair DM, Lorr M (1964) An analysis of mood in neurotics. J Abnorm Psychol 69:620–627
49. Hoshi Y, Huang J, Kohri S, Iguchi Y, Naya M, Okamoto T, Ono S (2009) Recognition of human emotions from cerebral blood flow changes in the frontal region: a study with event-related near-infrared spectroscopy. J Neuroimaging 21:94–101
50. Park BJ, Tsunetsugu Y, Kasetani T, Hirano H, Kagawa T, Sato M, Miyazaki Y (2007) Physiological effects of Shinrin-yoku (taking in the atmosphere of the forest)—using salivary cortisol and cerebral activity as indicators. J Physiol Anthropol 26:123–128
51. Ikei H, Song C, Miyazaki Y (2015) Physiological effect of olfactory stimula-tion by hinoki cypress (Chamaecyparis obtusa) leaf oil. J Physiol Anthropol 34:44
52. Song C, Igarashi M, Ikei H, Miyazaki Y (2017) Physiological effects of view-ing fresh red roses. Complement Ther Med 22:1027–1031
53. Igarashi M, Song C, Ikei H, Miyazaki Y (2014) Effects of olfactory stimula-tion with perilla essential oil on prefrontal cortex activity. J Altern Com-plement Med 20:545–549
54. Ikei H, Song C, Miyazaki Y (2015) Comparison of the effects of olfactory stimulation by air-dried and high temperature-dried wood chips of hinoki cypress (Chamaecyparis obtusa) on prefrontal cortex activity. J Wood Sci 61:537–540
55. Ikei H, Song C, Miyazaki Y (2017) Physiological effects of touching coated wood. Int J Environ Res Public Health 14:773
56. Ikei H, Komatsu M, Song C, Himoro E, Miyazaki Y (2014) The physiological and psychological relaxing effects of viewing rose flowers in office work-ers. J Phyisiol Anthropol 33:6
57. Igarashi M, Aga M, Ikei H, Namekawa T, Miyazaki Y (2015) Physiological and psychological effects on high school students of viewing real and artificial pansies. Int J Environ Res Public Health 12:2521–2531 58. Song C, Ikei H, Nara M, Takayama D, Miyazaki Y (2018) Physiological
effects of viewing bonsai in elderly patients undergoing rehabilitation. Int J Environ Res Public Health 15:2635
Publisher’s Note