https://doi.org/10.1007/s10086-018-1697-9
ORIGINAL ARTICLE
Study on the changes in surface characteristics of
Populus tomentosa
due to thermo-hydro-process
Minzhen Bao1,2 · Xianai Huang3 · Mingliang Jiang1 · Neng Li1 · Yanglun Yu1 · Wenji Yu1
Received: 1 November 2017 / Accepted: 9 January 2018 / Published online: 7 February 2018 © The Japan Wood Research Society 2018
Abstract
The effects of high temperature, moisture, and mechanical action during the thermo-hydro-mechanical (THM) processing, on the changes in surface properties of poplar, namely, surface color, roughness, wettability, and microstructure, were inves-tigated in this study. The correlation between observed changes in surface properties and chemical characteristics was also analyzed. Poplar woods with high moisture content were compressed using different pressures at temperature of 160 °C for four different periods. The wood surfaces became darker and smoother, and their surface free energy decreased significantly after the THM process. THM process markedly reduced surface hygroscopicity compared to the control wood. The cell lumens of THM wood became narrow with increasing compression ratio due to the enhancing high pressure. Collapse and fractures of cell walls developed during THM treatment. Furthermore, results indicated that a series of chemical reactions in different components of wood took place during THM process, such as degradation of hemicelluloses, condensation of lignin, and decomposition of extractives. In turn, these chemical modifications contributed to the darkening of color as well as the reduction of wettability and surface free energy of THM wood.
Keywords Wood color · Roughness · Wettability · Thermo-hydro-mechanical process · Chemical characteristic
Introduction
Wood is a natural renewable and environmentally friendly material resource. It plays an important role in a long-term strategy for sustainable development of engineering mate-rial and reduces the impact of human on the environment as its utilization in construction. As the sources of naturally grown wood are being consumed, fast-growing plantations
are bound to be served as alternative raw materials, espe-cially in the forest-limited countries or regions, e.g., the P.R. of China. Currently, the existing plantation forest in China of nearly 69 million ha area produces approximate 2.48 billion m3 of growing stock. The plantation forest is equivalent to nearly 17% of the total forest for the whole country [1]. As one of the most important fast-growing tree species in China, the poplar wood becomes the overwhelm-ing raw material to manufacture wood-based composite pan-els such as high-density particle board, high-density fiber board, compressed wood, and wood scrimber. However, the quality of plantation wood is not as good as that of naturally grown wood. Due to the fast-growing, plantation wood has lower density, poorer mechanical properties and larger sur-face roughness compared to natural wood [2]. The properties of man-planted wood have to be improved before replacing the naturally grown wood as engineering material. Neverthe-less, wood is a hygroscopic complex material composed of hemicellulose, cellulose, and lignin, which is easily affected by the heat, moisture, and pressure in the process of wood-based composite panels.
The thermo-hydro-mechanical (THM) treatment of wood is a combination of temperature, moisture, and mechanical
* Yanglun Yu [email protected] * Wenji Yu
1 Key Laboratory of Wood Science and Technology of State
Forestry Administration, Research Institute of Wood Industry, Chinese Academy of Forestry, Xiang Shan Road, Hai Dian District, Beijing 10091, People’s Republic of China
2 China National Bamboo Research Center, Key Laboratory
of High Efficient Processing of Bamboo of Zhejiang Province, Wen Yi Road 310, Hangzhou 310012, People’s Republic of China
3 CanmetENERGY-Ottawa, Natural Resource Canada, 1
action. Our previous study reported that this is an efficient way to improve the intrinsic properties of wood [3]. Due to the THM process, the obtained composite materials have a higher density, reduced equilibrium moisture content, and mechanical property [3]. However, moisture absorption of THM-treated wood in humid condition is often a problem and causes dimensional instability [4]. Furthermore, THM pro-cess of solid wood is usually a long and energy consumption process. Poplar wood with poorer physical properties is a suit-able raw material to be used to obtain new high performance wood-based composite products by the THM process. Wood has a porous surface due to the cell wall structure; therefore, its surface morphology varies significantly at a nanometric and micrometric scale during THM treatment depending strongly upon the degree of densification [5].
In addition to the enhancement of physical and mechanical properties of wood, the surface properties of THM wood can also be altered under the simultaneous effects of heat, mois-ture, and pressure [6]. Heat treatment with the temperature above 160 °C decreases the hygroscopic character of the wood surface due to the degradation of hygroscopic compounds such as hemicelluloses [7]. The degradation of hemicellulose helps limit water absorption in the wood, which can reduce the sur-face wettability and the sursur-face energy [8, 9]. Due to the ther-mal treatment, the wood undergoes color change from light to brown [4, 10]. The continuous exposure to heat and pressure also affects wood roughness [11], hardness [12] and surface chemistry [10, 13].
However, the surface properties of THM wood—high tem-peratures as well as elevated pressure for a long time—are less studied. The physical and chemical changes generated by THM process, such as the hydrophobicity on the treated wood surface, may affect the microstructure, color, and wettability of wood composite materials. Therefore, the surface cell mor-phology of THM wood in relation with the four degrees of compression ratio (CR) was also characterized accordingly. To achieve the aims of surface characterization of the THM wood, surface roughometer, scanning electron microscope (SEM), Fourier transform infrared spectroscopy (FTIR), and X-ray photo-electron spectroscopy (XPS) were employed in this study. Color determination, time-dependent contact angle measurements, and surface free energy calculation were also carried out. These analyses provide insights into the changes in surface characteristics of THM poplar wood and the tech-nical support for the subsequent processing of wood-based composite materials.
Materials and methods
Materials
The 15-year-old fast-grown poplar (Populus tomentosa) with the diameter at the breast height of 220 mm was obtained from a plantation located in the province of Shandong, China. The air-dried density of the wood was determined as 0.39 g/cm3. The samples from the same growth increment in the tree stem were prepared with the nominal sizes of 250 × 100 × 30 mm (longitudinal × tangential × radial). The compression test was performed in radial direction. The radial compression was carried on the flat grain samples with the compression direction perpendicular to the annual ring. Poplar wood used in this study is a fast-growing wood which results in higher growth stresses. Thermal treatment was reported as one of the possible countermeasures to reduce growth stresses in wood [14]. Hence, the specimens were first oven-dried in the purpose of releasing the growth stress in certain extent, which consequently minimize the effects of specimens’ variation on the test results and then were vacuum treated, so that all the specimens were fully water-saturated with a similar moisture content. Finally, all samples were oven-dried to reach the final moisture con-tent of 25 ± 1% based on the oven-dried weight before THM process.
THM process
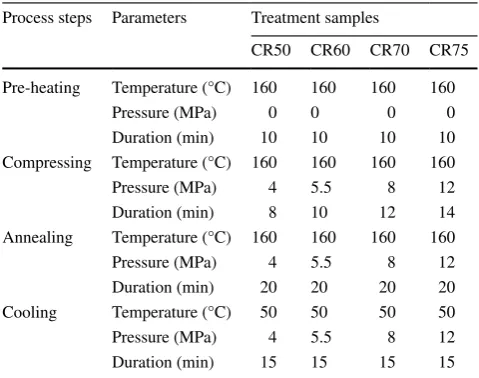
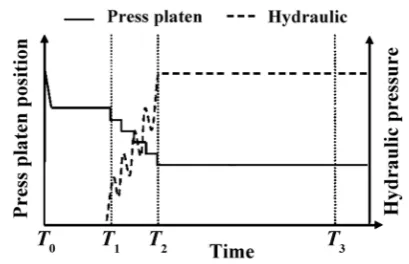
In the present study, the THM process consisted of three main phases. The processing parameters are shown in Table 1 and the procedures are illustrated in Fig. 1. The initial moisture content of sample was controlled as 25 ± 1%.
Table 1 Operational parameters during THM process
THM thermo-hydro-mechanical, CR compression ratio Process steps Parameters Treatment samples
CR50 CR60 CR70 CR75 Pre-heating Temperature (°C) 160 160 160 160
Though it was difficult to control and determine the moisture content during the THM process, the final moisture content of the samples after THM process was measured to be 8%. The modification of moisture indicates its role in the THM process. First, the wet specimens were pre-heated with tem-perature of metal plate surface at 160 °C for 10 min with the purpose of softening the specimens. Pre-heating of samples was performed in an open-system THM machine with direct contact with the two heated metal plates. Then, specimens were compressed from the initial thickness (30 mm) to four target thicknesses (15, 12, 9, and 7.5 mm) with a special mold to maintain the dimensions, providing four different CRs. CR50, CR60, CR70, and CR75 in Table 1 mean that the compression ratio is 50, 60, 70, and 75%, respectively. The mechanical pressures varied from 4 to 12 MPa depend-ing on the degree of CR were applied perpendicular to the grain. Next, the samples were annealed at constant tempera-ture of 160 °C for 20 min and finally cooled down to 50 °C with the set pressures based on our previous experiments [3]. The final specimen thickness was maintained through-out the compression, annealing, and cooling steps [3]. Six replicates were carried out for each group. For the purpose of comparison, the control untreated poplar samples were prepared as well. Before property testing, all THM process specimens were stored in a conditioning chamber at 20 °C and a relative humidity (RH) of 65% until they reached con-stant mass weights.
Determination of color
The surface color of specimens after the THM process was measured using a portable chromatic aberration meter (CR400, Minolt, Japan). The colorimeter consists of a meas-uring head of 8 mm diameter and its artificial daylight 6500 K (D65) light source. Color is expressed according to three parameters, lightness L*, a*, and b* co-ordinates that repre-sent the color pairs red/green and yellow/blue, respectively.
With L*, a*, and b*, the total color change (∆E*) of speci-mens can be calculated with Eq. (1):
where ∆L*, ∆a*, and ∆b* represent the changes in L*, a*, and b* due to THM process, respectively. The reported val-ues are average valval-ues of 12 replicate measurements per-formed on 4 separate specimens.
Measurement of surface roughness
The surface roughness of THM wood samples was recorded by a surface roughometer (TIME 3230, Time, Beijing) with a display resolution of 0.01 µm. Specimens of 40 × 40 mm squares were cut and then sanded with 240-grit sand paper for 30 s. A Gaussian filter with a cut-off wavelength of 0.8 mm was used to transform the data. Several roughness parameters were used as the indicators of surface roughness: Ra (mean roughness), Rt (maximum height of the profile), and Rz (mean peak-to-valley height). Four specimens were sampled randomly from different samples for each group and three measurements of surface roughness were taken per specimen. The surface roughness of untreated wood sample was measured as a reference.
Measurement of surface wettability
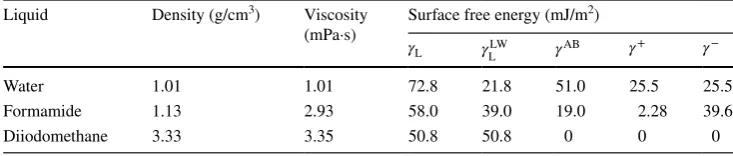
Specimens of 40 mm × 40 mm were cut from the untreated and THM wood, and then, their surfaces were sanded with 240-grit sand paper for 30 s. All the samples were condi-tioned at RH 65% and 20 °C to constant mass before meas-urements. The sessile drop method was used to estimate the apparent contact angle of water, formamide, and dii-odomethane. The wetting behavior on the surfaces of the specimens was measured by a Dataphysics OCA20 contact angle analyzer (DataPhysics Instruments GmbH, Filderstadt, Germany). Four sites were performed on each specimen, and three specimens were selected randomly for each group. An automatic micro-syringe was used to dispense drops of approximately 5 µL test liquid. The contact angles of droplet on each sample were measured at intervals of 1 s for 20 s after the liquid droplet fell on the sample surface.
Calculation of surface free energy
Direct measurement of surface free energy of solids is not feasible [15], which necessitates the indirect evaluation. The Lifshitze–van der Waals/acid–base (LW–AB) approach was applied in this study to calculate the surface free energy [16]. According to this approach, the surface free energy (γT) is a sum of Lifshitze–van der Waals component (γLW) and the acid–base (γAB) component. The (γAB) component can be (1) ΔE∗ =
√
(ΔL∗)2
+ (Δa∗)2
+ (Δb∗)2
expressed in terms of electron-accepting (γ+) and electron-donating components (γ−) as follows:
The mathematical approach for the solid/liquid interfacial tension is given by
where θ is the initial contact angle, and the subscripts S and L denote solid and liquid phases, respectively.
If the contact angles of at least three test liquids (with known surface free energy components, see Table 2) are measured on the same solid surface, the surface free energy components of the solid surface can be calculated using Eq. (3). As a reference, the surface free energy components of untreated wood samples were also summarized.
Scanning electron microscopy (SEM)
SEM analysis was used to investigate the microscopic struc-tural changes occurring on THM wood surface. Small wood blocks measuring 6.0 × 5.0 mm on the transverse section were cut from untreated and THM wood samples. The speci-mens were randomly selected from the specispeci-mens tested in surface wettability for each group. Sections of 20–60 µm were sliced off from the cross section of each block using a sliding microtome with a sharp knife until a smooth, clear surface was obtained. Then, all block surfaces were sputter-coated with a gold layer for electrical conductivity. Finally, the samples were scanned in a SEM (S4800, Hitach, Japan) with magnification of up to 800,000× at 10 kV of accelerat-ing voltage. Several images at 5000× were obtained from each group of the specimens.
FTIR analysis
The effect of THM process on the chemical compositions of hemicellulose, cellulose, and lignin on the wood surface was studied using FTIR spectroscopy. The powder wood specimens were collected from the surface of all samples at the same depth from the surface (about 0.5 mm). For each specimen, the infrared spectra were obtained from a KBr (Potassium bromide) disk containing 1% finely ground samples on a spectrometer (Vertex 70, Bruker, Germany). (2) 𝛾AB=2
√
𝛾+𝛾−.
(3)
𝛾L(1+cos𝜃) =2(
√
𝛾sLW𝛾LLW+ √
𝛾s+𝛾L−+ √
𝛾s−𝛾L+)
The spectra were recorded in absorbance units from 4000 to 550 cm−1 at a spectral resolution of 4 cm−1 and 16 scans.
XPS spectroscopy analysis
The wood powder was scraped from the slice of less than 2 mm on the surfaces of all untreated and THM wood. The XPS measurements were performed on an Axis Ultra XPS spectrometer (Kratos Analytical) with monochromated Al Kα (hν = 1486.6 eV) source. All samples were analyzed in vacuum ranging from 1.33 × 10⁻⁶ to 1.33 × 10⁻⁵ Pa. Three types of spectrum were collected: a survey spectrum, a low-resolution spectrum from 0 to 1100 eV, and a high-low-resolution spectrum of the C–C or C–H group (C1s) region from 280 to 300 eV. The ratio of oxygen to carbon element (O/C) was determined from the low-resolution spectra. The peak analy-sis was carried out by means of peak decomposition to fit a Gaussian function. Chemical bond analysis of the carbon was accomplished by curve fitting and the high-resolution C1s peak was deconvoluted into four sub peaks.
Statistical analysis
One-way analysis of variance (ANOVA) was conducted to study the effect of THM process on the color change and roughness of the poplar wood at the 0.05 significance level (p < 0.05). Duncan’s multiple range test was employed to multiply compare the properties of samples. All the statis-tical analyses were performed using the software of IBM SPSS Statistics 22.
Results and discussion
Color changes
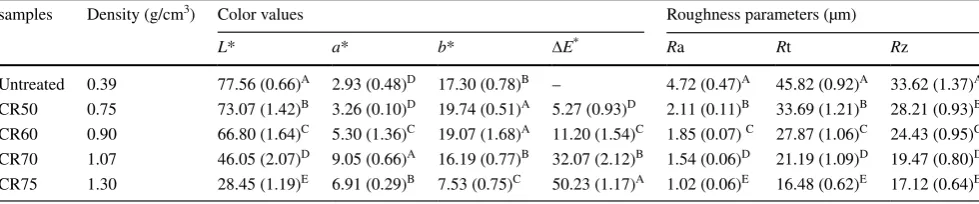
Visual appearance in Fig. 2 depicted the color changes of the surface samples due to THM treatment with differ-ent parameters. It can be observed from the picture that the color of the samples became darker with increasing CR. The color parameters of all the samples are listed in Table 3. It can be found that the color value of the wood samples significantly depends on the THM process. Light-ness (L* value) is a sensitive and visualized parameter for the wood surface [10]. When CR was below 60%, L* value
Table 2 Physical properties and surface free energy components of test liquids
Liquid Density (g/cm3) Viscosity
(mPa·s) Surface free energy (mJ/m
2)
𝛾L 𝛾LLW 𝛾
AB
𝛾+ 𝛾−
did not change significantly. However, it decreased signifi-cantly when samples were compressed more than 60%. A decrease in the L* values was associated with darker color. The higher the pressure and/or the longer the treatment time, the darker is the color, which can be achieved by THM process. Diouf [10] found that veneer surface color darkened (decrease in L*) with increasing THM treat-ment temperature. The color co-ordinates a* and b* were always positive in the case of wood. The decreases of a* and b* mean that the wood became achromatic. The a* value of THM wood increased significantly with CR while decreased significantly for CR75. The b* value change showed opposite trend to that of a* value change for wood surfaces due to THM process. The longer heating time and higher pressure generate a dynamic color change to a darker tonality in this study. The heat treatment had similar wood color change trend with the THM process when the heating time increases. The difference between these two processes is the additional pressure for THM process. This indicates just slighter effect of pressure on color modi-fication compared with that of heating time. The initial and final moistures were similar for all the samples in this study, while their colors were significantly different, as shown in Fig. 2. This implied that the moisture did not play an important role in the change of wood color during THM process. In general, the heating time was the main factor to determine the wood color.
The total color difference (∆E*) reflected the severity of THM process. As shown in Table 3, ∆E* showed increas-ing tendency with increasincreas-ing CR and there was an apparent difference between CR60 and CR70. The heat treatment of lignin in acidic conditions formed new phenolic hydroxyl groups, which increased the amount of phenolic hydroxyl groups. The increasing of phenolic hydroxyl groups deep-ened the color of the wood during heat treatment. The pre-vious studies have reported that a darkening of the wood surface was contributed to thermo-mechanical treatment with different treatment temperatures and pressures [10,
17]. FTIR and XPS analysis indicated increasing of lignin and degradation of hemicelluloses after THM process. The darkening of wood color can be contributed to the richening of lignin, which response to the decreasing in L*.
Surface roughness
Surface roughness is an important property in terms of sur-face quality, particularly in finishing and gluing processes [18]. Roughness at scale larger than nanoscale will improve the wettability and penetration by adhesive, which can reduce material loss in finishing machines [19]. The typi-cal roughness profiles of untreated and THM wood samples are presented in Fig. 3. It can be observed that in general, THM treatment with higher pressure yielded in smoother sample surface. Figure 3 also suggests that THM treatment
Fig. 2 Visual appearance on the surface of untreated and THM wood
Table 3 Average values of surface characteristics of color values and roughness parameters on poplar surface before (untreated) and after THM
treatment
Values in parenthesis are standard deviations. For each parameter, average values with different letters in the same column indicate a significant difference at p < 0.05 [analysis of variance (ANOVA), followed by Duncan’s multiple range test]
THM thermo-hydro-mechanical, CR compression ratio, Ra mean roughness, Rt maximum height of the profile, Rz mean peak-to-valley height samples Density (g/cm3) Color values Roughness parameters (µm)
L* a* b* ∆E* Ra Rt Rz
Untreated 0.39 77.56 (0.66)A 2.93 (0.48)D 17.30 (0.78)B – 4.72 (0.47)A 45.82 (0.92)A 33.62 (1.37)A
CR50 0.75 73.07 (1.42)B 3.26 (0.10)D 19.74 (0.51)A 5.27 (0.93)D 2.11 (0.11)B 33.69 (1.21)B 28.21 (0.93)B
CR60 0.90 66.80 (1.64)C 5.30 (1.36)C 19.07 (1.68)A 11.20 (1.54)C 1.85 (0.07) C 27.87 (1.06)C 24.43 (0.95)C
CR70 1.07 46.05 (2.07)D 9.05 (0.66)A 16.19 (0.77)B 32.07 (2.12)B 1.54 (0.06)D 21.19 (1.09)D 19.47 (0.80)D
improved the roughness parameters of the samples surface, which are shown in Table 3. Table 3 shows that THM pro-cess causes a considerable decrease in all roughness param-eters with increasing CR, in comparison with untreated wood. The THM wood with CR75 had the smoothest surface with an Ra value of 1.02 µm, while the roughest surface was found for the untreated wood surface having an Ra value of 4.72 µm.
The previous studies [10, 11] reported that the THM process leaded to a smoother sample surface. The pressure applied during the THM process would define the values of the surface roughness. Denser materials reduce the pore amount and exited pore size. Higher surface smoothness indicates lower porosity of open pore exposed to moisture in the air outside [10]. Furthermore, it was assumed that
the THM conditions have varied effects on the anatomical changes on the wood surface [20]. Thus, the heating during THM treatment softens the wood material and the pressure compresses the surface, which mitigates the roughness of final product. Hence, to achieve the desired surface rough-ness, it is necessary to expose wood to the combination of heat and stress.
Surface wettability
The contact angle between THM wood and liquid, as an index of wettability, can be used to determine the adhesion and coating properties of THM-treated materials. To investi-gate the changes in the wettability during THM process, the polar liquids (distilled water and formamide) and non-polar
Fig. 3 Typical surface roughness profiles on the surface of untreated and THM wood samples: a untreated, b CR50, c CR60, d CR70, and e
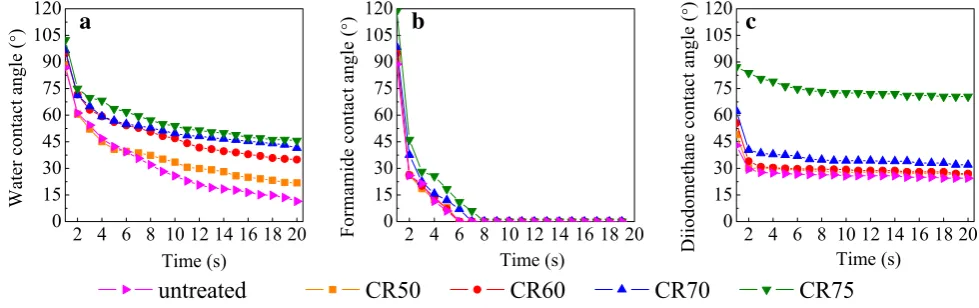
liquid (diiodomethane) were used to determine their contact angles. The dynamic contact angles of the untreated wood and THM wood with different CR are presented in Fig. 4.
As could be seen in the three figures in Fig. 4, regardless test liquid types, the decreasing rate of contact angle with the time on the surface of the untreated wood was faster than all those of THM wood. The higher was the CR, and the con-tact angles were greater for all three liquids at the same time. The different wetting behaviors shown in Fig. 4 reflected the significant impact of THM process on the surface wettability by both polar and non-polar liquids.
As apparent in Fig. 4a, the contact angle of all samples decreased gradually over time. The decreasing rate in the contact angle of THM wood was relatively slower than that of untreated wood as time elapsed. The contact angle at 20 s for CR75 was 109% higher than that for CR50. Figure 4b shows that the contact angle dropped substantially to zero within 8 s, indicating that the formamide was absorbed completely and quickly by both untreated and THM wood. There was no significant difference in the contact angles of untreated and THM specimens at the same time. How-ever, there was a large difference in the contact angles of diiodomethane on the untreated wood and the THM wood, as could be seen from Fig. 4c. All the samples showed the decrease in the contact angles within 2 s for diiodomethane. After that, the contact angles changed slightly and trended to reach equilibrium with the time increasing. The greatest difference in the contact angle was observed on the surface of THM wood with CR75 comparing to that of untreated wood. The equilibrium contact angle of THM wood with CR75 was about 70.50°, which was over 44° larger than that of CR50 THM wood at 20 s. It can be concluded that the higher the CR value, the larger equilibrium contact angle on wood surfaces. The higher contact angles of liquids on wood mean the lower wettability.
The surface wettability trend can indicate the changes in hygroscopicity of the THM wood. The significant decrease
of wettability implied markedly reduced hygroscopicity. With the CR of THM wood enhanced, the wood hygrosco-picity became lower. The long heating time and high pres-sure during THM processing lead to the partial degradation of hemicelluloses and amorphous cellulose [21, 22]. Moreo-ver, it also occurred the reorganization of the lignocellu-losic polymeric components of wood during THM process-ing [21]. Therefore, the main sources of the hydrophobic character of the THM wood were reduced. In addition, the wettability of liquid on the wood surface can also be related to morphology and roughness of the solid surface [13]. As stated above, the reduction of roughness due to THM pro-cess prevented the entrance and absorption of moisture into wood substrate. It would be explained in the following sec-tion that the narrow lumen volume of vessels and fibers on the wood surface will also act the similar role in moisture reduction. Therefore, these results obtained here suggested that the chemical modification and physical changes during THM process played significant important roles in wettabil-ity change.
Surface free energy
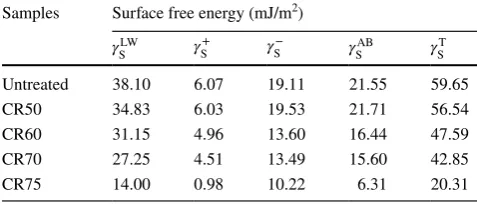
The surface energy is a critical property for evaluating the wetting and the coating on the THM wood surface. There-fore, it is necessary to investigate the variation of the surface free energy of the THM wood. The total surface free energy ( 𝛾ST ) and its components are calculated for the untreated and
THM wood specimens and are shown in Table 4.
𝛾SLW and 𝛾S were higher in the case of the untreated wood T
than those of the THM wood. With the increasing of the CR, all the surface energy components decreased. This indicated that the THM process had a significant influence on the sur-face energy. 𝛾SLW exhibited a predominant contribution to 𝛾ST ,
which is one of the characteristics of typical polymers [23]. The high 𝛾SLW can be explained by the high interaction abil-ity of the dispersive part of available C–O and C–C bonds
a
b
c
within the wood. Nevertheless, the values of 𝛾SAB were rela-tively small in comparison with the contribution of 𝛾SLW . This
did not mean that 𝛾SAB is less important. On the contrary, it
referred to the interaction between hydroxyl groups of wood and functional groups of adhesive by forming the hydrogen bond. The reducing of 𝛾SAB after THM treatment indicated less possibility of interaction the hydroxyl groups of wood with other functional groups, which may bring adverse effects during waterborne gluing and coating processing.
Table 4 also shows the acid ( 𝛾S+ ) and base ( 𝛾S− ) parameters
of untreated and THM wood. It is evident from the data that the value of 𝛾+
S decreased from 6.07 to 0.98, and the value of 𝛾S− decreased from 19.11 to 10.22 after THM treatment. The acid–base properties are related to the different functional groups on the wood surface. The acid functionality is found in hydroxyl and/or acetyl groups, while the basicity comes from the carbonyl group [24]. 𝛾S− of wood surfaces is
dis-tinctly higher than 𝛾S+ , implying that the wood is monopolar basic. Contact angles and surface free energies measured on THM wood indicated that hydrophobic character was cor-related with low values of 𝛾S−.
Considering the surface free energy data of the untreated wood and THM wood, it could be concluded that the THM process lowered the surface energy and all the energy com-ponents of wood. The surface energy data can be explained by the complex nature of the wood surface, which is the combination of porous structure, surface roughness, and chemical heterogeneity of wood [25]. The simultaneous effects of heat, moisture, and compression during the THM process generate the chemical degradation of the most hygroscopic compounds and the decrease of surface rough-ness of the THM wood, which contribute to decrease the surface energy.
Surface microstructure
The cellular structure of wood undergoes significant changes during THM process. It is believed that roughness and wettability of wood surface will be highly influenced by
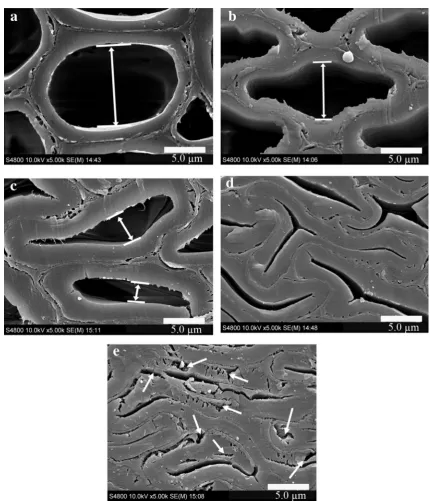
microscopic structural changes resulting from the combina-tion of moisture, temperature, and stress [10, 26]. Figure 5
shows the surface micrographs on the transverse surfaces of untreated and THM woods. It was clear that THM process reduced cell lumen volume, which could be easily observed from Fig. 5. Comparing Fig. 5a–e, THM wood with higher CR caused a larger deformation to the pores. The lumen in the fiber cells, especially the corner cell lumen, has been already compacted on the wood with CR70 [10, 17, 26].
The cells collapsing and flattening occurred during THM process mostly by elastic buckling and plastic yielding in the cell walls without fractures for the sample THM treated less than CR70. However, the development of cracks on the cell wall of the THM specimen is observed when the CR increases up to 75% (see arrows in Fig. 5e). The existence of cracks in cell wall showed that the wood seemed to have been converted into brittle under the heating and stress, which led to a marked destruction of cell structure caused by stress of THM treatment. In this study, the integrity of cell wall was broken by the cracks and fractures, which may influence the liquid penetration. This requires further study. The presence of pores was the feature that was beneficial to be penetrated by liquid. Therefore, structural differences in wood substrates can exert an influence on the moisture or other liquid entrance into wood specimens after THM process. Moreover, the reduction of cell lumen volume exhibited on the wood surface has a benefit effect on the smoothening of treated wood surface.
FTIR analysis
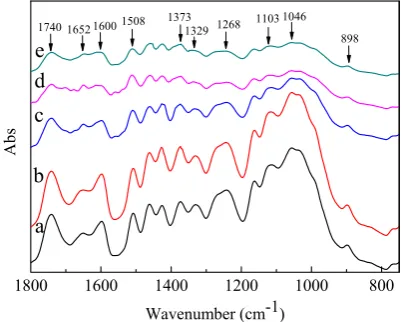
As mentioned above, chemical changes in the THM wood surfaces were responsible for color and wettability behavior. In this study, the differences of chemical groups of wood cell wall substance due to THM process can be clearly seen in the band shapes of the infrared spectra. The C–H ali-phatic stretching, with a peak value at 2900 cm−1, is more stable than C–OH, C–O–C, and R–COO–R bonds and can be expected to stay virtually unchanged during heat treat-ment [24, 27]. Therefore, the FTIR fingerprint region of 1800–750 cm−1, which contains many well-defined peaks that provide abundant information on various functional groups present in wood constituents, is summarized in Table 5. Figure 6 shows the FTIR spectra between the fin-ger print region of 1800 and 750 cm−1 on the untreated and THM wood samples.
As can be seen from Table 5 and Fig. 6, the FTIR spectra of THM samples at different CR in the studied region pre-sented uniquely different features. It was clearly apparent that heating time and high pressure in THM process had a significant effect on the functional groups.
Upon analysis of the spectra, the intensity of the peak at 1740 cm−1 is diminished significantly by THM process,
Table 4 Surface tension components of untreated and THM wood from acid–base model
THM thermo-hydro-mechanical, CR compression ratio Samples Surface free energy (mJ/m2)
𝛾SLW 𝛾 + S 𝛾 − S 𝛾 AB S 𝛾 T S
suggesting cleavage of ester groups associated with decom-position of polysaccharides of hemicelluloses [28]. The intensity of the carbonyl peak (1740 cm−1) of THM wood with CR50 was not altered obviously compared with that of untreated wood. However, considerable diminishment of this peak in THM wood with higher CR value was observed, and the reduction was depending on the CR. The cell wall is hydroscopic and the order of hydroscopicity for the cell wall component is: hemicelluloses, cellulose, and then lignin.
The degradation of hemicelluloses by THM treatment can increase the relative content of other components in treated wood and consequently make the surface more hydrophobic. This can be further confirmed by the lower relative intensity of band at 1652 cm−1 on THM sample surface which may refer to adsorbed water. The similar observation in wettabil-ity is reported by Diouf and Stevanovic [10]. They reported that contact angle on the surface of the trembling aspen and hybrid poplar increased after THM process.
The peaks at 1373, 1329, and 898 cm−1 were mainly due to carbohydrates, such as cellulose and hemicelluloses, but had no significant contribution from lignin. The intensities of these peaks were affected significantly by THM treatment. Reduction of the peak at 1373 cm−1 is due to the formation of an ether linkage from hydroxyl groups within hemicellu-loses and celluhemicellu-loses [29]. Another change observed was the slight reduction at 1329 cm−1 for specimens according to the THM process. The previous results for the heat treatment of wood reported in the literature [21] show the appearance of a doublet at 1315 and 1335 cm−1, characteristic of celluloses with a high-crystallized cellulose I content. The peak posited at 1329 cm−1 is in the range of those at 1315 and 1335 cm−1; it is reasonable to assumed that the both bands represent the high-crystallized cellulose. Therefore, it can be implied that crystallinity of the cellulose was affected due to heating or/and high pressure by the indication of reduction in the band at 1329 cm−1. Moreover, the dropping of C–H peak at
898 cm−1 under THM process with the increasing CR was mainly due to the degradation of hemicellulose. The absorp-tion of water by wood depends on the hydrophilic nature of each cell wall component and the accessibility of water to the hydroxyl groups of polymers. Most of the hydroxyl sites in the hemicelluloses and lignin are accessible to moisture. Moreover, it is accessible for moisture with the amorphous cellulose (non-crystalline portion of cellulose) and the sur-faces of the crystallites, but not with the crystalline section of cellulose. The increase of crystallinity proportion due to degradation of hemicelluloses and amorphous cellulose dur-ing THM treatment reduced the water wettability on THM wood.
As shown in Table 5, all the bands at 1600, 1508, 1268, 1103, and 1046 cm−1 represented lignin characteristics. Figure 6 shows that all these characteristic bands of lignin decreased at different extents because of THM processing. The peaks at 1600 and 1508 cm−1 were mainly characteristic absorption of C=C in an aromatic ring that originated from lignin in wood. It can be observed that these peaks decreased slightly after THM treatment because of the splitting of the aliphatic side chains in lignin and cross-linking formation by condensation reactions of lignin. The relative intensity of the peak at 1268 cm−1 reduced, which may come from guaiacyl units in lignin and hemicelluloses polysaccharides, indicating the condensation of lignin and the cleavage of acetyl groups in hemicelluloses [7]. It was also reported in these previous studies that the wood color changes were related to the combination of changes in lignin and extrac-tives contents.
In general, FTIR spectroscopy results showed that poly-saccharide contents were strongly diminished and depended strongly upon the degree of CR. The reduction of chemi-cal groups in lignin due to the modification indicated the condensation or degradation of lignin by THM treatment. The relative contents of lignin increased compared to other
Table 5 Characteristic bands of the FTIR spectra of wood samples
FTIR fourier transform infrared spectroscopy
Wavenumber (cm−1) Functional group Assignment
1740‒1730 ‒COOH (C=O) Free carbonyl groups, stretching of acetyl or carboxylic acid (hemicelluloses)
1660‒1640 C=O Quinines and quinine methides, adsorbed water 1600 C=C Aromatic ring (lignin)
1510 C=C Aromatic ring (lignin)
1373 C‒H CH deformation (cellulose and hemicellulose) 1335‒1330 O‒H OH in plane bending (cellulose)
1270‒1267 C‒O Guaiacyl ring breathing with CO‒stretching (lignin and hemicelluloses), esters 1103 C‒H Guaiacyl and syringyl (lignin) 1050‒1030 C‒O, C‒H Primary alcohol, guaiacyl (lignin) 898 C‒H CH deformation (cellulose)
Fig. 6 FTIR spectra of untreated and THM wood samples: a
component after heat treatment [7]. The THM process may provide similar results on the changes in wood components, since it includes the effect of high temperature. In addition, the high pressure may contribute to the chemical changes in this study.
The degradation of hemicelluloses and the relative increasing in lignin content explain the decrease in water absorption and the increase in wood hydrophobicity. It was well known that the holocelluloses (hemicellulose and cel-lulose) exhibit white color, while the lignin has dark brown color. Thus, the increase in lignin proportion deepens the
color of the wood surface after THM treatment. This phe-nomenon is attributed to the combined effect of heating and pressure during THM process. It needs further study to understand the individual role of pressure and moisture.
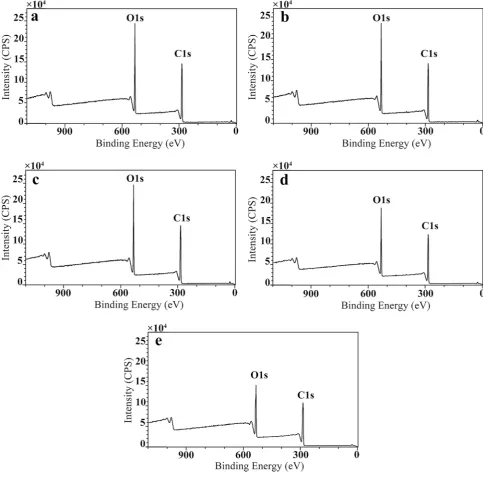
XPS analysis
XPS analysis has been reported as an effective technique to characterize the element change of wood surface in relation with interfacial phenomena [27, 30]. The typical XPS survey spectra of untreated and THM wood samples are shown in
Fig. 7. The XPS spectra revealed that carbon and oxygen were the major elements in all five samples, which occurred at 284 and 532 eV, respectively. It can be seen from the comparison of the survey spectra of samples that the THM process led to a slight increase of the C1s component at the expense of a decrease in O1s (C=O) component. The inten-sity of the C1s and O1s decreased with the increasing CR after THM treatment.
Using the total area of peaks of different components and the respective photoemission cross sections, the distribution of the composition of oxygen and carbon atoms and the O/C ratio for the untreated and THM wood samples were calcu-lated and presented in Table 6.
The O/C ratio is always used in quantitative analysis when XPS is applied to characterize wood surfaces. The O/C ratio was calculated to be 0.41 for the untreated wood, which was intermediate between the theoretical value for lignin 0.33 and cellulose 0.83. A high O/C indicates high cellulose and hemicelluloses contents, while a low O/C ratio reflects higher lignin content on wood surface. The O/C ratio of THM wood surfaces dropped from 0.410 to 0.377 after THM treatment with increasing CR. Accord-ing to the previous studies, the degradation of cellulosic materials and polymers can be detected through a change in the O/C ratio [27, 29]. On one hand, the decrease in O/C ratio is mainly attributed to the preferential degradation of hemicellulose [31, 32]. On the other hand, THM process can bring out the formation of volatile by-products with a lower oxygen content resulting from dehydration of poly-mers and the deposition of volatile organic compounds as well as the migration of original extractives on the wood surface [10]. These chemical changes can affect the cur-ing of adhesives and coatcur-ings by their acidity, reactivity, or hydrophilic/hydrophobic nature. These chemical modifica-tions can also affect the water wettability on the surface. To evaluate the surface chemical structures of THM wood, the high-resolution C1s XPS spectra of the samples are pre-sented in Fig. 8. The C1s XPS spectra of correspond to four types of carbon atoms expressed as C1–C4 according to the
determination of binding energy in the literature [27]. The classification of carbon peak components for wood materials (shown in Table 7) was used in this study [30]. The varia-tion in the peak area contribuvaria-tions for the C1s components is presented in Table 6.
The chemical shifts and binding energies of C1s peaks found in this study are in a very good agreement with the literature values [27] for woody materials, as shown in Table 7. The contribution of C1 and C2 peaks was more important than C3 and C4 peaks, indicating that they have higher concentrations on all the surfaces. After THM pro-cess, the contribution of the C2 component decreased, while that of C1 component increased. The C1 contributions arose from 39.07 to 43.63, which refer to the C–C and C–H bonds from lignin and extractives. This demonstrated that lignin increased and covered on the fiber surface after the THM treatment. Detailed analysis of the C1s region showed that the C2 component contributed the most important to the sample surface. The C1 component is associated with the presence of lignin, and the C2 component mainly originates from cellulose and hemicelluloses. The significant decreas-ing of C2 component indicates the THM process above the temperature of 160 °C degraded hemicelluloses and cel-lulose. By contrast, the relative increase of C1 contribu-tion implied the increase of the relative content of lignin increased after THM process. Similar reason can be used to explain the changes of the O/C ratio. The observation on the variations of C1 and C2 components as well as O/C ratio indicated that hemicelluloses and cellulose were more sensi-tive than lignin to THM process. The THM wood surfaces became richer in lignin and poorer in hemicelluloses and cellulose. The findings of XPS verified the result of above FTIR spectroscopy analysis. C3 contributions showed a trend similar to that of C2. A slight decline during THM process indicated that carbohydrate content decreased after THM process. This proved that again, the THM-treated surface was poor in cellulose and hemicelluloses and comparatively rich in lignin. The C4 peak representing a carbon atom linked to a carbonyl and noncarbonyl oxygen was insignificant in all
Table 6 Chemical surface composition and component ratios of the studied samples determined by XPS analysis
CR compression ratio, XPS X-ray photo-electron spectroscopy, O/C the ratio of oxygen to carbon element,
C1 carbon atoms bonded with other carbon or hydrogen, C2 carbon atoms bonded with one oxygen atom,
C3 carbon atoms bonded with two oxygen atom, C4 carbon atoms bonded with three oxygen atom, C1/C2
the ratio of C1 to C2
Samples Atomic composition C1s components
O% C% O/C C1% C2% C3% C4% C1/C2
five samples (only about 3%). The effect of THM treatment on the C1s spectra of wood surface showed similar with that of the heat treatment [10, 32], which confirmed that the chemical modification during THM process was more due to the factor of heating than pressure and moisture. However, the structural modification during the process was mainly caused by the factor of high pressure.
The C1/C2 ratio was calculated according to the spe-cific percentages of different C1s components, as depicted in Table 6, which reflects the amount of unoxidized car-bon atoms versus the amount of carcar-bon atoms with ester or hydroxyl groups. The higher the C1/C2 ratio, the higher the relative concentration of lignin and extractives on the wood surface. As the CR increased, the C1/C2 value of wood surfaces raised, which was related to the carbonization of hemicelluloses and cellulose and the rearrangement of lignin during the THM process [13]. The increase of C1/C2 ratio had a negative effect on the wettability and minimized the surface free energy of THM wood (see Table 4). In other words, increasing in lignin content can reduce the surface energy of THM wood.
Under the high temperature above 160 °C and the ele-vated pressure for a long time, the chemical reactions of all three wood components took place. The FTIR and XPS analysis showed that the reactions included depolymeriza-tion of hemicelluloses by hydrolysis, the relative concentra-tion of lignin, and the change of extractives. These chemical changes contribute partly to the hydrophobic character on THM wood surfaces.
Conclusion
The results of this study showed that THM process caused changes in wood surface characteristics as determined by physical (color, roughness, wettability, and microstructure) and chemical analysis (FTIR and XPS). Color measurements showed that wood became darker after THM process, which could be advantageous for appearance applications. The THM treatment had enhanced surface quality with lower
surface roughness values. The wettability analysis showed that THM wood surfaces became more hydrophobic. Based on the findings of surface energy, the total surface free energy decreased significantly with the increasing CR. The cell lumen volume reduced and the cells deformed with frac-ture of the cell walls with increasing CR from the anatomical structure analysis. The changes in surface wettability and surface free energy were related to the structural modifica-tion as well as a series of chemical reacmodifica-tions occurred in the surface of THM wood. The FTIR analysis showed that the degradation of hemicelluloses, condensation of lignin, and change of extractives were formed during the THM process. The XPS results suggested that (1) the migration of extrac-tives and the deposition of volatile organic compounds and (2) rich in lignin content on wood surface. The modification in color and surface free energy was related to chemical changes caused by the factor of temperature. In addition, the alteration of wettability was the result of the combination of structural and chemical modifications. However, the surface roughness was only caused by structural changes due to the high-pressure process. The high temperature, moisture, and mechanical action had various effects on different surface characteristics of poplar wood during THM process. The structural and chemical characterizations of THM wood cor-related well with its surface characteristic.
Acknowledgements The authors appreciate the financial support from the National Nonprofit Institute Research Grant of CAFINT (CAFYBB2017ZX003).
References
1. Bao M, Huang X, Zhang Y, Yu W, Yu Y (2016) Effect of density on the hygroscopicity and surface characteristics of hybrid poplar compreg. J Wood Sci 62:441–451
2. Bao F, Jiang Z, Jiang X, Lu X, Luo X, Zhang S (2001) Differences in wood properties between juvenile wood and mature wood in 10 species grown in China. Wood Sci Technol 35:363–375 3. Bao M, Huang X, Jiang M, Yu W, Yu Y (2017) Effect of
thermo-hydro-mechanical densification on microstructure and properties of poplar wood (Populus tomentosa). J Wood Sci 63:591–605
Table 7 Classification of carbon peak components for wood materials
C1 carbon atoms bonded with other carbon or hydrogen, C2 carbon atoms bonded with one oxygen atom, C3 carbon atoms bonded with two oxy-gen atom, C4 carbon atoms bonded with three oxygen atom
Group Binding energy
(eV) Bond Assignment
C1 284.6 C–C, C–H Carbon atoms bonded only with carbon or hydrogen atoms (lignin and extractives)
C2 286.1 C–O Carbon atoms bonded with one oxygen atom (hemicelluloses and cellulose) C3 288.0 C=O, O–C–O Carbon atoms bonded to a carbonyl or two non-carbonyl oxygen atoms
(hemicel-luloses and cellulose)
C4 289.3 O–C=O Carbon atoms bonded to one carbonyl and one non-carbonyl oxygen atoms
4. Fang CH, Mariotti N, Cloutier A, Koubaa A, Blanchet P (2011) Densification of wood veneers by compression combined with heat and steam. Eur J Wood Wood Prod 70:155–163
5. Navi P, Heger F (2004) Combined densification and thermo-hydro-mechanical processing of wood. MRS bulletin 29:332–336 6. Petrič M (2013) Surface Modification of Wood. Rev Adhes Adhes
1:216–247
7. Tjeerdsma BF, Militz H (2005) Chemical changes in hydrothermal treated wood: FTIR analysis of combined hydrothermal and dry heat-treated wood. Holz Roh Werkst 63:102–111
8. Šernek M, Kamke FA, Glasser WG (2004) Comparative analysis of inactivated wood surfaces. Holzforschung 58:22–31
9. Jennings JD, Zink-Sharp A, Frazier CE, Kamke FA (2006) Prop-erties of compression-densified wood, Part II: surface energy. J Adhes Sci Technol 20:335–344
10. Diouf PN, Stevanovic T, Cloutier A, Fang CH, Blanchet P, Koubaa A, Mariotti N (2011) Effects of thermo-hygro-mechanical densifi-cation on the surface characteristics of trembling aspen and hybrid poplar wood veneers. Appl Surf Sci 257:3558–3564
11. Unsal O, Candan Z, Korkut S (2011) Wettability and roughness characteristics of modified wood boards using a hot-press. Ind Crops Prod 34:1455–1457
12. Rautkari L, Laine K, Kutnar A, Medved S, Hughes M (2012) Hardness and density profile of surface densified and thermally modified Scots pine in relation to degree of densification. J Mater Sci 48:2370–2375
13. Kutnar A, Kamke FA, Petrič M, Sernek M (2008) The influence of viscoelastic thermal compression on the chemistry and sur-face energetics of wood. Colloids Surf A Physicochem Eng Asp 329:82–86
14. Gril J, Jullien D, Bardet S, Yamamoto H (2017) Tree growth stress and related problems. J Wood Sci 63:411–432
15. Shen Q, Nylund J, Rosenholm JB (1998) Estimation of the surface energy and acid-base properties of wood by means of wetting method. Holzforschung 52:521–529
16. Oss C (1995) Hydrophobicity of biosurfaces-origin, quantitative determination and interaction energies. Colloids Surf B Biointer-faces 5:91–110
17. Bekhta P, Proszyk S, Krystofiak T (2014) Color in short-term thermo-mechanically densified veneer of various wood species. Eur J Wood Wood Prod 72:785–797
18. Bekhta P, Marutzky R (2006) Reduction of glue consumption in the plywood production by using previously compressed veneer. Holz Roh Werkst 65:87–88
19. Korkut DS, Guller B (2008) The effects of heat treatment on physical properties and surface roughness of red-bud maple (Acer trautvetteri Medw.) wood. Bioresour Technol 99:2846–2851
20. Todaro L, Zanuttini R, Scopa A, Moretti N (2012) Influence of combined hydro-thermal treatments on selected properties of Tur-key oak (Quercus cerris L.) wood. Wood Sci Technol 46:563–578 21. Hakkou M, Pétrissans M, Zoulalian A, Gérardin P (2005) Inves-tigation of wood wettability changes during heat treatment on the basis of chemical analysis. Polym Degrad Stab 89:1–5
22. Kocaefe D, Poncsak S, Doré G, Younsi R (2008) Effect of heat treatment on the wettability of white ash and soft maple by water. Holz Roh Werkst 66:355–361
23. Mohan T, Kargl R, Doliška A, Vesel A, Köstler S, Ribitsch V (2011) Wettability and surface composition of partly and fully regenerated cellulose thin films from trimethylsilyl cellulose. J Colloid Interface Sci 358:604–610
24. Huang X, Kocaefe D, Kocaefe Y, Boluk Y, Krause C (2013) Struc-tural analysis of heat-treated birch (Betule papyrifera) surface dur-ing artificial weatherdur-ing. Appl Surf Sci 264:117–127
25. Kutnar A, Rautkari L, Laine K, Hughes M (2012) Thermody-namic characteristics of surface densified solid Scots pine wood. Eur J Wood Wood Prod 70:727–734
26. Bekhta P, Proszyk S, Krystofiak T, Lis B (2015) Surface wettabil-ity of short-term thermo-mechanically densified wood veneers. Eur J Wood Wood Prod 73:415–417
27. Huang X, Kocaefe D, Kocaefe Y, Boluk Y, Pichette A (2012) Study of the degradation behavior of heat-treated jack pine (Pinus banksiana) under artificial sunlight irradiation. Polym Degrad Stab 97:1197–1214
28. Inari GN, Petrissans M, Lambert J, Ehrhardt J, Gérardin P (2006) XPS characterization of wood chemical composition after heat-treatment. Surf Interface Anal 38:1336–1342
29. Colom X, Carrillo F, Nogués F, Garriga P (2003) Structural analysis of photodegraded wood by means of FTIR spectroscopy. Polym Degrad Stab 80:543–549
30. Inari GN, Pétrissans M, Dumarcay S, Lambert J, Ehrhardt J, Šernek M, Gérardin P (2010) Limitation of XPS for analysis of wood species containing high amounts of lipophilic extractives. Wood Sci Technol 45:369–382
31. Huang X, Kocaefe D, Kocaefe Y, Boluk Y, Pichette A (2012) A spectrocolorimetric and chemical study on color modification of heat-treated wood during artificial weathering. Appl Surf Sci 258:5360–5369