6
Degeneration of Four Wave Mixing in 500 m Step Index Two Mode Fiber
J.Jamaludin1, Z.Zakaria1,*, N.A.Awang1, F.S.A.Hadi1, A.N.Azmi1
1 Science Department, Faculty of Science, Technology and Human Development, Universiti Tun Hussein Onn Malaysia, 86400 Parit Raja, Batu Pahat, Johor
1. Introduction
An advent of high intensity of light in optical fiber leads to the rise of nonlinear effects. Basically nonlinear effects such as Kerr effects and optical scattering phenomena (Raman and Brillouin) are induced by several significance factors such as nonlinearity coefficient of optical fiber, the transmission length and dispersion factor in laser systems [1,2,3].
The Kerr effect is a state which the refractive index of optical fiber is slightly dependent on the electric field intensity (input signal) that passing through the optical fiber [2,4,5,6]
𝑛(𝜔, 𝑡) = 𝑛°(𝜔) + 𝑛2𝐼(𝑡) (1)
where 𝑛° is the linear refractive index,
𝑛2 is the nonlinear refractive index, I is the electric field intensity, and it is a ratio of optical power to the effective mode area i.e. I= P/𝐴𝑒𝑓𝑓
The presence of 𝜒(3) shows that the refractive index is dependence on the field intensity, I = |𝐸|2/𝑍1 , where 𝑍1= √𝜇 𝜀⁄ is the fiber
electromagnetic impedance. Somehow, the refractive index can be shown as
𝑛 = 𝑛0+ 𝑛2 |𝐸|2
𝑍𝐼 = 𝑛 + 𝑛2𝐼 (2)
where 𝑛0 and 𝑛2 are linear and nonlinear
refractive index respectively. The risen of Kerr nonlinearity effects depends on the shape of the injected field into the fiber. When the optical signal feeds into the fiber, the signal frequency
will interact and perform a complicated behaviour [2,4].
Four wave mixing is a practical process to generate new waves. On a fundamental stage, the harmonic motion of bound electrons under influence of an applied filed caused total polarization P induced by electric dipoles is not linear in the electric field and relies on this equation:
P = Ɛ0 ( 𝜒1.E+ 𝜒2:EE + 𝜒3⋮EEE +…),
(3)
P is the total polarization, Ɛ0 is the vacuum
permittivity and 𝜒𝑗 = (j = 1,2,3,…) is jth order
susceptibility. The third order susceptibility 𝜒3 is responsible for third harmonic generation, nonlinear refraction and four wave mixing. Most of the nonlinear effects in optical fiber have relation with the intensity dependence of refractive index which is known as nonlinear refraction. The refractive index can be written as
ῆ (ω,|𝐸|2) = n(ω) + 𝑛
2|𝐸|2, (4)
n (ω) is the linear part and |𝐸|2is the optical
intensity inside fiber, and 𝑛2 is the
nonlinear-index coefficient with relation to 𝜒3 by the equation below.
𝑛2=
3
8𝑛 Re ( 𝜒𝜒𝜒𝜒𝜒 3 ) (5)
Where Re is the real part and optical field is assumed to be linearly polarized so that only one component 𝜒𝜒𝜒𝜒𝜒 3 of four rank tensors contributes to refractive index. The tensorial Abstract: Four wave mixing (FWM) in two-mode fiber was experimentally demonstrated at 24.7 dBm of output Erbium doped fiber amplifier (EDFA). The 0.5 km two mode fiber in laser cavity enhances the performance of four wave mixing by suppressing the homogenous broadening effect in erbium-doped fiber and perform a stable oscillation. At output EDFA approaches to 24.7 dBm, FWM is generated and the increasing of output EDFA induced the optical signal to noise ratio (OSNR) of all laser peaks.
Keywords: Four wave mixing, two mode fiber, erbium-doped fiber
__________________________________________________________________________________________
*Corresponding author: zahariah@uthm.edu.my
2016 UTHM Publisher. All right reserved. 6
7 nature of 𝜒3 is able to affect the polarization
properties of optical input through nonlinear birefringence. Consider four waves oscillating at frequencies 𝜔1 , 𝜔2 , 𝜔3 , and 𝜔4 and linearly
polarized along same axis. The total electric field can be written as
E = 1
2 x̂ ∑ 𝐸𝐽 4
𝑗=1
exp[ 𝑖(𝑘𝑗 𝑧 − 𝜔𝑗𝑡)]
+ 𝑐. 𝑐., (6)
where the 𝑘𝑗 is the propagation constant and
four waves are assumed to be propagating in the same direction. We notice that the third order polarization term is given as
𝑃𝑁𝐿 = Ɛ0𝜒3⋮ EEE (7)
Where 𝑃𝑁𝐿 is the induced nonlinear
polarization, Ɛ0 is the vacuum permittivity and E is the electric field. For the induced nonlinear polarization form can be expressed as below
𝑃𝑁𝐿 = 1
2 x̂ ∑ 𝑃𝑗 4
𝑗=1
exp[ 𝑖(𝑘𝑗 𝑧 − 𝜔𝑗𝑡)]
+ 𝑐. 𝑐., (8)
With two input frequency components are coupled into a coupler another two additional frequencies are created.
𝑣3= 𝑣1 – ( 𝑣2 - 𝑣1 ) = 2𝑣1-𝑣2 (9)
𝑣4= 𝑣2+ ( 𝑣2-𝑣1 ) = 2𝑣2 -𝑣1 (10)
In general for N number of wavelengths of input channel will produce M number of cross mixing products and are given by the equation below
M =N
2
2 (N − 1) (11)
As mentioned by Liu et.al [1,2], FWM effect in the cavity is related to three parameters of optical fiber, the length, the dispersion and the nonlinearity coefficient. Based on the theory, the HNLF is highly recommended as compared to SMF to increase the FWM effect in cavity. The fiber non-uniformity plays a vital role for suppressing the FWM process efficiency in a longer fiber [2,7,8,9].
FWM can occur if at least two different frequency components propagate together in a nonlinear medium such as optical fiber or optical amplifier. FWM requires phase matching in the propagation of waves. To perform the phase matching the chromatic dispersion should be minimized in the fiber and a small channel spacing is compulsory between the propagating waves.
2. Experimental Setup
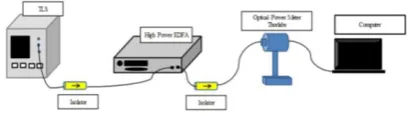
A linear cavity laser system is applied as the laser system configuration. Firstly, to carry out this experiment, an input power characterization and amplified spontaneous emission reading experiment had been performed to determine the actual amount of emitted power before entering the under test fiber (UTF). The increment of input power signal from high power erbium doped fiber amplifier was recorded to ease in optical pump power measurement and handling this experiment. A pump-wave power is required to obtain better performance of four wave mixing [2,9] as such, an active pump erbium doped fiber had been introduced to perform experiment of four-wave mixing. The circuit configuration for generating four wave mixing is shown in figure 1. A high power Keopsys EDFA model CEFA-CPB-HP-SM-37-NL1-OM1-B203-FA-FA is utilized to amplify optical light from tunable laser source (TLS).
Figure 1 The experimental set up of EDFA power characterization.
8
Figure 2 The experimental set up for ASE spectrum.
A tunable laser source was set at 10.9 dBm power output for generating 1551 nm light wave to demonstrate the input power characterization of high power erbium doped fiber amplifier. The optical propagation of light wave started from the light source into an isolator. A light wave with a 1551 nm wavelength was pumped from a tunable laser source (TLS) into a high power erbium doped fiber amplifier. The light wave propagated in a unidirectional path due to the presence of isolator in the laser cavity. An increasing amount of current was injected into the erbium doped fiber inside the amplifier to provide energy for the gain media to amplify the propagated light wave from the TLS. About 400 mW to 1400 mW input current of had been injected to the EDFA and able to be set at the knob of injected current on the display on the high power erbium doped fiber amplifier unit (to supply the current into the erbium doped fiber). The amplified light wave passed through an isolator before entering a ThorLabs optical power meter. The result of peak power of the light wave had been detected at the power meter and a graphical user interface software from ThorLabs was displayed and collected from the computer display screen.
Based on the configuration of the design circuit in Figure 3, the optical pulse propagates from two Yokogawa (AQ2200) tunable laser source, TLS1 and TLS2, which functioned as the light source. Light sources from TLS1 and TLS2 are combined by 3 dB coupler before they are amplified by a high power erbium doped fiber amplifier, EDFA with a range from 400 mW to 1400 mW input current. TLS1 and TLS2 with power of 7.9 dBm and 4.9 dBm, respectively are tuned from 1550 nm to 1567 nm with 1 nm different from both. The light waves propagate in unidirectional path as the insertion of an isolator before passing through a 500 m two mode fiber. The light waves are expected to generate nonlinear effects through these two mode fiber. This few mode fiber is manufactured by OFS, Furukawa. The fiber
diameter is 124.9 µm. The coating diameter for this fiber is 24.1 µm. The attenuation is 0.2 dB/km. The optical waves from EDFA are launched into a step index two mode fiber (SI-TMF). The SI-TMF is 500 m long and supports two spatial modes, LP01 and LP11 modes. The dispersion for LP01 is 21.1 ps/(nm.km). While the dispersion for LP11 is 20.7 ps/(nm.km). After propagating through two mode fiber, only 10% of total power output from 90/10 optical coupler output ports to be directed to the Yokogawa optical spectrum analyser with 0.02 nm resolution bandwidth. The output spectrum of two mode fiber is aligned by using mechanical mode filter which allows the fundamental LP01 or LP11 mode to propagate with minimal loss.
Figure 3 The experimental set up for four wave mixing in TMF.
Two sets of experiment had been carried out using the design circuit as in Figure 3 in order to provide a better understanding about four-wave mixing in a two mode fiber. Two sets of Yokogawa tunable laser source had been used to achieve the formation of four-wave mixing. The first was the fix channel spacing between both of tunable laser sources in detuning of wavelength at both of the same tunable laser sources and the second was experiment on a fix channel spacing for both tunable laser sources with an increasing of input power at the high of EDFA.
9 The second set was 1551 nm for TLS1 and 1552
nm for TLS2. The third set was 1552 nm for TLS1 and TLS2 is set as 1553 nm. The experiment was ended up until all 17 sets had been completed. The wavelengths of both TLS were varied to examine optical characteristics such as the peak power distribution of both peaks of idler, pump peak and probe peak.
The second set of experiment used the same circuit design as the previous experiment. The two tunable laser sources were set at fix output wavelengths. The TLS1 was set at 1550 nm and 1551 nm for TLS2. The input power was set to be varied from 22 dBm to 27.7 dBm. The input power was controlled at the high power EDFA power knob. Only six sets of experiments had been performed.
3. Results and Discussions
The threshold of output EDFA to perform four wave mixing is 24.7 dBm. Due to high intensity of power lasing, the output readings from EDFA need to be examined properly. Thus, it is compulsory to measure the optical power at the output of the amplifier in order to put a power limit to avoid damage in all involved instruments. The first part of the experiment was the characterization of EDFA and the second part was the formation and investigation of four wave mixing in two mode optical fiber.
The output power data from EDFA is plotted in the Figure 4. At a given of 400 mA input current an output 18.36 dBm output power had been formed. At 500 mA the output power of EDFA was 21.53 dBm. At 600 mA input current about 23.41 dBm output power of EDFA had been formed. At 700 mA input current the output power of EDFA was 24.71 dBm. At 800 mA input current about 25.73 dBm output EDFA had formed. At 900 mA, 26.58 dBm of output EDFA had formed. At 1000 mA the output power of EDFA was 27.32 dBm. At 1100 mA about 27.91 dBm output power of EDFA was formed. At 1200 mA, 1300 mA and 1400 mA of input currents given, about 28.41 dBm, 28.89 dBm and 29.22 dBm output power of EDFA were formed respectively. From this graph, the power output is not linearly increasing. The highest output power was at 29.22 dBm and within the inclination of input power from 400 mA to 1400 mA, the output power of EDFA showed 10.86 dB power inclination.
Figure 4 The output power of EDFA in increasing input current.
The ASE spectrum is plotted in Figure 5. This data is obtained at 600 mA pumping current. Based on this the data, at 1551 nm output wavelength had produced -3.53 dBm output power laser. The suitable operation of EDFA is around 1540 -1570 nm pumping light. This figure shows that ASE power spectrum covers a broadband wavelength under a 1551 nm tunable laser source pumping. In between this range wavelength, any of light source signal will be amplified gradually by this amplifier. As the ASE of EDFA is useful to construct light sources, the significance value of the gain in EDFA will provide amplification of light from the pumping source with significant increase in pump power from the pumping source of light. The total ASE power increases with the pump power.
Figure 5 The ASE of EDFA 600 mA pumping current.
10 dBm) and pump power (1551.82 nm with
-13.82 dBm peak power). Based on Figure 4.16 b (set 9), the formation two idlers had been observed at 1557.39 nm with peak power -57.73 dBm and at 1561.98 nm with peak power at -57.01 dBm as the probe peak was recorded at 1558.63 nm with -14.12 dBm and pump probe at 1559 nm input wavelength with peak power of -13.72 dBm. Figure 4.16 c shows the 17th set with two idlers were formed at 1565.46
nm with -62.19 dBm peak power and at 1568.88 nm with peak power -65.01 dBm. For this set, the pump peak was at 1566.61 nm with -14.53 dBm peak power and the probe peak was recorded at 1567.75 nm with -15.28 dBm peak power.
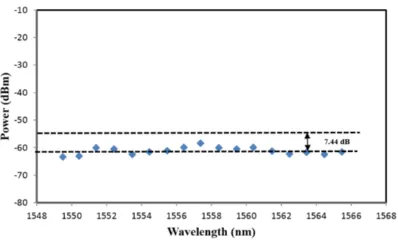
Figure 7 shows the power at the first peak (idler) of 17 sets of FWM phenomena at different input wavelengths from the two TLS. The first set of experiment was set up by fixing the channel spacing between input wavelengths from both TLS about 1 nm.The highest peak power of idler in formation of FWM was recorded at the 9th set and the TLS1 (1558 nm)
and TLS2 (1559 nm) at -58.44 dBm. On the other hand, the lowest power was recorded at the 1st set where the TLS1 (1551 nm) and
TLS2 (1552 nm) with -65.88 dBm idler peak power. The peak power fluctuation for the first idler was recorded by a value of 7.44 dB.
Figure 6 Four wave mixing in three different set of experiments.
Figure 7 The distribution of first idler peak power.
Figure 8 shows the power at the pump peak of 17 sets of FWM phenomena at different input wavelengths from the two TLS. The highest input power was recorded in the 13th set which
TLS1 (1563 nm) and TLS2 (1564 nm) at -14.16 dBm. On the other hand, the lowest power was recorded in the 2nd set TLS1 (1552 nm) and
TLS2 (1553 nm) at -16.75dBm. The fluctuation of the optical power is 2.59 dB. Adjustment of polarization state at the polarization controller gives arise to peak power enhancement, thus, less fluctuation had been achieved.
Figure 8 The distribution of pump peak power.
11
Figure 9 The distribution of probe peak power. Figure 10 shows the power at the second idler peak of 17 sets of FWM experiment at different input wavelengths from the two TLS. The highest input power was recorded at the set number 9 (TLS1 (1559 nm) and TLS2 (1560 nm)) at -57.38 dBm. On the other hand, the lowest power was recorded at the set number 17 (TLS1 (1567 nm) and TLS2 (1568 nm)) at -64.45 dBm. The power fluctuation is 7.07 dB. It is higher than power fluctuation of the pump peak and probe peak which are less than 2.6 dB. The probe peak showed the greatest stability of peak power with a value of 1.81 dB.
Figure 10 The distribution of second idler peak power.
An observation of FWM had been made at a given 25 dBm EDFA output power which had been launched into the laser system to generate FWM. There are four peaks of different wavelengths are obtained in the result. Two of them belong to the pump and probe while another two are known as idler. Further discussion is provided to serve better angle of view and greater understanding for this occurrence.
Figure 11 shows the result for FWM earned previously when two input wavelength lasers are utilized, 1550 nm and 1551 nm respectively at a pumping power of 25 dBm. Two idlers are shown in the spectrum result from OSA. The power for the first probe peak is -2.55 dBm. While the second probe peak power is
-6.43dBm. The shorter wavelength idler states about -48.9 dBm and the longer wavelength idler peak power is -52.6 dBm. The OSNR value shown in Figure 11 and was labelled to each of the peak. The OSNR of the idler 1, pump peak, probe peak, and idler 2 are 9.1 dB, 54.45 dB, 50.57 dB, and 4.4 dB respectively.
Figure 11 The optical spectrum of four-wave mixing at given 25 dBm EDFA output power.
12 background noise also had been recorded about
-61.073 dBm at 22 dBm and had achieved about -55.804 dBm at 27.7 dBm. It is an increment of 5.27 dB. The higher output EDFA triggers a higher noise to the circuit.
Figure 12 Optical power variation with increase EDFA Output power.
Figure 13 shows the power difference over a varied output power of EDFA for the value of side mode suppression ratio and optical signal-to-noise ratio. The highest pump peak for each current supplied is recorded and compared to the noise which had been measured from the graph from the optical spectrum analyzer. The optical signal-to-noise ratio value is reduced from 57.73 dB to 56.23 dB at 22 dBm and 27 dBm respectively. The side mode suppression ratio (SMSR) value is plotted as shown. It produced a greater reduction which is 7.22 dB as compared with the reduction of optical signal-to-noise (OSNR) value, 1.5 dB due to increase in secondary idler peak power and the increase of noise as the current is increased. The noise was increased due to the increasing of input power given. The increasing of EDFA output power leads the amplified spontaneous emission to increase. The noise in the laser system increased as it is affected by the high amplified spontaneous emission.
Figure 14 shows the result obtained by comparing the EDFA output power changes over two different OSNR produced from two idlers, the first idler is independent to the increasing of output power given but the second idler give an increasing profile in its reading. The second idler is directly influence to the SMSR between peak one and peak two. The secondary peak value is directly proportional to the output power from EDFA. Thus the FWM for this configuration of circuit is depending on the input power of EDFA. The various
polarization states of light wave and mode competition are the main hindrance to achieve the desired stable laser at the output. The nonlinearities in material give us a research gap to critically explore the benefit beneath in all nonlinear phenomena.
Figure 13 SMSR and OSNR increase the EDFA Output power.
Figure 14 The OSNR of idlers in increasing EDFA output power.
4. Conclusion
We have investigated four wave mixing in two mode fiber. At output EDFA approaches to 24.7 dBm, FWM is generated and the increasing of output EDFA induced the OSNR of all laser peaks.
Acknowledgements
13 Research Centre, PRC of Universiti Malaya
(UM).
REFERENCES
[1] Liu, X., Zhou, X., & Lu, C. (2005). “Four-wave mixing assisted stability
enhancement: theory, experiment, and application”, Optics letters, 30(17), 2257-2259.
[2] Ahmad, H., Thambiratnam, K., Awang, N.A., Ghani, Z.A., Harun, S.W.(2012), “Four-wave mixing in zirconia-erbium doped fiber - a comparison between ring and linear cavities”, Laser Physics Letters, 9 (11), pp. 819-825.
[3] Jamaludin, J., Zakaria, Z., Awang, N.A., Zulkifli, M.Z.(2016). “The comparison of dual wavelength fiber laser spectrum in SMF and HNLF by utilizing laser diode,” ARPN Journal of Engineering and Applied Sciences, 11 (18), pp. 10825-10829.
[4] Agrawal, G.P. (2001). Nonlinear fiber optics. 3rd. ed. London: Academic Press. [5] G.P.Agrawal, Fiber-optic communication
systems. 3rd ed. 2002: John Wiley & Sons, Inc.,New York.
[6] Senior, J.M., Optical fiber communication:principle and practice. 2nd edition ed. 1992: Prentice Hall.
[7] Stolen, R. H., Bjorkholm, J. E., & Ashkin, A. (1974). “Phase‐matched three‐wave mixing in silica fiber optical
waveguides”. Applied Physics Letters,24(7), 308-310.
[8] Mac Suibhne, N., Ellis, A. D., Gunning, F. G., & Sygletos, S. (2013). “Experiment Verification of Four Wave Mixing Efficiency Characteristics in a Few Mode Fibre”. In IET Conference Proceedings. The Institution of Engineering & Technology.
[9] d’Ottavi, A., Martelli, F., Spano, P., Mecozzi, A., Scotti, S., Dall’Ara, R., Guekos, G. (1996). “Very high efficiency four‐wave mixing in a single
semiconductor traveling‐wave