Abstract: Flood damage estimation is an essential element in the assessment of flood risk. However, the assessment of flood damage in developing countries is challenging due to the scarcity of historical data. An attempt has been made to assess the flood damages of 2013 Kuantan flood and to develop a flood damage function model based on the socio-economic and property characteristics of the study area. A field survey was conducted to gather damage data and information regarding the flood event using face to face interview technique. Age, household income, educational background, occupation and the distance from river have been identified as the most significant variables that influence the residential flood damages. A damage model to aid in the estimation of the structural and content damage have been developed. The preliminary results can be used in the future flood damage assessment works, especially in the development of flood damage function curve.
Keywords: Flood damage assessment, flood damage function curve, data scarcity, Kuantan, residential © Universiti Tun Hussein Onn Malaysia Publisher’s Office
IJIE
Journal homepage: http://penerbit.uthm.edu.my/ojs/index.php/ijie
ISSN : 2229-838X e-ISSN : 2600-7916
The International
Journal of
Integrated
Engineering
Flood Damage Function Model for Residential area in
Kuantan: A Preliminary Study
Noor Suraya Romali
1,*, Zulkifli Yusop
2, Nur Izyan Hani Mohd Zaki
1,
Muhammad @ S. A. Khushren Sulaiman
1, Nadiatul Adilah Ahmad Abdul
Ghani
1, Suryati Sulaiman
11Faculty of Civil Engineering and Earth Resources,
Universiti Malaysia Pahang, 26300 Pahang, MALAYSIA.
2Centre of Environmental Sustainability and Water Security,
Universiti Teknologi Malaysia, 81310 Johor, MALAYSIA.
*Corresponding Author
DOI: https://doi.org/10.30880/ijie.2019.11.02.022
Received 00 Month 2000; Accepted 01 Month 2000; Available online 02 Month 2000
1.
Introduction
Floods are among the most common and costliest natural disaster worldwide. Flood caused great harm to community and properties, as well as deteriorate the quality of environment, disrupt various infrastructures and threaten human health. Nowadays, the impacts of flood are increasing as the consequence of climate change phenomenon and due to the rise of high intensity storms frequency, not to mention the projection rise of urban population [1]. In recent years, increased attention has been paid to flood risk management practice in minimizing the effects of a flood [2].
Flood risk assessment is the combination of the probability of a flood event to occur (hazard) and the potential of flooding impacts to community and assets (vulnerability) [3], [4]. Flood hazard assesses the flood extent and magnitude which is normally illustrated in flood inundation maps or flood extent maps. Flood vulnerability assesses the potential impacts of flood to the exposed elements such as human being, community, properties and environment [5]. Expected annual damage (EAD) is a common indicator for vulnerability assessment [6], presented as a combination of flood probability and its potential damage [7]. In addition, the consequences of flooding are usually illustrated in flood risk map contains the information of predicted damage in the monetary term (e.g. [8]-[10]).
Nowadays, vulnerability is considered as important as hazard [11]. Flood damage estimation is the important element in flood vulnerability assessment. The damage estimates are useful in the development of flood risk mapping, risk analysis and financial appraisal, and the evaluation of flood mitigation measures [5].
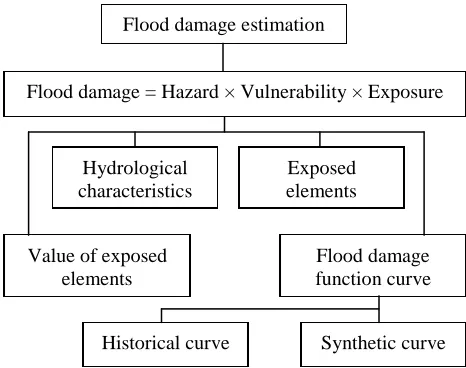
Flood damage estimation
Flood damage = Hazard × Vulnerability × Exposure
Hydrological characteristics
Exposed elements
Value of exposed elements
Flood damage function curve
Historical curve Synthetic curve
Flood damage may be evaluated directly from existing database or by using modeling approach. The latter method consists of three main elements i.e. hazard, vulnerability and exposure [12], [13]. As shown in Fig. 1, the combination of hydrological characteristics (hazard), flood damage function curve (vulnerability), and characteristics/value of exposed elements (exposure) is used to estimate the flood consequences in monetary term. This damage estimation concept had been used by many researchers worldwide [14]-[22].
The methods of establishing flood depth-damage curve could be divided into two main categories i.e. historical and synthetic (Fig. 1). The first one is based on damage data of past floods, and the other one is known as synthetic stage- damage functions which based on hypothetical analysis. In historical curve method, the direct questionnaire and loss investigation would be carried out after the disaster and then the investigated data would be analysed statistically. Since the loss has been caused during the real flood, it is also called as actual flood damage [23].
Fig. 1 - The concept of flood damage estimation
Flood damage may be classified into two main types; tangible and intangible damages. Tangible damage is the damage than can be directly measured in monetary terms. Building and contents damage, infrastructure damage, and livestock damage are the examples of tangible damage. In contrast, loss of life and psychological distress can be related to intangible damage where the damages cannot be directly measured in monetary terms [5]. The tangible and intangible damage can be further divided into two sub types i.e. direct and indirect damage. Direct damage occurred due to physical contact or submersion in flood water, while the indirect damage is the damage caused by the disruption to physical and economic linkages [15], occurs outside the flooded area [24].
2.
Scenario in developing countries
In developing countries, the study on flood damage estimation have been conducted by Lekuthai and Vongvisessomjai [15], KTA Tenaga Sdn. Bhd. [23], Ahamad et al. [26], Suriya et al. [27], and most recent ones by Chen et al. [21], Kefi et al. [22] and Win et al. [23]. Flood damage data scarcity is the main problem experienced by the developing countries in conducting flood damage assessment [27-28]. The historical data is rarely available, hence a survey had to be conducted to gain the related flood damage data and information, as been observed in [21]- [23], [25].
In Malaysia, the academic papers on flood vulnerability assessment are sparse, with only limited studies related to damage estimation [25], ]26], ]29], [30]. Moreover, most of the studies adopted methodology from other countries where the flood damage function curve used is from United States, Netherlands, Australia and Japan [5]. The usage of site- specific damage function curve is important to reflects the local condition of a study area, thus provided a reliable damage estimates.
Due to the higher concentration of population and asset nowadays, the vulnerability of urban area is increased, thus needed a detail damage assessment that can also be used to predict future flood effects [1]. Hence, the aim of this study is to develop a residential flood damage function model to assist in the flood vulnerability assessment of an urban area in Malaysia. The objective is to assess the direct tangible flood damage experienced by the victims of 2013 Kuantan flood and to develop a relationship between flood damage and socio-economic/property characteristics of the study area. The model can later be used to develop a flood damage function curve for future flood modeling studies.
2.
Methods
2.1
Study Area
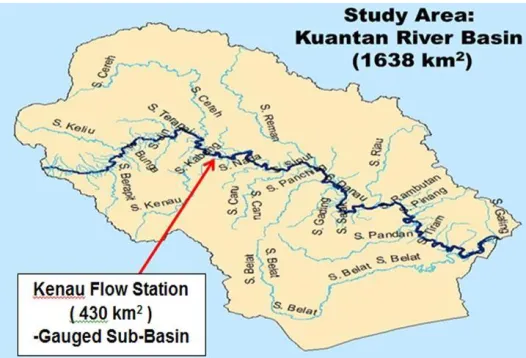
Ulu Kuantan through the Kuantan city and ends at the Perkampungan Tanjung Lumpur before flowing out to South China Sea [31]. Fig. 2 shows the map of KRB displaying the area, main river, tributaries and the streamflow station.
Several major flood have occurred along Sg. Kuantan, causing extensive damage to the local community, especially to low laying areas of Kuantan [32]. In the last few decades, Sg. Kuantan experienced severe flood in 2001/02, 2011/12, and recently in 2013. Major damage to properties, infrastructures and traffic occurred, while around 14,044 people were evacuated during the 2013 flood [32]. However, to date, none flood vulnerability assessment has been studied within the river basin. Hence, Kuantan has been selected as the study area to assess the impacts of flood to society and properties.
Kuantan is the state capital of Pahang, Malaysia with an approximate area of 2,960 km2. Kuantan falls under large
size city where the population is almost 607,778. Most of the residents are Malay (50%), followed by Chinese (37%), Indian (10%) and others (1%). Its major economy activities are tourism and industry.
2.2
Data Collection
Fig. 2 - Study area: Kuantan River Basin
A pilot survey was conducted on 25 March to 8 April 2018 to gain a clearer picture of the flooding in 2013. The scope of this study is the assessment of direct tangible damage, considered only for the residential areas of Kuantan where the damage was assessed separately for structural and content damage.
Respondent was chosen randomly and were interviewed using face to face technique. Interviews were conducted with local people in flood affected residential area i.e. Kg. Bukit Rangin, Perkampungan Sungai Isap, Kg. Permatang Badak dan Kg. Sungai Soi. The sampling areas were selected based on the information from the available flood maps, newspaper and internet. The survey was conducted using questionnaire form developed based on previous report [25] and literatures [27].
The main purpose of the pilot study was to test the interview survey questionnaire whether it’s adequate to be used for the real flood damage data collection. The information gained from the survey may be used to improve the methodology. The outcome, such as the factor that influenced the level of flood damage may deserved prioritization in the future works.
2.2.1
Questionnaire Survey
The questionnaire was designed as a closed end type where the respondents can answer in a single word, in a short phrase or multiple choices. The questionnaire consists of two sections; (1) residential property survey and (2) residential damage survey, as shown in Table 1.
For section 1, the socio-economic information (such as age, sex, household income, and education level) and the property characteristics (such as types of property, type of construction materials, numbers of storeys and distance from river) were asked. The respondents also have to estimate the total value of in-house belongings. For section 2, respondents were asked to estimate the damage depth/duration and damage value of the flood events i.e. the value of content, structural and vehicle damage. In order to obtain the statistical characteristics of flood damage and to study the influence of the socio-economic and property characteristic variables to the level of flood damage, the data was analysed using STATA 13.1 software.
Table 1 - Questionnaire survey outline
Section (1) Section (2)
Residential property survey Residential damage survey Part A: Socio-economic information
- Sex, age, race, education level, occupation, house income
Part A: Flood characteristics information - Years of flood event
- Duration of flooding (days) - Flood depth (meters) Part B: Property characteristics information
- Ownership status, house price, house types, construction materials, insurance status, and number of units, types and price of the house content (furniture etc.)
Part B: Flood damage information
- Structural damage, clean-up cost, content damage, vehicle damage, loss of salary/wages
2.3 Variables and Regression Method
Multiple regression analysis had been adopted by several previous researchers to model the relationship between flood and various variables [23], [33]. Every value of the independent variable (flood influenced factor, x) is associated with the value of the dependent variable (flood damages, FloodD).
In this study, the dependent variable covers the level of property damages in terms of structural and content damage. While the independent variables are divided into two categories i.e. socio-economic and property characteristics. The socio-economic variables are sex, age, race, education background, occupation and house income, whereas the properties variables are ownership, price of properties, properties type, number of storeys, building material, and flood insurance status. The general equation is as Eq. (1) below:
Flood D f (xi1 , xi 2 , xi3 ... xip ) (1)
The transformation of the functions for model in equation (1) resulted a regression model as shown in equation (2):
ln Flood Di
0
1 ln xi1
2 ln xi 2
p xip
i (2)where i = 1, 2, 3, …….n while p and ε refer to the numbers of independent variables and error term respectively. lnFlood
is the logarithm of flood damages from surveys.
3.
Results and Discussion
3.1
Survey Results
3.1.1
Socio-Economic Characteristics
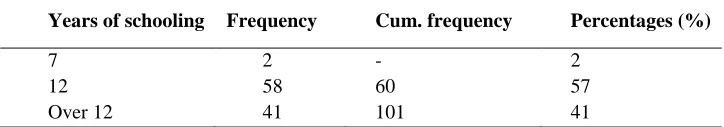
A total of 101 respondents were interviewed where 52.5% of the respondents were male. The ages of the respondents range from 41 to 64, and the average age was 40 years old. All the respondents are Malay. Table 2 illustrates the distribution of respondents according to their educational background. Majority of the respondents (57%) had been to school for 12 years, which was up to secondary education. From the relationship between educational background and occupation shown in Fig. 2, almost 33% of them (23 respondents) work in government sectors. Meanwhile, 41% of the respondents who attended post-secondary institutions work mostly with private sectors. It was found less than 7% of the respondents involved in business field. Table 3 shows the majority of the respondents falls under low-class income category (RM1000-RM3000) where the average household income was RM2140 per month. None of the respondents earned more than RM5000 per month, while only 16% have income in the range RM3001 to RM5000 per month.
Table 2 - Distribution of respondents by educational background
Years of schooling Frequency Cum. frequency Percentages (%)
7 2 - 2
12 58 60 57
Fig. 2 - Relationship between educational background and occupation of the respondents
Table 3 - Distribution of respondents by household income
Class interval (RM/month) Frequency Cum. frequency Percentages (%)
<1000 0 - 0
1000-3000 85 85 84
3001-5000 16 101 16
>5000 0 101 0
3.1.2
Property Characteristics
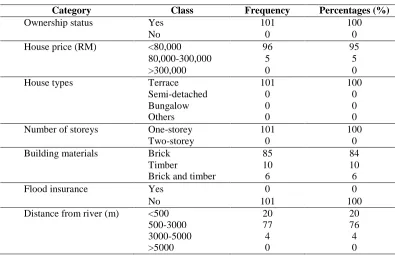
The property characteristics such the ownership status, the types and price of the houses, as well as the flood insurance status is shown in Table 4. All the respondents owned the house. Most of the houses (i.e. 95%) priced below RM80,000. All the houses were one-storey terrace houses. The type of building’s fabric materials that is mostly observed is brick which is 64%, timber (10%), whereas only 6% of the interviewed houses were built from brick and timber. The awareness of taking flood insurance is very low where none of the respondents insured their properties. The distance from the house to the river is one interesting variables that should be considered in investigating flood impact. From the survey, it was found 76% of the houses located near the nearby river which is the range of 500 to 3000 meters, while about 20 houses were less than 500 m from the river.
Table 4 - Property characteristics of the study area
Category Class Frequency Percentages (%)
Ownership status Yes 101 100
No 0 0
House price (RM) <80,000 96 95
80,000-300,000 5 5
>300,000 0 0
House types Terrace 101 100
Semi-detached 0 0
Bungalow 0 0
Others 0 0
Number of storeys One-storey 101 100
Two-storey 0 0
Building materials Brick 85 84
Timber 10 10
Brick and timber 6 6
Flood insurance Yes 0 0
No 101 100
Distance from river (m) <500 20 20
500-3000 77 76
3000-5000 4 4
>5000 0 0
3.1.3
Flood Characteristics
Flood characteristics are one of the important elements in flood damage modeling. The flood parameters such as flood depth and flood duration, when plotted against the value of flood damages will produce flood damage function curve. Table 5 shows the flood characteristics of the study area where it can be seen that Kg. Bukit Rangin recorded the highest flood depth i.e. 2.92 meters from floor level. The duration of flood was between 4 to 6 days for all the surveyed area.
Table 5 - Flood characteristics of the study area
Area Average flood
depth (m)
Average flood duration (days)
Kg. Bukit Rangin 2.92 5
Perkampungan Sungai Isap 1.07 4
Kg. Permatang Badak 1.43 4
Kg. Sungai Soi 1.09 6
3.2
Characteristic of Damage Dataset
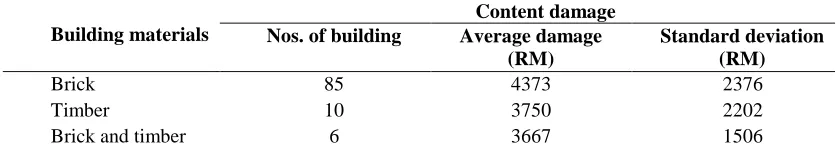
Table 6 and Table 7 presents the statistics of structural and content damage according to construction materials respectively. Standard deviations are low for brick and timber for both structural and content damage. Brick material shows the highest average structural damage (RM2564) and standard deviation (RM1518) for structural damage. Table 7 illustrates similar results where average content damage and standard deviation for brick house is the highest, compared to other materials used.
Majority of the houses at Kuantan are from brick type regardless the price of the properties. The value of the brick houses ranges from RM30,000 (low price house) to RM120,000 (median price house). As seen in Table 8, the minimum structural damage is RM500 from both low price house (LPH) and median price house (MPH) category. However, the maximum structural damage i.e. RM6,000 is from LPH. While for content damage, the minimum damage is from MPH (RM1,000) while the maximum damage is from LPH (RM11,000). Hence, the high standard deviation value is partly justified by the fact that the rate of damage is differ according to the price of the house although at the same type of construction materials. High price house expected to have more expensive wall finishing, as well as expensive furniture, compared to the low price house.
From Table 8 it’s found that the damage incurred associated with content damage (RM1,100-RM11,000) is higher than the structural damage (RM500-RM6000) for LPH, as well as for MPH category. The finding is in agreement with Dutta et al. [8] where in their study, the residential content damage is higher by more than 50% compared to the structural damage. In addition, the LPH experienced damage more than the MPH. This may due to the fact that the LPH located nearer to the river compared to MPH i.e. within less than 500 to 3000 meters, as shown in Table 9.
Table 6 - Distribution of structural damage according to construction materials
Structural damage Building materials Nos. of building Average damage
(RM)
Standard deviation (RM)
Brick 85 2564 1518
Timber 10 1850 1156
Brick and timber 6 1667 816
Table 7 - Distribution of content damage according to construction materials
Content damage Building materials Nos. of building Average damage
(RM)
Standard deviation (RM)
Brick 85 4373 2376
Timber 10 3750 2202
Table 8 - Distribution of structural and content damage according to house price
Structural damage (RM)
Content damage (RM)
Min Max Min Max
Low price house (LPH) 500 6000 1100 11000
Median price house (MPH) 500 3000 1000 4000
Table 9 - Distribution of the distance of house from river according to house price
Distance from river (m)
<500 500-3000 3000-5000
Low price house (LPH) 20 77 0
Median price house (MPH) 0 0 4
3.3
Flood Damage Function Models
In order to compare the relations between flood damages and socio-economic/property characteristics, simple regression analysis was made. The coefficient of determination (R2) and p-value (significance level) was observed, where
a 5% significance level (p < 0.05) is used in this analysis. Independent variables such as the age and race of the respondents, household income, education level, occupation, types of construction materials, the distance of house from river and flood insurance status were considered for explaining the relation between structural/content damage and socio- economic/property characteristics of the study area.
3.3.1
Structural Damage
The relationship between structural damage and socio-economic and property variables is explained by Eq. (3) below:
ln Flood 4.455 0.828ln AGE 0.568ln INC 0.630 ln DFR (3)
where ε is error term and lnFlood is logarithm of structural flood damage with the following influenced factors; AGE = age of the respondents, INC = household income of the respondents, DFR = distance from river.
Because of the low data quantity, the model performance is considered good with R2 equal to 0.35. A similar result
is observed in a study by Poussin et al. [34] relating the flood damage mitigation behavior amongst households in France where the R2 was between 0.19 to 0.31.
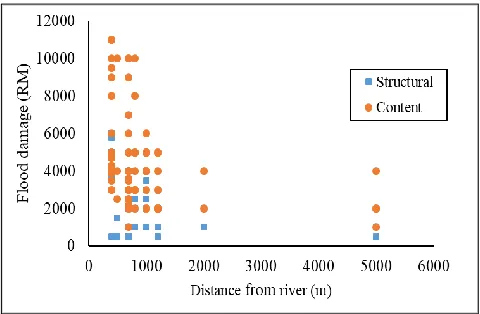
The results in Table 8 show that the value of residential structural damage is positively correlated with the age and household income but is negatively correlated with the distance from river. With the assumption that all other variables are unchanged, a unit increment in household income will result in 56.8% (0.568) increment in the structural damage when a linear relationship is assumed. Meanwhile, the structural damage decrease by 0.630 for every unit increment in DFR. This is in agreement with the observation from the survey where the structural damage decrease with the increasing distance of the house from river (Fig. 3).
Table 8 - Regression analysis results on the impact of socio-economic and property variables on structural flood damages
Variable Coefficient Std. Error t p-value
lnAGE 0.828 0.2572 3.22 0.002
lnINC 0.568 0.1458 3.90 0.000
lnDFR -0.630 0.1148 -5.49 0.000
Constant 4.455 1.8606 2.39 0.019
Fig. 3 - Relationship between distance from river and flood damages.
3.3.2
Content Damage
The content damage was found to be influenced by three variables i.e. the educational background, occupation and DFR. The relationship is illustrated in equation (4) below:
ln Flood 10.467 0.298EDU 0.179OCCU 0.372 ln DFR (4)
where ε is error term and lnFlood is logarithm of structural flood damage with the following influenced factors; EDU = educational background of the respondents, OCCU = respondent’s occupation, DFR = distance from river.
The R2 value is 0.251 which is lower than the structural damage model in equation (3), but still in the range obtained
by Poussin et al. [34]. The results for content damage are summarized in Table 9. The educational background and the age of the respondents was found to have significant positive relationships to the total amount of content damage. This is an interesting finding as the rate of flood damage is commonly related to the total of household, household income, and building materials variables [23, 24]. This result is consistent with Panic et al. [34] and Morrisey [35] who found that education also plays a crucial role in influencing the flood damage. The people with better educational background is more knowledgeable, hence tend to be more aware and prepared for any natural disaster event [33]. Similarly, people with better occupation tend to be more exposed with advance mitigation options and well prepared. The relationship between the educational background and occupation of the respondents is explained in Section 3.1.1 where most of the respondents who attended schools for more than 12 years have a better occupation, either in private sectors or as businessman (Fig. 2). The types of occupation may also define the affordability of the respondent in buying more expensive furniture, thus cause greater damage.
In contrast, the distance from river (DFR) was found to have significant negative relationships to the value of content damage when a linear relationship is assumed, as have been observed in Section 3.3.1 for structural damage. For every meter increment in DFR reduce the content damage by 0.372. This is because the nearer the property to river, the more vulnerable it is to the risk of flooding.
Table 9 - Regression analysis results on the impact of socio-economic and property variables on content flood damages
Variable Coefficient Std. Error t p-value
EDU 0.298 0.0957 3.11 0.002
OCCU 0.179 0.0986 1.81 0.050
lnDFR -0.372 0.0847 -4.39 0.000
Constant 10.467 0.5717 18.31 0.000
3.4
Flood Depth-Damage Relationships
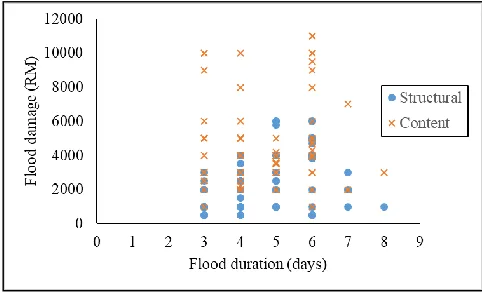
Fig. 4 and Fig. 5 shows residential damage estimates from the interviews survey conducted within the study area based on the 2013 floods. Separate values are plotted for structural and content damage, in relation to the flood depth and flood duration for 101 properties. Such information forms the basis for the construction of flood damage function curve [36]. It is observed from Fig. 4 that the scatter is large, thus need a considerable raw data smoothing. While in Fig. 5, it is observed that the magnitude of flood damage does not vary with the flood duration values. This shows that the survey data related to flood duration is inconsistent and may be discarded.
found that the content damage was higher than the structural damage in their study to develop a flood damage function curve in Japan and Greece respectively. The structural damage data given by the respondents were based on the cost of repair and replacement value. It is observed that the structural damage needed only a minor repair compared to the repair cost of the house content (e.g. furniture, kitchen cabinet, etc.). Most of the furniture also had to be replaced due to the major damage, thus explained the higher content damage value.
Fig. 4 - Scatter plot of actual structural and content damage for residential properties versus flood depth
Fig. 5 - Scatter plot of actual structural and content damage for residential properties versus flood duration
4.
Conclusions
In general, the average residential structural damage during the 2013 Kuantan flood was between RM816 to RM2564 according to the types of construction materials. While the content damage is higher which is in the range RM3667 to RM4373. Flood damage function model were developed according to the interview survey data. The model considered the effects of socio-economic and property characteristics variables to the level of flood damages as this relationship is rarely investigated. In fact, other variables instead of hydrological factors should also be considered to obtain an extensive description of flood damages. From this study, the structural damage was found to be depended mostly on the age and the household income variables, while the educational background and occupation variables influenced the content damage value. All the socio-economic variables i.e. age, household income, educational background, and occupation have a positive relationship with the flood damage. In contrast, both structural and content damage show a significant negative relationship with the distance from river variable. In terms of the flood damage function curve, the residential flood damage was best explained by flood and flood depth as the flood duration data seems inconsistent. However, due to scatter data, a smoothing method is suggested.
Acknowledgements
The authors are grateful to Universiti Malaysia Pahang for the support and encouragement through research grant RDU1703115.
References
[1] Diakakis, M., Deligiannakis G., Katsetsiadou K., Antoniadis Z. and Melaki M. (2017). Mapping and classification of direct flood impacts in the complex conditions of an urban environment. The case study of the 2014 flood in Athens, Greece. Urban Water Journal, 14, 1065-1074.
[2] De Moel H., Van Alphe, J. and Aerts J. C. J. H. (2009). Food maps in Europe – methods, availability and use. Natural Hazards and Earth System Sciences, 9, 289-301.
[3] Apel H., Merz B. and Thieken A. H. (2008). Quantification of uncertainties in food risk assessments. International Journal of River Basin Management, 6, 149–162.
[4] Hudson P., Botzen W. J. W., Kreibich H., Bubeck P. and Aerts, J. C. J. H. (2014). Evaluating the effectiveness of flood damage mitigation measures by the application of propensity score matching. Natural Hazards and Earth System Sciences Discussions, 2, 1731–1747.
[5] Romali N. S., Yusop Z., Sulaiman M. and Ismail Z. (2018). Flood risk assessment: A review of flood damage estimation model for Malaysia. Jurnal Teknologi, 80, 145-153.
[6] De Moel H., Bouwer L. M., and Aerts J. C. J. H. (2014). Uncertainty and sensitivity of flood risk calculations for a dike ring in the south of the Netherlands. Science of the Total Environment, 473–474, 224–234.
[7] Eleuterio J. (2012). Flood risk analysis: impact of uncertainty in hazard modelling and vulnerability assessments. PhD Thesis, (France: University of Strasbourg).
[8] Dutta D., Herath S., and Musiake K. (2000). Flood inundation simulation in a river basin using a physically based distributed hydrologic model. Hydrological Process, 14, 497-519.
[9] Kazama S., Sato A., and Kawagoe S. (2009). Evaluating the cost of flood damage based on changes in extreme rainfall in Japan. Sustainable Science, 4, 61-69.
[10] Yi C., Lee J., and Shim M. (2010). GIS-based Distributed Technique for assessing economic loss from flood damage: pre-feasibility study for the Anyang Stream Basin in Korea. Natural Hazards, 55, 251–272.
[11] Velasco M., Cabello À., and Russo B. (2015). Flood damage assessment in urban areas. Application to the Raval District of Barcelona using synthetic depth damage curves. Urban Water Journal, 1-14.
[12] De Moel H. and Aerts J. C. J. H. (2011). Effect of uncertainty in land use, damage models and inundation depth on flood damage estimates. Natural Hazards, 58, 407–425.
[13] Gain A. K., Mojtahed V., Biscaro C., Balbi S. and Giupponi C. (2015). An Integrated Approach of Flood Risk Assessment in the Eastern Part of Dhaka City. Natural Hazards, 79, 1499–1530.
[14] Oliver E. and Santoro M. (2000). Estimation of urban structural flood damages: The case study of Palermo. Urban Water 2, 2, 223–234.
[15] Lekuthai A. and Vongvisessomjai S. (2001). Intangible flood damage quantification. Water Resources Management, 15, 343–362.
[16] Kazama S., Sato A. and Kawagoe S. (2009). Evaluating the cost of flood damage based on changes in extreme rainfall in Japan. Sustainable Science, 4, 61-69.
[17] Luino F., Cirio C. G., Biddoccu M., Agangi A., Giulietto W., Godone F. and Nigrelli G. (2009). Application of a model to the evaluation of flood damage. GeoInformatica, 13, 339–353.
[18] Qi H. and Altinakar M. S. (2011). Simulation-based decision support system for flood sensing and census block information. Natural Hazards, 59, 1125–1143.
[19] Vozinaki A. E. K., Karatzas G. P., Sibetheros I. A., and Varouchakis E. A. (2015). An Agricultural flash flood loss estimation methodology: The case study of the Koiliaris Basin (Greece), February 2003 Flood. Natural Hazards, 79, 889-920.
[20] Budiyono Y., Aerts J. C. J. H. and Ward P. J. (2015). Flood risk assessment for delta mega-cities: A case study of Jakarta. Natural Hazards, 75, 389-413.
[21] Chen A. S., Hammond M. J., Djordjevic S., Butler D., Khan D. M. and Veerbeek W. (2016). From hazard to impact: Flood damage assessment tools for mega cities. Natural Hazards, 82, 857-890.
[22] Kefi M., Mishra B. K. and Kumar, P. (2018). Assessment of tangible direct flood damage using a spatial analysis approach under the effects of climate change: Case Study in an urban watershed in Hanoi, Vietnam. International Journal of Geo-Information, 7, 1-18.
[23] Win S., Zin W. W., Kawasaki A. and San Z. M. L. T. (2018). Establishment of flood damage function models: A case study in the Bago River Basin, Myanmar. International Journal of Disaster Risk Reduction, 28, 688-700. [24] Merz B., Kreibich H., Schwarze R. and Thieken, A. (2010). Assessment of economic flood damage. Natural Hazards
and Earth System Science, 10, 1697–1724.
[25] KTA Tenaga Sdn. Bhd. (2003). Flood damage assessment of 26 April 2001 flooding affecting the Klang Valley and the preparation of generalised procedures and guidelines for assessment of flood damages (Final Report). (Malaysia: Drainage and Irrigation Department, Malaysia).
[27] Suriya S., Mudgal B. V. and Nelliyat P. (2012). Flood damage assessment of an urban area in Chennai, India, Part I: Methodology. Natural Hazards, 62, 149–167.
[28] Okazumi, T. (2014). Uncertainty estimation and reduction measures in the process of flood risk assessment with limited information. Master Thesis, (Japan: Kyoto University).
[29] Tam T. H., Ibrahim A. L., Rahman M. Z. A and Mazura Z. (2014). Flood loss assessment in the Kota Tinggi. IOP Conference Series: Earth and Environmental Science, 18, 12120.
[30] Muhadi N. A. and Abdullah A. F. (2015). Flood damage assessment in agricultural area in Selangor River Basin. Jurnal Teknologi (Science and Engineering), 15, (2015), 111–117.
[31] Ng Z. F., Gisen J. I. and Akbari A. (2018). Flood inundation modelling in the Kuantan River Basin using 1D-2D flood modeler coupled with ASTER-GDEM. IOP Conference Series: Materials Science and Engineering, 318, 012024.
[32] Zaidi S. M., Akbari A. and Ishak W. M. F. (2014). A critical review of floods history in Kuantan River Basin: Challenges and potential solutions. International Journal of Civil Engineering and Geo-Environment, 5.
[33] Jaharudin P., Anang Z., Mat Alipiah R., Kamaludin M., Abd. Aziz A. and Saat S. A. (2015). Flooding lossess and socio-economic damage in Kelantan. Proceedings of the 3rd International Conference on Water Resources (ICWR
2015), (Bayview Hotel, Langkawi, Kedah, Malaysia).
[34] Panic M., KovacevicMajkic J., Miljanovic D. and Miletic R. (2013). Importance of natural disaster education – case study of the earthquake near the city of Kraljevo: First results. Journal of the Geographical Institute Jovan Cvijic, 63 (1), 75-78.
[35] Morrissey M. (2007). Curriculum innovation for natural disaster reduction: lessons from the Commonwealth Caribbean. International Perfectives on Natural Disasters: Occurrence, Mitigation, and Consequences. Advances in Natural and Technological Hazards Research, 21, 385-396.
[36] Smith D. I. (1994). Flood damage estimation – A review of urban stage-damage curves and loss functions. Water SA, 20, 145-180.