INTERNATIONAL JOURNAL OF INTEGRATED ENGINEERING VOL.11NO.8(2019)221-228
© Universiti Tun Hussein Onn Malaysia Publisher’s Office
IJIE
Journal homepage: http://penerbit.uthm.edu.my/ojs/index.php/ijie
The International
Journal of
Integrated
Engineering
ISSN : 2229-838X e-ISSN : 2600-7916
*Corresponding author: [email protected] 2019 UTHM Publisher. All right reserved.
penerbit.uthm.edu.my/ojs/index.php/ijie
221
Identification of Source Contributions to Air Pollution in
Penang Using Factor Analysis
Mohd Shahiran Jamil
1, Ahmad Zia Ul-Saufie
2,*,Amalina Amirah Abu Bakar
1,
Khairul Ammar Muhammad Ali
1, Hasfazilah Ahmat
31Faculty of Civil Engineering,
Universiti Teknologi MARA, 13500 Permatang Pauh, Pulau Pinang, MALAYSIA
2Faculty of Computer and Mathematical Sciences,
Universiti Teknologi MARA, 13500 Permatang Pauh, Pulang Pinang, MALAYSIA
3Faculty of Computer and Mathematical Sciences,
Universiti Teknologi MARA, 40450 Shah Alam, Selangor, MALAYSIA *Corresponding Author
DOI: https://doi.org/10.30880/ijie.2019.11.08.022
Received 31 March 2018; Accepted 20 May 2019; Available online 15 December 2019
1. Introduction
Clean air is essential to all humans, animals and other living creatures as it is needed for their well-being and health. Ling [1] found that the urban air is more contaminated than the less developed and rural areas due to large number of populations and their activities that elevate the level of air pollution concentrations. Today, Malaysia is one of the rapid growing countries and its target to be the industrial nation status in 2020 influences the rapid development in industrial activities and the increasing number of vehicles [2]. These activities lead to an unstable environment and uncomfortable surrounding in some areas as a result of air pollution. According to the Malaysian Department of Environment, (DOE) [3], Malaysia has its own determination system of air quality, monitored at 65 stations in Peninsular Malaysia, Sabah and Sarawak. These stations are used to provide data about the current status and air quality conditions in a particular area. Air quality status is determined using the Air Pollution Index (API) and it is
Abstract: Penang is one of the rapidly developed states in Malaysia with large numbers of population industrial activities, motor vehicles density and development projects. The concentrations of air pollution parameters in Penang were investigated and analyzed together with meteorological parameters in order to determine their characteristics and contributions to air pollution in Penang using factor analysis (FA). The air pollution parameters include ground level ozone (O3), carbon monoxide (CO), nitrogen dioxide (NO2), sulphur dioxide (SO2) and
particulate matters of less than 10 microns in size (PM10) while the meteorological parameters include relative
humidity, wind speed and temperature. The data was obtained from the Department of Environment (DOE) for the Universiti Sains Malaysia (USM) monitoring station for the period of 10 years from 2004 to 2013. In this study, concentrations of PM10 was found to be the highest among the air pollutants and the concentrations was at its
highest between the months of June to September for almost all years of observation due to the southwest monsoon. As for the source contributions of air pollutions, O3 and meteorological parameters were found to be the
largest contributor to air pollutions in Penang, followed by the traffic emissions and industrial activities.
measured based on concentrations of five major pollutants namely ground level ozone (O3), carbon monoxide (CO),
nitrogen dioxide (NO2), sulphur dioxide (SO2) and particulate matter of less than 10 microns in size (PM10).
1.1
Air Pollution in Malaysia
In recent years, the Malaysia’s air quality has been highly influenced by the incidents of dense haze periods due to the biomass burning and the seasonal southwest (SW) monsoon from June to September each year that blows high amounts of particulate matter from one place to another [4]. On the other hand, during the non-haze periods, the sources of problem that contribute to the air pollution are more subjective because they cannot be seen by naked eyes compared to the haze period that can shorten sight distance. In order to solve the problem, the elements of air pollutants need to be analyzed using the data acquired from the monitoring network and the surrounding area to identify the sources either from industries, development activities, motor vehicles, power generation, land clearing or open burning.
1.2
Significance of Study
Infrastructure includes three important elements; economic, environmental and social impact. Poor air quality affects the health of people. The negative effect must be reduced in order to have a better quality of life and good environment especially in public area. The aim of this study to examine the characteristics of air pollution in Penang, to determine the relationship between air pollutant and meteorological parameters and to determine the source contributions of air pollution in Penang using Factor analysis (FA). When the sources contribute to air pollution in Penang are known, a good preventive measure can be proposed to the responsible parties and this can help sustain the environment in Penang.
2. Methodology
This study focused to determine the characteristics of air pollution in Penang Island for 10 years for a period 2004 to 2013. The data of air pollution parameters including CO, O3, NO2, SO2 and PM10 was obtained from the DOE for
the Univesiti Sains Malaysia (USM) main campus in Gelugor, Penang monitoring station. The data was analyzed together with meteorological parameters such as relative humidity, temperature, wind speed and wind direction to study its relationship by considering the possible contributing factors in surrounding area such as development projects, industrial activities and vehicles combustion by using Factor analysis (FA).
2.1
Site Selection
Penang is one of the major towns in Malaysia located in the northern part of Peninsular Malaysia. The island area of Penang covers about 285 km2 and is highly densed with 1,490 people per square kilometer and with a total of 1,596,900 populations in 2010 [5]. As shown in Fig. 1, there are three air quality monitoring stations in Penang which are located in Seberang Jaya and Prai on the mainland and USM on the island part. For this study, USM was selected because of the nearest area to the island with high populated areas, high traffic activities, near to port, high development and high industrial activities at the selected areas. Besides, Penang Island has many infrastructure identities that are related with this study.
Fig. 1 - The air quality monitoring stations in Peninsula Malaysia [7].
Jamil et al., Int. J. of Integrated Engineering Vol. 11 No. 8 (2019) p. 221-228
223
2.2
Descriptive Statistic
In this study, descriptive statistics were used to extract the basic statistical descriptions of air monitoring record. Eight important characteristics were determined such as mean, median, standard deviation, variance, skewness, kurtosis, minimum and maximum values. This gives three groups of detailed information such as central tendency measure (mean, mode and median), dispersion measures (standard deviation and variance), and shape measure (skewness and kurtosis).
2.3
Box and Whisker Plot
Box plot is a graphical statistical data that contains rectangular lines representing second and third quartiles. Vertical line represents median data while the sides of the rectangle represents lower quartile (LQ) and upper quartile (UQ). Box plot is important to identify outliers and extreme values where the monitoring record exceeds the whisker [6]. To be considered as an outlier, a monitoring record should be above UQ + 1.5IQR or below LQ – 1.5IQR, where UQ is upper quartile, IQR is inter quartile range and LQ is lower quartile [6].
2.4
Correlation
Correlation is a statistical method to determine the relationship or association between two variables. The strength of the linear relationship is represented by the correlation coefficient and the coefficient ranges between -1 to +1. When the coefficient value is near -1 or +1, it shows that there are strong relationships between the variables and if the coefficient value is near 0, it means that the relationship is weak. Equation (1) below is the correlation coefficient formula, which is represented by r.
(
) ( )(
)
(
2)
( )
2(
2)
(
)
2n xy x y
r
n x x n y y
− = − −
(1)2.5
Factor analysis (FA)
Factor analysis (FA) is used to reduce the number of independent variables. These variables were explained in terms of factors. According to [8]. FA will give a new uncorrelated ordered variable set that is called as principal component (PCs). In the first stage, the FA development is based on the total monitoring records. In the second stage, the air monitoring data sufficiency was assessed using Kaiser-Meyer Olkin (KMO). KMO formula is given by
2
2 2
ij
i j
ij ij
i j i j
r KMO r a = +
(2)where rij is the simple correlation coefficient and aij is the partial correlation coefficient between i and j. FA is only suitable to be used when the KMO value is at least 0.5[9]. In the third stage, Barlett’s Test of Sphericity is used and in order to continue using FA, the significant value must be less than 0.05. The test is expressed in equation below:
( )
2 2
1 1
2( ) 7 2 / ( )
ln ln 6 p k j k j
j j k
p k p k
x n k p k
= = + − + + − = − − + − − + −
(3) and 1 p jj k p k
= + = −
(4)where n is the number of observations, p is the number of components and λj represents the eigenvalue for kjth
component.
3.
Results and Discussion
3.1
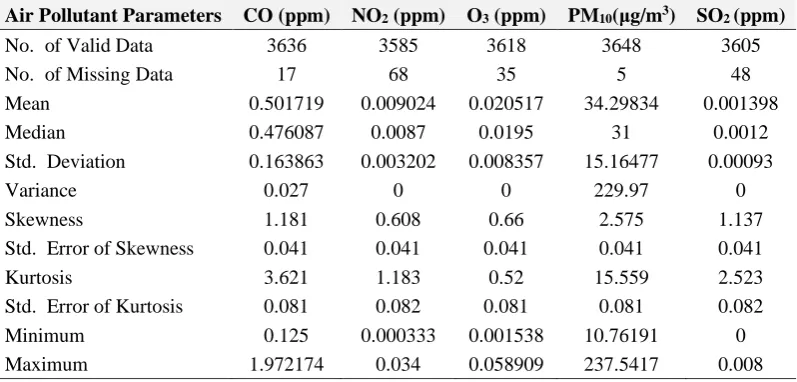
Air Pollutants Characteristics
data, and the analyzed data such as Mean, Median, Standard Deviation, Variance, Skewness, Standard Error of Skewness, Kurtosis, Standard Error of Kurtosis, Minimum and Maximum data.
As listed in Table 1 below, the parameter that has the highest valid data is PM10 with 3648 valid data and only five
(5) missing data followed by CO with 3636 valid data and 17 missing data, O3 with 3618 valid data and 35 missing
data, SO2 with 3605 valid data and 48 missing data and lastly NO2 with 3585 valid data and 68 missing data. Valid
data indicates that the daily data is was available for the parameters while missing data indicates that the data is not available due to an error in reading or maintenance work of the air monitoring equipment.
The mean values for all the five parameters show that the average concentration of air pollutants in Penang for 10 years for a period of 2004 to 2013 were all below the Malaysia Ambient Air Quality Guidelines (MAAQG). The mean values for CO, NO2, O3, PM10 and SO2 are 0.501719 ppm, 0.009024 ppm, 0.020517 ppm, 34.29834 μg/m3, and
0.001398 ppm respectively while the controlling MAAQG values for CO, NO2, O3, PM10 and SO2 are 9.0 ppm (for 8
hour average reading), 0.04 ppm (for 24 hour average reading), 0.06 ppm (for 8 hour average reading), 50 μg/m3 (for 12 hour average reading) and 0.004 ppm (for 24 hour average reading) respectively.
Skewness for all air pollutant values shows positive values. This indicates the existence of extreme events. The highest positive skewness value is represented by PM10 (2.575), followed by CO (1.181), SO2 (1.137), O3 (0.66) and
NO2 (0.608).
Table 1 Air pollutants descriptive statistics.
Air Pollutant Parameters CO (ppm) NO2 (ppm) O3 (ppm) PM10(μg/m3) SO2 (ppm)
No. of Valid Data 3636 3585 3618 3648 3605 No. of Missing Data 17 68 35 5 48 Mean 0.501719 0.009024 0.020517 34.29834 0.001398 Median 0.476087 0.0087 0.0195 31 0.0012 Std. Deviation 0.163863 0.003202 0.008357 15.16477 0.00093 Variance 0.027 0 0 229.97 0 Skewness 1.181 0.608 0.66 2.575 1.137 Std. Error of Skewness 0.041 0.041 0.041 0.041 0.041 Kurtosis 3.621 1.183 0.52 15.559 2.523 Std. Error of Kurtosis 0.081 0.082 0.081 0.081 0.082 Minimum 0.125 0.000333 0.001538 10.76191 0 Maximum 1.972174 0.034 0.058909 237.5417 0.008
3.2
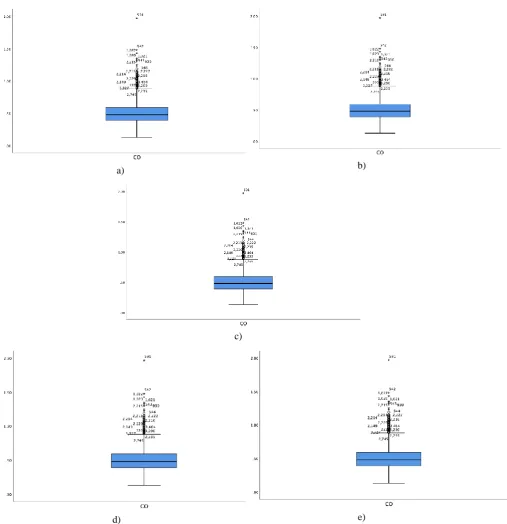
Box Plot
The Box Plot is a simple graphical display to ease data comparison [10]. For this analysis, it is applied for air pollutant parameters only. The box plot results show that every parameter have extreme values. The highest extreme value indicates the maximum daily reading in 10 years for each parameter. The box plot for each of air pollutants are shown in Fig. 2.
For carbon monoxide (CO), the highest extreme value was at 591. Number 591 of the data represents the daily CO reading of August 13th, 2005 with concentration of 1.972 ppm. During this period, reference [11] reported that the trend of unhealthy or hazardous days increased in the middle of August in 2005 due to the dense haze period. This haze episode was is believed to be the factor of the highest reading of CO value in USM, Penang for a period 2004 to 2013.
As for NO2 the highest extreme value recorded was at 3417 of the data. It represents the daily NO2 data on May
5th, 2013 with concentration of 0.034 ppm. Next, the second highest was at 652 of the data which is represents the daily NO2 data on October 13th, 2005 with 0.0255 ppm of concentration.
The PM10 data consist of many outliers compared to other pollutants. This indicates that the PM10 concentration
were high in many days compared to other pollutants. From Figure 2, the highest extreme value recorded was at 591 of the data, which was represents, the daily PM10 data on August 13th, 2005 with concentration of 237.54 µg/m3.
Reference [11] mentioned that the air quality in the middle of August 2005 was unhealthy or hazardous due to the dense haze period that was believed to be the main factor of the highest recorded PM10 value in 10 years.
For SO2, the highest extreme value recorded was at 3288. It represents the daily SO2 data on December 31st, 2012
with concentration of 0.008 ppm. Next, the second and third highest was at 3148 and 3465 of the data which represents the daily SO2 data on August 13th, 2012 and June 16th, 2013 with 0.0069 ppm and 0.0065 ppm of concentration
Jamil et al., Int. J. of Integrated Engineering Vol. 11 No. 8 (2019) p. 221-228
225
a) b)
c)
d) e)
Fig. 2 - Box Plot for air pollutants concentrations, a) CO b) NO2 c) 03, d) PM10, and e) SO2.
3.3
Correlation between Air Pollutants and Meteorological Parameters
Correlation is to measure the relationship between two variables. The coefficient value of the correlation can vary from negative one to positive one. A negative one represents a perfect negative correlation meanwhile a positive one represents a perfect positive correlation. If the coefficient of the correlation is zero, its mean there is no relationship between the two variables.
As summarized in Table 2, it was found that RH was negatively correlated with all other parameters such as T, WS, CO, NO2, O3, PM10 and SO2. The results show that when the coefficient value for relative humidity increases, the
Next, when the coefficient value for temperature increases, all other air pollutants will also increase such as CO (0.005), NO2 (0.011), O3 (0.443) and SO2 (0.321) except SO2 with small negative coefficient value of -0.004.
Moreover, O3 shows the highest positive value at 0.443.
For wind speed, this shows that the wind speed is positive correlated with O3 as well as PM10 compared to other
pollutant such as CO, NO2 and SO2 that has negative correlation with -0.157, -0.161 and -0.049 respectively. Table 2 - Pearson correlation matrix of different variables.
RH T WS CO NO2 O3 PM10 SO2
RH 1 -0.703 -0.43 -0.003 -0.036 -0.543 -0.298 -0.010 T 1 0.249 0.005 0.011 0.443 0.321 -0.004 WS 1 -0.157 -0.161 0.433 0.111 -0.049 CO 1 0.508 0.141 0.454 0.184 NO2 1 0.172 0.4 0.204
O3 1 0.566 0.068
PM10 1 0.136
SO2 1
3.4
Source Contributions to Air Pollution by using Factor analysis (FA)
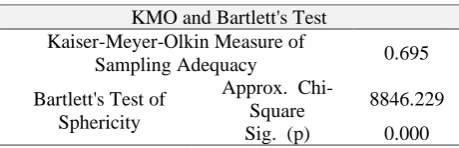
FA is used to reduce the number of independent variables such as air pollutants and meteorological parameters. To know whether FA can be conducted, the data sufficiency was assessed for factor analysis using the Kaiser-Meyer-Olkin Measure (KMO) and Barlett’s Test of Sphericity and the results are shown in Table 3. The results for KMO test and Barlett’s Test of Sphericity are 0.695 which is greater than 0.5 (KMO > 0.5) and 0.00 which is lower than 0.05 (p < 0.05) respectively. This shows that the data is adequate to be analyzed using factor analysis [9]. There are eight linear components including CO, NO2, O3, PM10, SO2, RH, T, and WS that were identified before we were able to extract
using FA.
Table 3 -KMO and Barlett’s test. KMO and Bartlett's Test Kaiser-Meyer-Olkin Measure of
Sampling Adequacy 0.695 Bartlett's Test of
Sphericity
Approx.
Chi-Square 8846.229 Sig. (p) 0.000
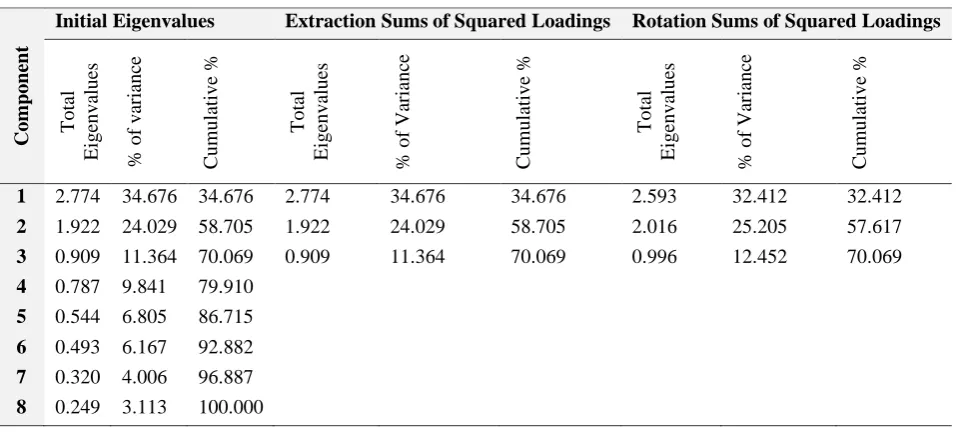
Table 4 demonstrates the results after the extraction was done. Two factors were found to have eigenvalue of more than 1. The first factor is 2.774 and the second factor is 1.922. However, the third factor with 0.909 eigenvalue was also considered because the eigenvalue was close to 1. After extraction and rotation, the total cumulative variance for the three principal components was 70.069%, where 32.412% are influenced by the first component, 25.205% are influenced by the second component and 12.452% are influenced by the last component.
From the results of Rotated Component Matrix in Table 5, the components can be classified into three groups of factors. The highest contribution is in the first group (FA1) that consists of O3 (0.773), RH (-0.861), T (0.775) and WS
(0.667). The second highest contribution is in the second group (FA2) that consists of CO, NO2 and PM10 meanwhile
the third group (FA3) with the third highest contribution consists of SO2 only.
All these three groups represent the three main source contributions of air pollution in Penang that are classified based on their possible source contributions from the nearest areas that are emitted and transported into the surrounding air. A site studyhas been carried out to locate the nearest possible air pollution activities such as traffic and industrial in a 5km radius from the center point of the air monitoring station.
From Fig. 3, FA1 can be classified as the main factor that is contributed by O3 and meteorological parameters (RH,
T, WS). This is a reliable result because O3 requires meteorological parameters with presence of sunlight to react [12].
According to [13], urban areas recorded higher levels of ozone due to higher traffic volume and a suitable atmospheric condition resulting in ozone formation. It also reacts from the ozone precursors Nitrogen Oxide (NOx) and volatile
Jamil et al., Int. J. of Integrated Engineering Vol. 11 No. 8 (2019) p. 221-228
227
Table 4 - Total variance explained.
Com
p
on
en
t
Initial Eigenvalues Extraction Sums of Squared Loadings Rotation Sums of Squared Loadings
T otal E igenva lues % of va rianc e C umul ati ve % T otal E igenva lues % of Va rianc e C umul ati ve % T otal E igenva lues % of Va rianc e C umul ati ve %
1 2.774 34.676 34.676 2.774 34.676 34.676 2.593 32.412 32.412
2 1.922 24.029 58.705 1.922 24.029 58.705 2.016 25.205 57.617
3 0.909 11.364 70.069 0.909 11.364 70.069 0.996 12.452 70.069
4 0.787 9.841 79.910
5 0.544 6.805 86.715
6 0.493 6.167 92.882
7 0.320 4.006 96.887
8 0.249 3.113 100.000
Table 5 - Rotated component matrix.
FA1 FA2 FA3 RH -0.861
T 0.775 O3 0.773
WS 0.667
CO 0.829 NO2 0.798
PM10 0.708
SO2 0.985
RH T WS CO NO2 O3 PM10 SO2
Fig. 3 - Summary of factor analysis.
For FA2, it can be classified as the second highest source contributions of air pollution in Penang that consists of CO, NO2 and PM10 and these pollutants are emitted from high traffic volume.
According to the Road Transport Department of Malaysia, in 2013, the total number of registered motor vehicles in Penang increased by 18.42% from 1,897,752 in 2008 to 2,326,216 in 2012. This shows the rapid increased in the number of vehicles in Penang as one of the sources of air pollution in Penang.
The only influence of the last FA3 is SO2 which is from the industrial activities in Penang. According to [13] total
average of SO2 concentration was reduced in 2014 and this was attributed by the use of better fuel quality (EURO-2M)
in this country starting from September 2009. This is one of the factors why the contribution from the industrial activities in Penang to air pollution is smaller compared to traffic emissions. In addition, most of the industrial companies in 5km radius from the monitoring station do not emit waste products into air.
4. Conclusion
Based on the research conducted, the concentration trends of air pollutants from 2004 to 2013 were almost in the range of good to moderate air quality in Penang. However, the trends for O3 were quite different since different
patterns observed each year but it was still below the MAAQG limit for the 10 years of study. For PM10, the trends FA
O3 + (RH+ RH+ WS)
CO + NO2 + PM10
SO2
Ozone + Meteorological Parameters
were almost the same each year with the highest concentration detected between the months of June to September due to the seasonal southwest monsoon. This was believed to be due to the seasonal southwest monsoon. From the correlation results, the meteorological parameters play an important role to influence the concentration of air pollutant, for instance, when relative humidity is high such as during the rainy season, the air pollutant decreases in concentration and vice versa. The FA results shows that there are three groups of factors that can be classified. The first group with highest factors are O3, RH, T and WS, followed by the second group of CO, NO2 and PM10 and only SO2 for the last
group. As for the source contributions of air pollutions, O3 and meteorological parameters were found to be the largest
contributor to air pollutions in Penang, followed by the traffic emissions and industrial activities
Acknowledgement
Authors would also like to extend our appreciation to the Department of Environmental Malaysia (DoE) for providing the air quality data for this research. This research was funded by 600-IRMI/FRGS 5/3 (289/2019).
References
[1] Ling, O. S. (2012). Urban air environmental health indicators for Kuala Lumpur City. Sains Malaysia, 179-191. [2] Afroz, R., Hassan, M. N., & Ibrahim, N. A. (2003). Review of air pollution and health impacts in Malaysia.
Environmental Research, 92, 71–77.
[3] Department of Environment, DOE (2017). Environmental Quality Report 2016, pp 20-60.
[4] Wan Mahiyuddin, W. R., Sahani, M., Aripin, R., Latif, M. T., Thach, T. Q., & Wong, C. M. (2013). Short-term effects of daily air pollution on mortality. Atmospheric Environment, 65, 69–79.
[5] Ul-Saufie, A. Z., Yahaya, A. S., Ramli, N. A., & Hamid, H. A. (2012). Robust Regression Models for Predicting PM10 Concentration in an Industrial Area. International Journal of Engineering and Technology, 2(3), 364–370.
[6] Lem, S., Onghena, P., Verschaffel, L., & Van Dooren, W. (2013). The heuristic interpretation of box plots. Learning and Instruction, 26, 22–35.
[7] Department of Environment, DOE (2013). Environmental Quality Report 2013.
[8] Lam, S. H. M., Saunders, S. M., Guo, H., Ling, Z. H., Jiang, F., Wang, X. M., & Wang, T. J. (2013). Modelling VOC source impacts on high ozone episode days observed at a mountain summit in Hong Kong under the influence of mountain-valley breezes. Atmospheric Environment, 81, 166–176.
[9] Kaiser, F.G., (1974). System Analysis by Digital Computer. Wiley, New York
[10] Ramli, N.A., Ghazali, N.A., Yahaya, A.S. (2010). Diurnal fluctuations of ozone concentrations and its precursors and prediction of ozone using multiple linear regressions. Malaysian Journal of Environmental Management 11 (2), 57-69
[11] Ling, O., Ting, K., Shaharuddin, A., Kadaruddin, A., Yaakob, M. (2010). Urban growth and air quality in Kuala Lumpur city, Malaysia. Environment Asia 3, 123-128.
[12] Lam, J. C., Wan, K. K. W., Wong, S. L., & Lam, T. N. T. (2010). Principal component analysis and long-term building energy simulation correlation. Energy Conversion and Management, 51(1), 135–139.
![Fig. 1 - The air quality monitoring stations in Peninsula Malaysia [7].](https://thumb-us.123doks.com/thumbv2/123dok_us/8434119.1698851/2.595.181.411.549.746/fig-air-quality-monitoring-stations-peninsula-malaysia.webp)