Rotation of Interchange Instability in the Large Helical Device
Yuki TAKEMURA, Satoru SAKAKIBARA
1), Kiyomasa WATANABE
1), Katsuji ICHIGUCHI
1),
Katsumi IDA
1), Yasuhiro SUZUKI
1), Satoshi OHDACHI
1), Yoshiro NARUSHIMA
1),
Ichihiro YAMADA
1), Kenji TANAKA
1), Hiroshi YAMADA
1)and LHD Experiment Group
1) The Graduate University for Advanced Studies, Gifu 509-5292, Japan1)National Institute for Fusion Science, Gifu 509-5292, Japan
(Received 5 March 2013/Accepted 17 June 2013)
The rotation of resistive interchange instabilities excited in the periphery of plasmas compared to plasma flows under various plasma conditions in the Large Helical Device. The observed magnetohydrodynamic modes exhibit nominal rotation in the electron diamagnetic direction in the laboratory frame. We assumed that the ion (electron) flows consist of the E×B and ion (electron) diamagnetic drift flows. These drift flows were individually evaluated and geometrically compensated using a finite beta equilibrium. Experiments with different neutral beam injection conditions and different electron densities show that the frequencies of the observed modes were quantitatively consistent with those of the electron flow.
c
2013 The Japan Society of Plasma Science and Nuclear Fusion Research
Keywords: interchange instability, helical plasma, mode frequency, plasma flow, heliotron DOI: 10.1585/pfr.8.1402123
1. Introduction
Plasma rotation is a key parameter for not only the improvement of plasma confinement but also stabiliza-tion/destabilization of magnetohydrodynamic (MHD) in-stabilities. In tokamaks and reversed field pinches, tear-ing modes lead to major disruption after their rotation is stopped by the penetration of radial magnetic fluctuations to the vacuum wall [1]. In the classical tearing mode ob-served in ohmic plasmas, the rotation slows and is stopped when the electron density is lower than a threshold. It is also believed that the existence of an error field is one of the reasons for mode locking. An empirical scale has been constructed for estimating the tolerance of ITER and inves-tigating the physical mechanism [2]. In high-beta plasmas, the resistive wall mode grows and terminates the plasma when the rotation is suppressed [3]. The mode can be stabi-lized by maintaining the rotation, which is reastabi-lized by ap-plying a toroidal momentum to the plasma externally [4].
The determinative factor of the mode frequency has been theoretically and experimentally investigated mainly in tokamaks. Because the rotation of the magnetic island produced by the tearing mode or others is a key parameter for stabilization effects due to an ion polarization current, the physical mechanism has been theoretically investigated using two fluid models [5].
Although mode rotation has been experimentally stud-ied by comparing the plasma flows in several tokamaks [6, 7], it remains unclear. The rotation of the neoclassi-cal tearing mode (NTM) was investigated recently in JT-60U [8]. According to that study, the mode frequency in-creased linearly with the toroidal ion flow driven by neutral author’s e-mail: [email protected]
beam (NB) injection, whereas a gap appears between the mode rotation and toroidal flow. One possibility is that this is due to a poloidal flow such as a diamagnetic flow. Thus, a quantitative comparison of the observed frequency and plasma flow is required to understand the mode rotation mechanism.
An interchange mode, which is an important instabil-ity in helical plasmas, has long been experimentally and theoretically investigated to understand its characteristics and effect on plasma confinement [9]. However, experi-mental and theoretical knowledge of the rotation of the interchange mode is still insufficient. Experiments have shown that a large-amplitude mode causes significant mi-nor collapse in the ideal unstable regime [10]. In partic-ular, them/n = 1/1 mode rotation started to slow when the plasma entered the ideal unstable regime because of an increase in the plasma current and the mode rapidly grew after the rotation stopped [11]. Heremandnare the poloidal and toroidal mode numbers, respectively. This is phenomenologically similar to the tearing locked mode, al-though the radial structure of the observed mode has a peak around the resonance, and the phase difference on the peak is almost the same, which suggests the characteristics of the interchange mode. Experimental study of the mode fre-quency in helical devices as well as tokamaks is important for future consider the stability control in the future.
This study describes the results of a comparison be-tween the rotation of the interchange mode and plasma flow in the Large Helical Device (LHD) under various plasma conditions. Two types of experiments were per-formed to obtain different plasma flows. In one exper-iment, NBs were injected from different directions to
c
2013 The Japan Society of Plasma
change the toroidal flow. In the other experiment, the elec-tron density was scanned because the formation of the ra-dial electric field depends on the electron density [12]. We focus on the mode excited in the periphery of the plasma because the peripheral modes are dominantly observed in a wide beta range, and they are key instabilities in the high-beta state in heliotron configurations [9]. Previous studies have identified them as resistive interchange modes [13]. In Sec. 2, the LHD and measurement systems are intro-duced, and the technique for geometrical compensation of the flow is provided in Sec. 3. Here we estimate the “global” plasma flow by compensating for the geometrical effects. The experimental results are given in Sec. 4. The discussion and summary are presented in the final section.
2. Experimental Setup
The LHD has a heliotron configuration with a pair of helical coils and three pairs of poloidal coils. The major and minor radii are 3.9 m and 0.65 m, respectively. The magnetic axisRaxcan be changed from 3.5 to 4.1 m. The available toroidal field at Rax, Btax, is less than 3 T. In the experiments described here,Rax is set to 3.6 m and a plasma aspect ratio Ap of 6.3 was selected. In this con-figuration, the central and edge rotational transforms in vacuum are 0.5 and 1.5, respectively. In the experiments, the volume-averaged beta value evaluated by the diamag-netic flux measurements,βdia, was 1% - 1.5%. Although the rotational transform is spontaneously changed by finite beta effects, the profile is not significantly changed in this beta regime with a weak plasma current. The profile is predicted by the equilibrium mapping technique [14]. The LHD is equipped with three tangential and two perpendic-ular NBs. The tangential NBs were applied for production and maintenance of the plasma, whereas one perpendicu-lar NB was used for measurement by charge exchange re-combination spectroscopy (CXRS). Because two NBs are injected in the same direction and one is in opposite di-rection, we can change the dominant direction of the NBs by changing the polarity ofBtax. At negativeBtax, two co-NBs and a counter NB are available, and counterdominant operation is realized in the positiveBtaxconfiguration. In experiments with different toroidal flows, both polarities of
Btaxwere applied to change the direction of the NBs, and a negativeBtaxwas set for the density scan experiments.
The magnetic fluctuations were measured with 21 magnetic probes, and the mode number was identified by a helical array with 15 probes and a toroidal array with 6 probes [15]. The radial profiles of the toroidal and poloidal carbon flows and ion temperature were measured by CXRS. The measured flows were used only for es-timating the profiles of the radial electric field at a cer-tain poloidal cross section through the momentum balance equation. The electric and magnetic fields at specific posi-tions were estimated using the finite beta equilibrium es-timated by the 3D MHD equilibrium code VMEC [16],
assuming a constant electric potential on each magnetic surface. The validity of this assumption was investigated in Ref. [17]. The electron temperature and density pro-files were measured and the electron diamagnetic drift fre-quency was estimated using a Thomson scattering system. The techniques mentioned above are described in the next section.
3. Compensation of Geometrical
Ef-fects
Here a technique for estimating the E×Band elec-tron (ion) diamagnetic flows at an arbitrary position is de-scribed. First, the profile of the radial electric field is es-timated using the measured carbon flow and momentum balance equation,
Er = 1
Zcenc dPc
dr −(−vpcBt+vtcBp), (1)
whereEr is the radial electric field on the midplane of the poloidal cross section where CXRS is applied, andZcand
ncare the number of charges and density of the carbon, re-spectively. Pc is the carbon pressure, andvpc andvtcare the poloidal and toroidal velocities of the carbon. Bt and
Bp are the toroidal and poloidal magnetic fields at each measurement point. The first term of Eq. (1) is associated with the diamagnetic effect of the carbon and is neglected here. This is because the contribution from the first term is calculated to be only∼ 10% at the rational surfaces of them/n = 1/1 and 3/4 modes, assuming that the carbon density is the same as the charge exchange recombination emission intensity. The direction ofErcorresponds to that of the major radius R. Here we assume that the electric potential φis constant on each magnetic surface. In the VMEC coordinates (s,ϕ,θ), the electric field can be ex-pressed as
E=−∇φ=−dφ
ds∇s, (2)
wheresis the normalized toroidal flux function, andθand
ϕare the poloidal and toroidal components, respectively. Here dφ/dscan be estimated usingEron the basis of finite beta equilibrium. TheE×Bdrift velocity is defined as
uE×B=
E×B
B2 =− dφ ds∇s×
B
B2. (3)
Here we showuandBby using contravariant and co-variant expressions. The contraco-variants of the poloidal ve-locityvθand toroidal velocityvϕat the arbitrary point on a specific magnetic surface are as follows:
vθ= 1
B2 1
√gdφ
dsBφ, (4)
vφ=− 1
B2 1
√gdφ
whereg is the Jacobian operator and can be obtained by VMEC solution. The covariant expressions of the veloci-ties are
vθ=gθθvθ+gθφvφ, (6)
vφ=gθφvθ+gφφvφ, (7) where
gθθ=
dX
dθ
2
+
dY
dθ
2
+
dZ
dθ
2
, (8)
gθφ=dX dθ
dX
dφ + dY
dθ dY
dφ + dZ
dθ dZ
dφ, (9)
gφφ=
dX
dφ
2
+
dY
dφ
2
+
dZ
dφ
2
. (10)
Here X = RcosϕandY = Rsinϕ, andvE×B is
ob-tained as follows:
vE×B=
vθv
θ+vφvφ. (11) The poloidal (toroidal) angular frequency of the E×B
drift, ωθ(ϕ), can be evaluated through contour integration of 1/vE×Bin the poloidal (toroidal) direction. Finally, the
averaged E×Bangular frequency,ωE×B, is obtained by
calculatingnωϕ−mωθ.
The ion and electron diamagnetic drift velocities are defined as
u∗ i =
1
Zieni dPi
ds∇s×
B
B2, (12)
u∗ e=−
1
ene dPe
ds∇s×
B
B2, (13)
wherePiandPeare the ion and electron pressures, respec-tively. We assumed thatZi =1 andPi =Pe. The method of geometrical compensation is the same as that ofωE×B.
Finally, the averaged angular frequencies of ions and elec-trons,ω∗i andω∗e, are obtained.
4. Experimental Results
4.1
Mode frequencies and plasma flows in
typical low-beta discharge
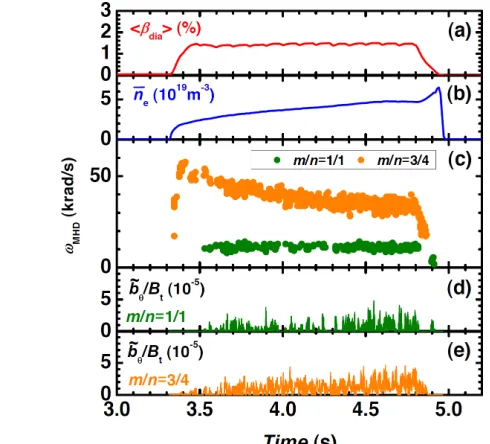
Figure 1 shows the MHD activity in a typical dis-charge with βdia ≈ 1.5%. The two co-NBs and one counter NB were applied at 3.3 - 4.8 s to produce and main-tain the plasma. In addition, two perpendicular NBs were alternately injected at 0.1 s intervals. One NB was used for the CXRS measurements and the other was applied to maintain a steady-state plasma. The port-through power of the NBs is about 20 MW.βdiawas almost constant during a discharge, while the line-averaged electron density was ramped up to 5×10¹⁹m−3. Them/n=3/4 and 1/1 modes were dominantly observed and rotated in the electron dia-magnetic direction in the laboratory frame. Them/n=3/4 mode first appeared at the beginning of the discharge, and
Fig. 1 MHD activity in discharge with βdia ≈1.5%. (a)
Volume-averaged beta value, (b) line-averaged electron density, (c) angular frequencies of MHD modes, and am-plitudes of the (d)m/n=1/1 and (e) 3/4 modes.
the frequency increased withβdia. Whenβdiaexceeded about 1%, the frequency approached about 60 krad/s and then decreased with increasing density. Them/n = 1/1 mode appeared at 3.52 s when the density exceeded a cer-tain value. The difference in the onsets of the modes can be interpreted as a difference in the pressure gradient on each rational surface. A gas puffwas applied for fueling at the beginning of the discharge. Because the pressure typi-cally increases from the plasma edge to core, the pressure gradient, which is the driving source of the interchange mode, also increases from the plasma edge [18]. There-fore, the mode located near the edge is destabilized earlier (as shown in Fig. 2). The frequency of them/n=1/1 mode was almost constant at about 10 krad/s. The amplitudes of them/n=1/1 and 3/4 modes, evaluated by the root mean square method, were 0.41 and 0.71, respectively, at 3.6 s, just after the excitation of the modes, and 0.77 and 1.30 at 4.7 s. They increased with the electron density even at con-stantβdia. Then, the electron temperature and magnetic Reynolds numberS decreased by 71% and 41%, respec-tively. One of the reasons for the increasing amplitude is the reduction inS due to the decrease in the electron tem-perature. The reduction inS emphasizes the mode activ-ity [13].
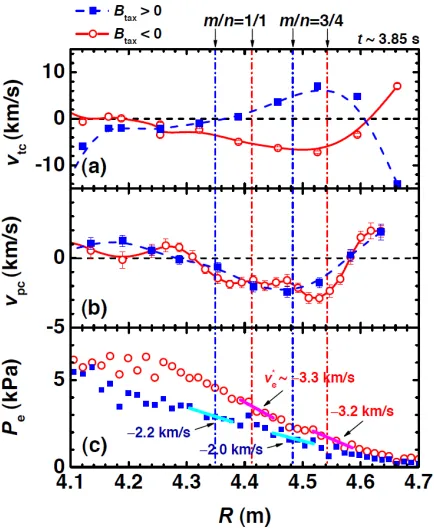
Fig. 2 Profiles of (a) rotational transform, (b) electron pressure, (c) toroidal and poloidal velocities of carbon, and (d) esti-mated radial electric field at 3.85 s in the discharge shown in Fig. 1.
The last closed flux surface (LCFS) is predicted to be lo-cated around 4.55 m, indicating that both modes were ex-cited on the nested magnetic surfaces because the simu-lation result for a low beta equilibrium indicates that the magnetic surface inside the LCFS is nested [19]. The elec-tron pressure has a smooth profile without any local flat-tening. The negative sign of the poloidal carbon velocity corresponds to the electron diamagnetic direction, whereas that of the toroidal velocity corresponds to the counter direction. The poloidal carbon flow was in the electron diamagnetic direction forRranging from 4.31 to 4.58 m. The flow increased radially and approached about 3 km/s atR =4.53 m. The toroidal flow is in the counter direc-tion forR ranging from 4.19 to 4.62 m. The maximum was about 7 km/s at R = 4.52 m. Negative Er formed atR < 4.60 m, and the maximum was about 7 kV/m at
R=4.53 m. The correlations between the MHD mode fre-quency and ion/electron flows are summarized in Sec. 4.3.
4.2
Relationship between MHD modes and
plasma flows under di
ff
erent NB
condi-tions
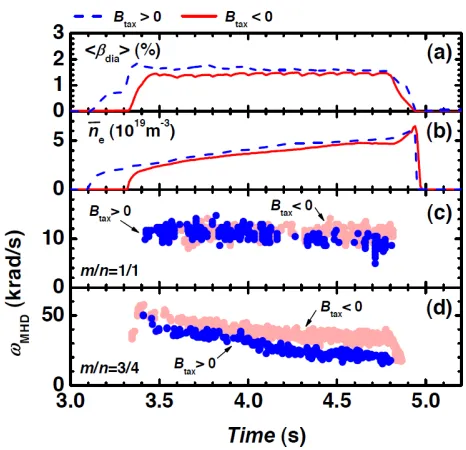
To investigate the effect of the toroidal flow on the MHD mode frequency, we changed the tangential NB di-rection by changing the polarity ofBtax. The positive and negative Btax discharges are shown in Fig. 3. Btax was set at −1.75 T for negative Btax and 1.375 T for positive
Btax. βdia was almost constant, and the line-averaged electron density increased during the discharge. Their
val-Fig. 3 Time evolution of (a) volume-averaged beta, (b) electron density, and angular frequencies of the (c)m/n=1/1 and (d) 3/4 modes in negative and positiveBtaxdischarges.
ues and temporal changes are similar in both cases. The achievedβdiaand line-averaged electron density at 3.85 s are 1.40% and 3.39×10¹⁹m−3 in theB
tax < 0 discharge, whereas they are 1.65% and 3.76×10¹⁹m−3, respectively, in the Btax > 0 one. The frequency of them/n = 1/1 mode is about 10 - 15 krad/s and is almost the same in both cases. For them/n =3/4 mode, the frequency is slightly different. In the negativeBtaxcase, the frequency is about 10 krad/s higher than that in the positiveBtaxcase.
Figure 4 compares the toroidal/poloidal flows and electron pressure in both cases. Although the direction of the poloidal flow is the electron diamagnetic one at both resonances, the direction of the toroidal flow is different. The toroidal flow in the negative (positive) Btax case is in the counter (co-) direction. The absolute value of the toroidal flow approached the same level in both cases. The pressure gradient in the negative Btax case is larger than that in the positive Btax case atR > 4.24 m. The FIT3D code [20] predicts this and attributes it to the difference in the NB deposition profile because the port-through power for negative Btax is 4.6 MW larger than that for positive
Btax.
The time evolution of the estimatedωE×B andω∗efor
them/n = 3/4 resonance are shown in Fig. 5. These fre-quencies were estimated using the technique described in Sec. 3. HereωE×B is almost the same in both discharges
fre-Fig. 4 Profiles of (a) toroidal and (b) poloidal flows, and (c) electron pressure att =3.85 s in the negative and posi-tiveBtaxdischarges shown in Fig. 3.
quency of them/n = 3/4 mode. The angular frequency of them/n = 3/4 mode andωE×B +ω∗eare compared in Fig. 6. The temporal change in the mode frequency and the absolute value are quantitatively consistent with those of the electron flow. The experimental results indicate that the toroidal ion flow itself does not directly affect the mode rotation but contributes to it through the formation of the radial electric field, at least in the present range of the toroidal flow.
4.3
Summary of comparison of plasma flow
under various plasma conditions
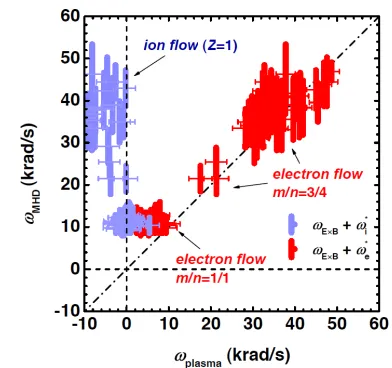
Finally, the electron density was varied in the range 2.4×10¹⁹ to 4.8 ×10¹⁹m−3 so as to change the radial electric field because the formation of the radial electric field is sensitive to the density according to Eq. (1). The mode frequencies also depend on the density, as shown in Fig. 1. βdia varied from 1.1% to 1.6%. Figure 7 compares the angular frequencies of the observed modes and the ion/electron flows in four discharges. The results shown in Fig. 6 are included here. Positive frequency cor-responds to the electron diamagnetic direction. TheE×B
flows obtained in the experiments were in the electron dia-magnetic direction, and the electron flow withωE×B+ω∗e could be widely varied. The experimental results show that the frequencies of the electron flows agree quantita-tively with those of them/n = 1/1 (at< 20 krad/s) and 3/4 (at> 20 krad/s) modes. Although the charge number
Fig. 5 Time evolution of angular frequencies of (a)E×Bdrift and (b) electron diamagnetic drift in the negative (closed squares) and positive (open circles)Btaxdischarges.
Fig. 6 Relationship between angular frequency of the m/n =
3/4 mode (closed circles and squares) and sum of angu-lar frequencies ofE×Band electron diamagnetic flows (open circles and squares).
is assumed to be unity in the estimation ofω∗i, the result is insensitive to this because the modes rotate in the elec-tron diamagnetic direction with higher frequency than the
E × Bflows.
5. Discussion and Summary
gra-Fig. 7 Comparison of angular frequencies of them/n=1/1 and 3/4 modes and the electron/ion flows obtained in plasmas with different electron densities.
dient. Thus, the reason for the slowing of the mode rota-tions is the reduction inω∗edue to an increase in the elec-tron density.
The rotations of them/n=1/1 and 3/4 modes appear to depend very little on the toroidal ion flow when it is less than 7 km/s. The rotation of them/n=2/1 NTM observed in tokamak devices was dragged mainly by the toroidal ion flow [8], which is concluded on the basis of a comparison with the case for ion velocities of up to 100 km/s. In ad-dition, there is a gap between the angular frequencies of the NTM and toroidal ion flow, which might be due to the poloidal flow. Thus, experiments in a wider range of toroidal flows are required to clarify the direct effect on the mode rotation.
When the interchange mode grows significantly in the ideal unstable regime, minor collapse was found to occur after the m/n = 1/1 mode rotation slowed and stopped [12]. The mode rotated in the electron diamagnetic di-rection at the beginning of the discharge, and the rotation started to slow when the amplitude exceeded a threshold. Although no plasma flow was measured then, it is expected that the deceleration of the mode rotation is caused by a reduction in the electron diamagnetic drift flow due to the flattening of the pressure profile around the resonance and/or by deceleration of the electron flow velocity due to the formation of a magnetic island. The experiments de-scribed in this study were done in the ideal stable regime. The amplitudes of the observed modes were sufficiently small compared with those of the ideal unstable case. No profile flattening was observed in any discharge.
In summary, the rotation of resistive interchange in-stabilities was compared to plasma flows under various plasma conditions in the LHD to investigate the physical mechanism of the rotation. The observed MHD modes typically rotate in the electron direction in the laboratory frame, assuming that the ion (electron) flows consist of the
E×Bdrift and ion (electron) diamagnetic drift flows, and their flows were geometrically compensated using a finite beta equilibrium. To change the radial electric field and toroidal flow velocity, the electron density was scanned and the direction of the NBs was changed. The experimen-tal results show that the frequency of the observed mode is quantitatively consistent with the sum of E×B and the electron diamagnetic flows, which suggests that the rota-tion of the resistive interchange mode is dragged by the electron flow.
Acknowledgments
This work was supported by NIFS under contracts ULPP022 and KLPP022, KOAL022, and SOKENDAI. The authors are grateful to the LHD operation group for their excellent technical support.
[1] M.F.F. Nave and J.A. Wesson, Nucl. Fusion 30, 2575
(1990).
[2] J.E. Menardet al., Nucl. Fusion50, 045008 (2010). [3] E.J. Straitet al., Phys. Rev. Lett.74, 2483 (1995). [4] S. Takejiet al., Nucl. Fusion42, 5 (2002).
[5] R. Fitzpatrick, P.G. Watson and F.L. Waelbroeck, Phys. Plasmas12, 082510 (2005).
[6] J. Schirmeret al., Proc. 34th EPS Conference on Plasma Phys. Warsaw, 2 - 6 July 2007 ECA Vol.31F, P-1.133 (2007).
[7] J.A. Snipeset al., Nucl. Fusion30, 205 (1990). [8] A. Isayamaet al., Plasma Fusion Res.5, 037 (2010). [9] S. Sakakibaraet al., Fusion Sci. Technol.58, 176 (2010). [10] S. Sakakibaraet al., Fusion Sci. Technol.50, 177 (2006). [11] Y. Takemuraet al., Nucl. Fusion52, 102001 (2012). [12] K. Idaet al., Nucl. Fusion45, 391 (2005).
[13] S. Sakakibara et al., Plasma Phys. Control. Fusion 50,
124014 (2008).
[14] C. Suzukiet al., Plasma Phys. Control. Fusion55, 014016 (2012).
[15] S. Sakakibara, H. Yamada and LHD Experiment Group, Fusion Sci. Technol.58, 471 (2010).
[16] S.P. Hirschman, W.I. van Rij and P. Merkel, Comput. Phys.
Comm.39, 143 (1986).
[17] S. Nishimuraet al., Phys. Plasmas7, 437 (2000). [18] S. Sakakibaraet al., Nucl. Fusion41, 1177 (2001). [19] Y. Suzukiet al., Proc. of Joint Conf. 17th Int. Toki Conf.
16th Int. Stellarator/Heliotron Workshop 2007, Oct. 15-19, 2007, Toki, CD-ROM Pa2-043 (2007).