Licensed under Creative Common Page 254
http://ijecm.co.uk/
ISSN 2348 0386
OIL PRICE SHOCKS, EXCHANGE RATE
AND NIGERIA’S ECONOMY
Dayo Benedict Olanipekun
Department of Economics, Ekiti State University, Nigeria dayo626@yahoo.com
Abstract
The recent oil price shock and its effect on the stability of the Nigerian economy had led to a
reawakening of the chosen theme. This study empirically examined the relationship between oil
price shocks, exchange rate, external reserve and real GDP in Nigeria using data spanning from
1971Q1 to 2014Q4. The variables of interest were analyzed using Structural Vector
Autoregressive (SVAR) Model. The impulse response functions as well as variance
decomposition results were derived from the analysis. Some insightful findings emanated from
the study. It was revealed that oil price shocks had negative effect on external reserve,
exchange rate and economic growth. The negative effect of oil price shocks on external
reserves and economic growth tended to be more significant in the long run. The findings of this
study revealed that oil price shocks had a deleterious effect on the macroeconomic performance
of Nigeria. An effective macroeconomic management is required to reduce the adverse effect of
oil price shocks in the country.
Keywords: Oil shocks, Exchange Rates, External Reserves, Output Growth, Structural Vector
Autoregressive Model
INTRODUCTION
Licensed under Creative Common Page 255
exchange rate and their major determinants. For instance, Akram (2004) obtained a negative relationship between oil price and exchange rate in Norway. Jiranyakul (2015) revealed a positive and statistical significant impact of oil price on exchange rate movements in Thailand. Kilian (2009) argued that the impact of oil price shocks depends on the sources of oil price fluctuation. Crude oil price shocks could result from both demand and supply sides of the global market. The demand side is due to industrial expansion, speculation, availability of alternative energy sources. Supply side emanates from the Organization of Oil Exporting Countries (OPEC) policies, political unrest in oil-rich areas and the geological formation in which the oil is found.
Exchange rates of oil exporting countries are highly depended on oil price fluctuation. Hence, the adjustment mechanism depends on the source of the shocks, the exchange rate regime and the external reserve accumulation of the economy. Most oil exporting countries operate managed float exchange rate system; hence dwindle oil price in this type of regime will affect their external reserves. To a large extent, the ability of countries to manage their exchange rate depend on the level at which they have accumulated external reserve during an oil boom.
Nigeria’s economy has heavily depended on crude oil export since the 1970s. Over the
periods, several episodes of fluctuation in crude oil prices occurred in the international market. These frequent swings in oil prices have important implications on the exchange rate and external reserve accumulation in the country. Crude oil price fell from US$34.00 to US$17.01 per barrel between 1981 and 1985 and external reserve declined from US$4682.90 million to US$981.81 million. In the reference period, exchange rate depreciated from N0.64 to N0.99 per dollar. Recently, crude oil price declined from $111.46 per barrel in 2011 to $63.28 per barrel at the end of 2014. This development has led to substantial reduction in external reserve and a further depreciation of the exchange rate in the country.
The fall in crude oil price in the past few years has largely affected the Nigerian economy by substantially reducing government revenue. Accordingly, most of the obligations of the government to its citizenry have not been adequately met. The statutory federal allocations to the state have largely reduced. Nigerian government could not adequately finance capital project and salaries of workers especially at the state and local government levels were also not paid for several months. In light of this, Nigeria’s government has to adopt measures to reduce
Licensed under Creative Common Page 256
This study examines the relationship between crude oil price, exchange rate, external reserve and economic growth in Nigeria using data spanning from 1971Q1 to 2014Q4. Earlier studies generally focused on the effect of oil price on economic growth with little attention on the channels of transmission via exchange rate to external reserve. Since Nigerian budget is prepared based on the variability of crude oil price and about 75% of government revenue is derived from crude oil export; any shock in this sector could adversely affect the stability of the economy.
The organization of the rest of the paper is as follows. Section 2 is a highlight of some of the development in Nigeria’s economy with emphasis on the variables of interest. Literature
review appears in section 3, while section 4 provides the methodology and data sources. Model estimation and results are discussed in section 5. Lastly, section 6 presents the conclusion and some policy implications of the results.
Nigeria’s Economy: Crude Oil, Exchange Rates and External Reserves Movements
This section highlights the development in the oil sector and factors responsible for the fluctuation in crude oil prices. It provides the external reserve profile of Nigeria. Further, the movements of the exchange rate and the various exchange rate policies since the establishment of Central Bank of Nigeria are discussed.
The Development in the Crude Oil Sector
After the discovery of oil in commercial quantity in 1956 and its exploration in 1971, crude oil has remained Nigeria’s major export product. Nigeria experienced an era of oil boom in the
1970s. The price of crude oil rose from $2.70 per barrel in 1973 to $29.04 per barrel in 1983. The value of crude oil export in the reference period increased from N1,893.5 million to N7,201.2 million.
This oil boom period led to substantial decline in the non-oil traded goods notably agricultural export. The increased oil price in the international market in this period was caused by the high demand for the product by the industrial sector. Available statistics revealed that by 2013 the monetary value of crude oil production in Nigeria stood at N13,750 million (CBN, 2014). Nigeria’s oil accounts for about 35% of the gross domestic product (GDP) and 90% of
total export revenue. At the end of 2014, crude oil prices had fallen to $63.28 per barrel, Nigeria’s government through its monetary policy committee had to devalue the naira since it
Licensed under Creative Common Page 257
Exchange Rate, External Reserves and Output Growth in Nigeria
Several exchange rate policies have been adopted by the Central Bank of Nigeria (CBN) since its inception in 1958. Exchange rate policies can be broadly classified in two major regimes; the fixed and flexible regimes. The fixed exchange rate regime spanned from 1962 to 1986; it was in line with the CBN exchange control act while the flexible regime has been in operation from mid 1986 up till date. During the earlier period of fixed exchange regime Nigeria’s Pounds were
used as a medium of exchange with easy convertibility with British Pounds. The fixed exchange rate regime induced an over-valuation of the naira and increased importation of finished goods. In 1973, Nigeria’s Pound was changed to Naira and was pegged to a basket of some countries’
currencies which were its major trading partners.
The sudden rise in the price of crude oil in the 1970s increased the foreign exchange earnings of the country and accumulation of external reserves. Nigerian economy experienced oil glut in the early 1980s. This led to a substantial reduction in the foreign exchange receipts. At this time, the government could not sustain the operation of the fixed exchange rate regime; hence, certain policies were put in place in 1985 to deregulate the Foreign Exchange Market (FEM).
In terms of growth, Nigeria’s real GDP grew steadily before the Structural Adjustment
Programme (SAP) except for the period of 1980s (see table 1). A major cause of the decline in economic growth between 1981 and 1985 was the recession that followed the oil boom period of 1970s. Also, in the reference period, the external reserve of the country declined substantially due to fallen crude oil prices.
As part of the policies of the SAP that was introduced in 1986, the Federal Government of Nigeria deregulated the foreign exchange market and introduced the second tier foreign exchange market. In the second tier foreign exchange market, the determination of the Naira and the allocation of foreign exchange were based on the market auction system. Exchange rate depreciated from N0.71 per dollar before the deregulation to N3.31 per dollar in 1986. In 2000, the Naira further depreciated against the dollar after the introduction of the Interbank Foreign Exchange Market; at this time, the exchange rate stood at N102 per dollar (see figure 1). During the period of deregulation, external reserves increased largely and the country’s real
GDP responded to the deregulation policies of the federal government. Consequently, some policies were put in place in the FEM.
Licensed under Creative Common Page 258
2006 and Retail Dutch-Auction System (R-DAS) in 2009. The increased demand for foreign exchange by end users coupled with a gradual reduction in crude oil price in the international market necessitated further depreciation of the exchange rate in 2014. Statistics show that external reserve fell heavily in 2013 and 2014, though positive growth in real GDP was recorded (see Table 1).
Figure 1: Crude Oil Prices, Exchange Rate and GDP Growth
Source: Constructed by the author based on data from Central Bank of Nigeria
Table 1: External Reserves, Crude Oil Prices and NER
Years
External Reserve USD
Million
Crude Oil Price USD/
Barrel
NER (N/$)
Growth rate of External Reserve (%)
Real GDP Growth Rate
(%)
1971-1975 1238.56 5.53 0.63 145.24 5.79
1976-1980 3014.29 20.32 0.63 16.13 4.05
1981-1985 1549.53 30.13 2.93 -5.20 -2.59
1986-1990 3863.21 17.01 13.74 47.80 1.45
1991-1995 4472.18 17.16 21.89 12.26 0.50
1996-2000 5571.04 19.29 52.09 36.91 3.26
2001-2005 12512.30 32.44 125.58 32.92 11.15
2006 37456.09 61.00 128.65 56.15 8.21
2007 45394.31 69.04 125.83 21.19 6.83
2008 58474.38 94.10 118.57 28.81 6.27
2009 77152.31 60.86 148.90 31.94 6.93
2010 37358.71 77.38 150.29 -51.58 7.84
2011 32639.80 107.46 153.86 -12.63 4.86
2012 43830.00 109.45 157.50 34.28 4.28
2013 42850.00 105.87 157.31 -2.24 5.39
2014 37220.33 63.28 158.55 -13.14 6.31
Source: Compiled by the author, based on data from CBN, OPEC and WDI
0.00 20.00 40.00 60.00 80.00 100.00 120.00
-40.00 -20.00 0.00 20.00 40.00 60.00 80.00 100.00 120.00 140.00 160.00 180.00
1971 1973 1975 1977 1979 1981 1983 1985 1987 1989 1991 1993 1995 1997 1999 2001 2003 2005 2007 2009 2011 2013
U S D / B a r r e l
%
Year
Licensed under Creative Common Page 259
LITERATURE REVIEW
Theoretical Literature
The theoretical relationship between oil price shocks and economic activities changes overtime due to several episodes of oil price fluctuations and their implications for real sector variables. There is no clear theoretical conclusion on the effect of oil price changes on economic performance. Some studies have emphasized the role of exchange rate in the transmission of oil prices to macroeconomic variables.
One of the insightful theories on the relationship between commodity prices, exchange rate and macroeconomic variables was developed by Dornbush (1987) using a partial equilibrium framework. This theory assumes an exogenous movement in the nominal exchange rate. The exchange rate movement and the near flexible money wage interact to produce cost shocks for some firms in the domestic and foreign countries, hence leads to a wide adjustment in prices.
Real exchange rate variability plays a major effect on the Dutch disease hypothesis; this involves the adverse effect of the discovery of natural gas on Dutch manufacturing companies which led to the subsequent appreciation of real exchange rate (Corden, 1984). The hypothesis indicates a positive relationship between oil prices and real exchange rates. The assumption of an exogenous exchange rate and sticky wages diminishes the empirical validation of this theory. Zeitz (1992) considered a macroeconomic model to determine how income and price elasticities of import demand are affected by oil price shocks and exchange rate changes. The general conclusion of the model shows that a rise in oil price increases in absolute terms the income and price elasticities of non-oil import demand. The model provides a useful framework in the prediction of the reaction of income-price elasticities for non-oil import demand to the changes in exchange rates. Hamilton (2008) used demand and supply framework to establish market clearance in the petroleum products market and emphasized the role of price and income elasticities in oil price shocks.
DePrratto et al (2009) developed a semi-structural New-Keynesian model of an open economy based on the IS-LM framework. The model shows that oil price changes can have temporary and persistent effects on output via the supply and demand sides of the economy. Three major channels were identified. An increase in oil prices shift the IS curve (demand side), this affect the Philip’s curve through inflationary effects (supply side) and affect the growth rate
Licensed under Creative Common Page 260
Empirical Evidences
Empirical studies on the effect of oil prices on the macro economy have provided different results on the relationship. Some studies have shown that an oil price increase had positive effect on the growth of an economy (Shafi and Hua, 2014; Jiranyakul, 2015). Others have concluded that increase in the price of oil could have detrimental effects on macroeconomic performance (see for instance, Hamilton, 1983; Gosh et al, 2009; Elder and Serletis, 2010). The findings largely depend on whether the economies in question are oil exporting or importing and the degree of their dependency on oil. Some studies in the U.S. provide some striking conclusions on the subject. In an insightful paper, Hamilton (1983) revealed a strong causal and negative relationship between oil price and real GNP; oil price was found to have contributed to some of the U.S. recession. Hamilton and Hererra (2004) established that monetary policy measures may not have strong effects in reducing oil price shocks. In a similar study on the U.S economy, Raymond and Rich (1997) employed the Markov State Switching approach to analyze the effect of oil price shocks on post war business cycle fluctuations. It was revealed that the behaviour of oil prices has been a contributing factor to the slow growth of output. However, the movement in oil prices has not been a major determinant in the slow growth process of the U.S.
Gosh et al (2009) employed error correction model to determine the effect of oil price shocks on U.S. economic growth. The finding was that oil prices reduced GDP which supported the argument of Hamilton (1983). In a similar study, Lee et al (1995) argued that oil prices could have greater impact on real GNP in an environment where oil prices are less volatile than in an environment where oil prices fluctuation are persistent. It was further posited that a positive normalized shocks largely affect growth while negative normalized shocks pose no effect on output growth in the U.S. Hillard (1998) shows that a significant part of oil prices uncertainty in the U.S. was due to adjustments within the energy sector and not within the rest of the economy. Gronwald (2008) found that consumer and import prices are also affected by oil price increases. The impact of oil price shocks on real GDP growth in the U.S. was largely attributed to the oil price shocks of 1973-74, 1979 and 1991.
Licensed under Creative Common Page 261
Jiranyakul (2015) examined the relationship between real oil price and real effective exchange rate using Autoregressive Distributed Lags model. It was reported that an increase in real oil price volatility leads to increase in real exchange rate volatility which has harmful effects on trade. The study revealed no evidence of cointegration and causality among the variables.
Miguel et al (2003) analyzed the effects of oil price shocks on the characteristics of the business cycle and welfare. The paper revealed a negative and statistically significant effect of an increase oil price on welfare in Spain. Oil price shock was estimated to account for more than half of the aggregate fluctuations in the Spanish economy. In a panel study of 21 countries using multivariate threshold model, Huang (2008) investigated the factors affecting the response to the impact of positive oil price shock. It was shown that as an economy becomes more developed and acquires lower ratio of energy use in its industry and transportation sectors, the threshold of tolerance becomes greater. Shafi and Hua (2014) found that imports, exports, inflation and interest rate have statistically significant impact on Russian real effective exchange rate in the long run and short run. The results indicated that a rise in oil price has a positive effect of GDP of the country.
In a study conducted on OECD economies, Jimenez-Rodriguez and Sanchez (2004) showed an evidence of a non-linear impact of oil prices on real GDP. In the oil importing countries, oil price was found to have a negative impact on economic activities. Oil price increase was found to affect UK negatively and Norway positively.
On MENA countries, Berument et al (2010) employed Structural VAR (SVAR) technique to examine how oil price shocks affected their output growth. The findings suggested that the effect of oil price increases varies across the selected countries. It was positive on the outputs of Algeria, Iran, Libya and United Arab Emirates. The impact was not statistically significant on output of Egypt, Israel and Tunisia. Oil supply shocks resulted to lower output growth; the effects of oil demand shocks on output were however positive.
Licensed under Creative Common Page 262
RESEARCH METHODOLOGY
Theoretical Framework
Oil Price and Exchange Rate
The starting point of the theoretical model is to establish the relationship between oil price shocks and exchange rate. Dutch disease hypothesis shows a positive relationship between real exchange rate and real oil prices. Since oil is an exportable commodity in Nigeria, a rise in the real price of oil has a positive effect on wealth, hence, the spending effect and real exchange rate appreciation. However, a fall in oil price causes a decline in spending and real exchange rate depreciation. Oil price rise can be caused by an increase in demand over supply in the international market and discovery of new oil reserves. Thus, suggesting increase in potential levels of profitable output.
) (
rer
oilp (1)
Equation (1) shows that a rise or fall in real oil price (oilp) could lead to real exchange rate
rer
appreciation and depreciation respectively.Oil Price Shock and the Macroeconomy
The point has been made that negative oil price shocks implies real exchange rate depreciation. In an economy that operates a managed float exchange rate system with oil as an exportable commodity, a fall in real oil price would deplete external reserves since the monetary authority relies on the external reserve to keep exchange rate fairly stable.
Barsky and Kilan (2002) employed Gordon (1984) type model to show that oil price shock can be inflationary by reducing industrial production which could generate stagflation. Further, oil price shock could have a long-term implication for economic growth. For an oil exporting country, a fall in crude oil price causes substantial decline in oil revenue, hence, capital accumulation fall. This occurs especially for a small open economy that depends majorly on imported capital. Therefore, dwindle oil price negatively affects government expenditure and economic growth.
Unit Root
Licensed under Creative Common Page 263
hypothesis that a series (Yt) is non-stationary by calculating a t-statistics for
0
against thealternative hypothesis that
0
in the following equation:t t
t
t t Y Y u
Y
1 ...
1 (1)t
Y represents each of the variables to be tested for unit root. Once the computed ADF value is
obtained it can be compared with the critical value of the Dickey-Fuller statistics.
Estimation Technique
The Structural Vector Autoregressive Model (SVAR) technique is adopted for this study because it enables to determine the effect of different regimes of exchange rate on general macroeconomic performance in Nigeria. This technique SVAR is useful to determine how the economy responds to structural shocks that emanate internally and externally. VAR technique was introduced by Sims (1980) and extended by Sims and Zha (2005), Blanchard and Quah (1988). Blanchard and Perotti (2002) used the SVAR procedure to document the effect of fiscal policy shocks on taxes and output. Some studies, for instance, Christanio et al (2005) and Berument et al (2010) have used SVAR to analyze the impact of shocks on macroeconomic variables. The SVAR helps to determine how one standard deviation shock in the error term of a variable affects other endogenous variables in the model. It can be used to forecast the extent of error variance of variables that is due to oil price shocks. The model considered for this study assumes that the Nigerian economy can be represented by a structural equation as follows:
L Xt B LYt UtA ( ) (2)
The
A
L
andB
L
are nm andn
k
matrices respectively. Xt is ann
1
vectors ofexogenous variables and Yt is
k
1
vectors of endogenous variables. Ut is ann
1
vectors ofrandom structural disturbances.
Licensed under Creative Common Page 264
Where, UOILP,UEXRE,URER,UINF and URGDP are the structural disturbances of oil price, external
reserves, real exchange rate, inflation and real GDP. The model satisfies the assumption of 2
) ( , 0 )
(Ut VarUt
E and
OILP,
EXRE,
RER,
INF and
RGDP are the reduced-formresiduals. The restrictions on the structural parameters in the matrix are imposed following studies, such as, Sims (1999), Lee and Ni (2002) and Muhammad et al (2011). Identification of the variables in equation 3 follows their response to shocks.
Data Sources
This study uses secondary data collected from the publications of various organizations and agencies. Data on crude oil prices are collected from International Monetary Fund’s International Financial Statistics while nominal exchange rates and external reserves were collected from the Central Bank of Nigeria (CBN) statistical bulletin. The data on Nigeria’s Gross
Domestic Products (GDP) were gathered from World Bank’s World Development Indicator (WDI). Real exchange rate was obtained by adjusting for relative prices between United States Consumer Price Index and Nigeria Consumer Price Index.
ANALYSIS AND DISCUSSION OF RESULTS
The result of the unit root test is presented in table 2. Critical values of the t-statistics are reported to determine whether the null hypothesis that variables have unit root would be rejected. The t-values show that external reserves (EXRE), Inflation (INF) and real GDP growth (RGDP) are stationary at levels. Nevertheless, oil prices (OILP) and real exchange rate (RER) are stationary at first difference. The results obtained suggest that SVAR can be used to estimate the model. Further, impulse response function and structural variance decomposition can be derived from the SVAR’s estimation.
Table 2: Augmented Dickey-Fuller Test.
S/No. Variables ADF
Statistics with constant at levels
Critical value at
5%
ADF Statistics with
constant at first difference
Critical value at
5%
Order of integration
1 OILP -1.379762 -2.931404 -5.465736 -2.933158 I(1) 2 EXRE -5.002315 -2.933158 -7.444835 2.935001 I(0)
3 RER -0.005837 -2.931404 -5.699306 -2.933158 I(1)
4 INF -3.887260 -2.931404 -5.962497 -2.938987 I(0)
Licensed under Creative Common Page 265
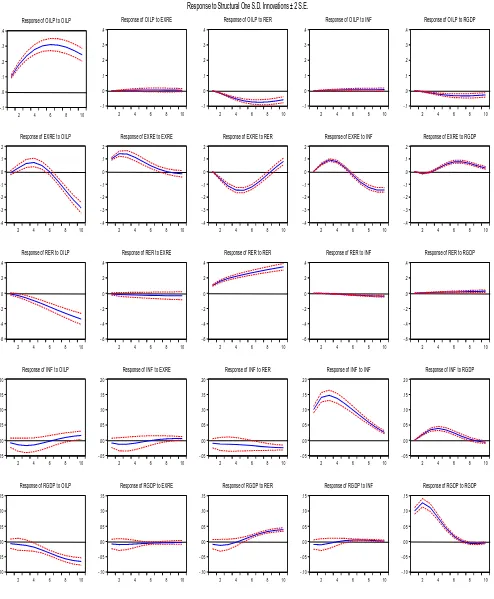
The impulse response function of the SVAR is depicted in figure 2. In the first row, an internal shock on oil price shows a positive and significant response in the time period. Expectedly, the response of oil price to real exchange was negative and significant. An interesting result was obtained from the response of external reserves to crude oil price which is depicted in the second row; external reserve responds positively to oil price shocks up to the fifth period, thereafter, shocks on oil prices negatively affected external reserves. This suggests that negative oil price shocks (fall in crude oil price) would result to the depletion of external reserve in the long run. Further, the response of external reserve to real exchange rate was positive in the short term and medium term and became negative in the long term (see fig. 2). This implies that external reserves depletion leads to devaluation of exchange rate in the periods. The operations of monetary authority in Nigeria over the years had followed these findings. A plausible explanation for this is because of the managed float exchange rate system which operates in Nigeria; the monetary authority draws from the external reserve to stabilize the exchange rate.
Similarly in the third row, the response of real exchange rate to a standard deviation shock in oil price was negative and significant especially at the end of the period. It indicates that dwindled oil price resulted to exchange rate depreciation in the period under study. This finding is in line with theory and the results obtained by Akram (2004). The responses of shocks on inflation to oil prices, external reserves and real exchange rate are negative. Additionally, inflation responded positively to real GDP growth.
A striking result emerged in the last row; here, real GDP growth responded negatively to oil price shock. This result is insightful, since Nigeria’s economy depends mainly on crude oil
price, structural shocks on the price of crude oil could slow down growth in the economy. These findings are supported by wide range of empirical findings, notably, Hamilton (1983), Lee et al
Licensed under Creative Common Page 266
Figure 2: Impulse Response Function Graphs
-.1 .0 .1 .2 .3 .4
2 4 6 8 10
Response of OILP to OILP
-.1 .0 .1 .2 .3 .4
2 4 6 8 10
Response of OILP to EXRE
-.1 .0 .1 .2 .3 .4
2 4 6 8 10
Response of OILP to RER
-.1 .0 .1 .2 .3 .4
2 4 6 8 10
Response of OILP to INF
-.1 .0 .1 .2 .3 .4
2 4 6 8 10
Response of OILP to RGDP
-.4 -.3 -.2 -.1 .0 .1 .2
2 4 6 8 10
Response of EXRE to OILP
-.4 -.3 -.2 -.1 .0 .1 .2
2 4 6 8 10
Response of EXRE to EXRE
-.4 -.3 -.2 -.1 .0 .1 .2
2 4 6 8 10
Response of EXRE to RER
-.4 -.3 -.2 -.1 .0 .1 .2
2 4 6 8 10
Response of EXRE to INF
-.4 -.3 -.2 -.1 .0 .1 .2
2 4 6 8 10
Response of EXRE to RGDP
-.6 -.4 -.2 .0 .2 .4
2 4 6 8 10
Response of RER to OILP
-.6 -.4 -.2 .0 .2 .4
2 4 6 8 10
Response of RER to EXRE
-.6 -.4 -.2 .0 .2 .4
2 4 6 8 10
Response of RER to RER
-.6 -.4 -.2 .0 .2 .4
2 4 6 8 10
Response of RER to INF
-.6 -.4 -.2 .0 .2 .4
2 4 6 8 10
Response of RER to RGDP
-.05 .00 .05 .10 .15 .20
2 4 6 8 10
Response of INF to OILP
-.05 .00 .05 .10 .15 .20
2 4 6 8 10
Response of INF to EXRE
-.05 .00 .05 .10 .15 .20
2 4 6 8 10
Response of INF to RER
-.05 .00 .05 .10 .15 .20
2 4 6 8 10
Response of INF to INF
-.05 .00 .05 .10 .15 .20
2 4 6 8 10
Response of INF to RGDP
-.10 -.05 .00 .05 .10 .15
2 4 6 8 10
Response of RGDP to OILP
-.10 -.05 .00 .05 .10 .15
2 4 6 8 10
Response of RGDP to EXRE
-.10 -.05 .00 .05 .10 .15
2 4 6 8 10
Response of RGDP to RER
-.10 -.05 .00 .05 .10 .15
2 4 6 8 10
Response of RGDP to INF
-.10 -.05 .00 .05 .10 .15
2 4 6 8 10
Response of RGDP to RGDP
Licensed under Creative Common Page 267
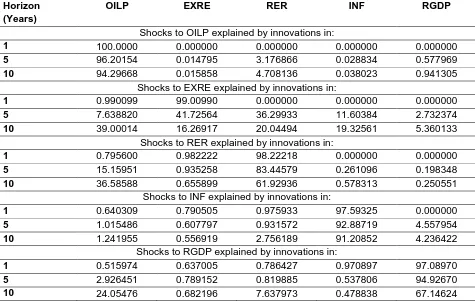
The results of the Structural Variance Decomposition (SVD) are given in table 3. The prime interest of this discussion is the shocks to external reserves, real exchange rates, inflation and real GDP explained by innovation in oil price. It can be deduced that 7.6% and 39.0% of the variation in external reserve are explained by innovations in oil price in the fifth and tenth periods respectively (see table 3).
This implies that external reserves decline as more shocks occur on the prices of crude oil. Further, 15.1% and 36.6% variation in the real exchange rate are explained by oil price in the fifth and tenth periods, respectively. Also, inflation is marginally affected by innovations in oil price; this is obvious in the results of its structural variance decomposition. The responses of real GDP explained by innovation in oil prices are 2.9% and 24.1% in the fifth and tenth periods respectively. This shows that 24% of the variation in real GDP growth could be attributed to oil price changes.
In the third row, second column, the result of the variance decomposition reveals that 19.3% of the shocks to external reserves are explained by variation in inflation. This suggests that increases in general price level could lead to substantial variation in external reserve in the country. Since Nigeria depends largely on importation, devaluation of exchange rate can result to increase in price of basic commodities and an ample amount could be drawn from external reserve to service the country’s importation.
An important implication can be drawn from the shocks to external reserves explained by innovations in real exchange rates. In the fifth and tenth periods, 36% and 20% of the variation in external reserves are explained by real exchange rate dynamics. Also, the results obtained indicate that the country’s inflation is affected by the real exchange rate variation, especially in
the long run (see the fourth row of the SVD). This result is expected since exchange rate directly affects general price level. More importantly, a country that relies heavily on imported goods would experience inflation during exchange rate depreciation.
Licensed under Creative Common Page 268
Table 3: Structural Variance Decomposition Horizon
(Years)
OILP EXRE RER INF RGDP
Shocks to OILP explained by innovations in:
1 100.0000 0.000000 0.000000 0.000000 0.000000
5 96.20154 0.014795 3.176866 0.028834 0.577969
10 94.29668 0.015858 4.708136 0.038023 0.941305
Shocks to EXRE explained by innovations in:
1 0.990099 99.00990 0.000000 0.000000 0.000000
5 7.638820 41.72564 36.29933 11.60384 2.732374
10 39.00014 16.26917 20.04494 19.32561 5.360133
Shocks to RER explained by innovations in:
1 0.795600 0.982222 98.22218 0.000000 0.000000
5 15.15951 0.935258 83.44579 0.261096 0.198348
10 36.58588 0.655899 61.92936 0.578313 0.250551
Shocks to INF explained by innovations in:
1 0.640309 0.790505 0.975933 97.59325 0.000000
5 1.015486 0.607797 0.931572 92.88719 4.557954
10 1.241955 0.556919 2.756189 91.20852 4.236422
Shocks to RGDP explained by innovations in:
1 0.515974 0.637005 0.786427 0.970897 97.08970
5 2.926451 0.789152 0.819885 0.537806 94.92670
10 24.05476 0.682196 7.637973 0.478838 67.14624
CONCLUSION
This study empirically investigates the relationship between crude oil price, exchange rate, external reserve and economic growth in Nigeria. The recent oil price shocks and the consequent economic crisis in oil exporting countries had necessitated an empirical enquiry of this type. Time series data employed in the study were tested for stationarity. Consequently, the variables were estimated using SVAR technique; impulse response function as well as variance decomposition results were obtained from the analysis. Some striking findings emerged from the impulse response function and variance decomposition estimation.
Licensed under Creative Common Page 269
price shocks to economic performance is through external reserves, exchange rate and inflation. The impact on Nigeria’s economy is large due to its dependency on crude oil.
Policy lessons that can be drawn from these findings are three folds. First, it is necessary for Nigeria’s economy to be diversified since shocks in crude oil price had deleterious
effect on macroeconomic variables in the country. Second, government pursuit of managed float exchange rate is desirable to ensure a substantial increase in the external reserve without significant damage of the exchange rate of the country. Third, an effective management and stabilization of crude oil price by Organization of Petroleum Exporting Countries (OPEC) could reduce the adverse effect of its shocks on economic performance of Nigeria.
Further studies may include more macroeconomic variables such as investment and government expenditure in the analysis of oil price shocks and the economic performance. This study involves time series data analysis; future studies could consider more countries and employ a panel data procedure. Usually inference drawn from time series analysis might be different from a panel analysis.
REFERENCES
Akram Q.F. (2004). Oil Prices and Exchange Rates: Norwegian Evidence. The Econometrics Journal 7(2), 476-504
Akpan E.O. (2009). Oil Price Shocks and Nigeria’s Macroeconomy. Available at:
www.csaeox.ac.uk/conferences
Aliyu S.U.R. (2009). Impact of Oil Price Shocks and Exchange Rate Volatility on Economic Growth in Nigeria: An Empirical Investigation. MPRA Paper No. 16319
Barsky R.B. & Kilan L. (2002). Do We Really Know that Oil Caused the Great Stagflation? A Monetary Alternative. In Bernanke B. and Rogoff K. (eds), NBER Macroeconomics Annual 2001: 137-183
Blanchard O.J. & Quah D. (1988). The Dynamic Effects of Aggregate Demand and Supply Disturbances. NBER Working Paper No. 2737
Blanchard O. J. & Perotti R. (1999). An Empirical Characterization of the Dynamic Effects of Changes in
Government Spending and Taxes on Output. NBER Working Paper Series 7269, July 1999
Berument M.H., Ceylan N.B. & Dogna N. (2010). The Impact of Oil Price Shocks on the Economic Growth of Selected MENA Countries. The Energy Journal 31(1), 149-176
CBN (2014). Central Bank of Nigeria Annual Reports and Statement of Accounts, CBN Abuja, Nigeria
Corden W. M. (1984). Booming Sector and Dutch Disease Economics Survey and Consolidation. Oxford Economic Papers. 36(3), 359-380
Christianio L.J., Martin E. & Charles E. (2005). Nominal Rigidities and the Dynamic Effects of a Shock to Monetary Policy. Journal of Political Economy 113(1), 1-45
Dornbusch R. (1987). Exchange Rates and Prices. The American Economic Review. 77(1), 93-106
Depratto B., Resende C. & Maier P. (2009). How Changes in Oil Prices Affect the Macroeconomy, Bank
of Canada Working Paper Series 33, 2009
Licensed under Creative Common Page 270 Gosh N., Varvanres C. & Marle J. (2009). The Effects of Oil Price Shocks on Output”, Business Economics. 44(4), 20-228
Gronwald M. (2008). Large Oil Shocks and the U.S. Economy: Infrequent Incidents with Large Effects. The Energy Journal. 29(1), 151-171
Hamilton J.D. (1983). Oil and the Macroeconomy since World War II. Journal of Political Economy. 91(2), 228-248
Hamilton J.D & Herrera A.M. (2004). Oil Shocks and Aggregate Macroeconomic Behaviour: The Role of Monetary Policy. Journal of Money, Credit and Banking. 36(2), 265-286
Hamilton J.D. (2008). Understanding Crude Oil Prices. NBER Working Paper Series 14492. November 2008
Hillard G.H. (1998). Crude Oil Prices and U.S. Economic Performance: Where Does the Asymmetry Reside. The Energy Journal 19(4), 107-132
Huang B. (2008). Factors Affecting an Economy’s Tolerance and Delay of Response to the Impact of a Positive Oil Price Shocks. The Energy Journal 29(4), 1-34
Jimenez-Rodriguez R. & Sandez M. (2004). Oil Price Shocks and Real GDP Growth: Empirical Evidence for Some OECD Countries. European Central Bank Working Paper Series No. 362, May 2004
Jimenez-Rodriguez R. (2009). Oil Price Shocks and Real GDP Growth: Testing for Non-Linerarity. The Energy Journal 30(1), 1-23
Jiranyakul K. (2015). Oil Price Volatility and Real Effective Exchange Rate: The Case of Thailand, International Journal of Energy Economics and Policy, 5(2), 274-579
Kilian L. (2008). Exogenous Oil Supply Shocks: How Big Are They and How Much Do They Matter for the U.S.”, The Review of Economics and Statistics. 90(2) pp. 216-240
Lee K., Ni S. and Ratti R.A. (1995). Oil Shocks and the Macroeconomy: The Role of Price Variability. The Energy Journal 16(4), 39-56
Mohammad R. Johan-Parvar and Hassan M. (2011). Oil Prices and Real Exchange Rates in Oil Exporting Countries: A Bound Testing Approach. The Journal of Developing Areas, 45(Fall 11), 313-322
Miguel C., Manzano B. and Martin-Moren J. (2003). Oil Price Shocks and Aggregrate Fluctuations. 24(2), 47-61
Raymond J.E. and Rich R.W. (1997). Oil and the Macroeconomy: A Markov State-Switching Approach”, Journal of Money, Credit and Banking, 29(2), 193-213
Shafi K. and Hua L. (2014). Oil Prices Fluctuations and Its Impact on Russian Economy: An Exchange Rate Exposure. Asian Journal of Economic Modelling 2(4), 169-177
Sims C. A. (1980). Econometrics and Reality. Econometrica, pp. 1-48
Sims C.A. and Zha T. (1989). Does Monetary Policy Generate Recessions? Federal Reserve Bank of Atlanta Working Paper No. 198/12
Sims C.A. (1999). Are Forecast Model Usable for Policy Analysis. In K.D. Hoover (Eds.), The Legacy of Robert Lucas, Jr. Elgar (pp 434-448). Northhampton MA
Zietz J. (1992). The Impact of Oil Price Shocks and Exchange Rate Changes on Import Demand