A Hybrid Weighted Probabilistic Based Source
Code Graph Clustering Algorithm For Class
Diagram And Sequence Diagram Visualization
Nakul Sharma, Prasanth Yalla
Abstract: The Unified Modeling Language (UML) model is an essential component in the process of software system development and complex compiled class files. Natural language processing and clustering measures are used to find the relational keywords and methods in the large source code documents. Most of the traditional source code visualization tools are based on limited source code files and fixed similarity threshold. Also, these source code visualization models are independent of source code dependency graph and relational methods for class and sequence diagram representation. In order to overcome these issues, a weighted probabilistic contextual source code pattern extraction model is designed and implemented on the large open source software projects. In this work, a complex class diagram is constructed on the large source code documents using the weighted probabilistic graph clustering algorithm. Similarly, a novel sequence diagram is constructed using the compiled class files metrics. Experimental results are performed on the different open source java software systems with the traditional models in terms of runtime and computational similarity.
Keywords: Natural language process, Machine learning, Source code, class diagram, sequence diagram.
————————————————————
1.
INTRODUCTION
With the increasing volume of computer systems, computational algorithms and information constructions are no longer significant architecture issues. The organisation of the entire system— the architecture of software— presents a fresh range of design issues when devices are built from many parts. This layout was discussed in a variety of respects, including informative diagrams and descriptive conditions, words of module linkages, templates
and systems frameworks for particular domain
requirements and formal designs of the inclusion processes for component models. A program or a computing system software architecture is the design or framework of the system, which includes software components, externally noticeable characteristics and links of those parts. The word references also to software architecture paperwork of a system. Software architecture documentation promotes stakeholder communication and records early decision-making regarding a high level of design and permits re-use of design parts and design patterns among project group. Many businesses have enormous source code repositories, usually in various languages. A number of information with problems, metrics, and dependencies in source code also come from automatic source code analysis tool.. In order to
provide IT performance professionals, designers,
customers and executives with insight, this data must be handled and visualized. There are several visualization techniques and instruments for the source code that deal with this issue at various achievement rates. We intend to apply the methods of Artificial Inteligence in this project to the issue of the visualization of source code.
The cooperation, word association and protein interaction applications of AI (Cluster Analysis), the social network and WWW assessment where a lot of information also needs to be handled are well established and generate fruitful outcomes. In this venture, we hope that we will find comparable possibilities in the field of software viewing. We also understand that our task is best defined as reverse architecture, a term which is written in the literature: reverse architecture is a flavor of reverse engineering that concerns the extraction from system implementation of softwares architecture models. Natural language processing (NLP) investigates how a machine works, understands and processes the language of human humans, understands human understanding, and communicates naturally with human humans. The NLP's Apps include: IR recovery, knowledge extraction, QA, categorization of text, machine translation, reading help, voice identification, structure, and so forth. The growth of the Internet and the wide range of digital papers have led to an immediate need for smart text processing, which makes the concept and the ability of NLP more essential. The use of N-gram and WordNet –An algorithm has been created to recognize actual phrases with shortened identifiers and to divide identifiers that do not follow specific separators. We used N-gram method in the algorithm for the above-mentioned issues. N-gram is an NLP method, depending on the value N and dividing one phrase in pieces. For instance, "file" and N=2 are the chunks "fi," "il" and "le." The data and identificators are not
even combined sometimes even with the same
significance. We have used WordNet to get a phrase and to make the corresponding method again to avoid synonyms. to discourage synonyms. WordNet is an English term and meaning relationship lexical database. A meaning is a specific significance of a phrase. WordNet offers a synset, a synonym list for this meaning for each meaning of a specific term. Many NLP apps need the significance resemblance between two brief documents to be calculated. For instance, the search engines must, over and above the overlap between words, model the relevance of a document
————————————————
Nakul Sharma, Department of Computer Science and Engineering, Koneru Lakshmaiah Education Foundation, Vaddeswaram, Guntur, A.P., India. Email: [email protected]
determine if a query has previously already been requested. This text resemblance is often calculated when the two brief extracts are first embedded and the cosine similitude between them is calculated. Although phrases such as word2vec and GloVe have become normal methods in order to detect the semanticized resemblance between two phrases, there is little consensus about how to calculate phrase embeddings. Below are some of the most popular techniques to be reviewed and their results compared to two benchmarks. Traditionally, resemblance detection methods among documents focused on creating model documents. Several types of document models, such as the Boolene model, the vector model and the statistical probability model, have been developed in recent years. The boolean model provides a crossover and unification of sets to cover keywords. The boolean algorithm is susceptible to misuse, so that an extraction technique approximating a natural vocabulary is an advantage. The UML is an essential component of the software system de-velopment method and a significant knowledge base is included in class model de-indications. A UML class model creates an intricate hierarchy of specifications and it takes on significant human knowledge when compared with various classes to determine the respective components. An exponentially complicated assignment must be tackled in order to imitate such human ability. However, study involving UML class matching mainly revolves on detecting design patterns and surveys that address the issue of matching any class model are rather rare. Objective oriented strategy has been dominating the method of software de-velopment for more than two centuries. During this time the unified modeling language (UML) has become an essential structural foundation for software modeling and class modeling. The primary goal of an reverse engineering
activity is to identify system components and
interrelationships to create the system's representation The removal of factual bases begins with a normal inverse engineering activity. Source code is the most common, useful and trusted data source for factual analysis, because the real application may be lacking, obsolete or unsynchronized with other objects (records, release notes, version management information gathered, bug tracking system etc.).
2.RELATED WORKS
The renowned algorithms of Artificial Intelligence, such as graph clustering, either optimize particular statistical criteria or use a underlying structure or other recognized information characteristic. In this case, the data is taken from the software source code. On evaluation, the vertices of the chart are computer technology artefacts where the objects can have distinct granularities, starting with instructions / operators, methods / fields and finally courses, applications, applications and libraries. The edges of our chart are dependence between artefacts, with different granularities in turn: from the edges of the control flow graph to the edges of the calling method and the field graph and then to the edges of the coupling graph, the use of the packages or the use of library graphs. The next stage involves visualizing the obtained information and presenting it to the customer interactively, zooming, drilling, or expanding / collapsing. A prevalent issue with such
instrument for automatic inferences. Such a instrument could also show areas to be taken care of by human specialists. Semi-automatic inference can be used when partly accessible information is provided. They imply the identification of the common purpose that software products serve in a groups by generalization. One method of determining the objective is to use the language information discovered in the source code, such as identification designations and remarks. This was performed, but before linguistic data was obtained, software engineering products were not partitioned into structurally linked organizations.. We think that the first step is to consider official relationships (for instance feature calls or variable accesses), then to analyze the linguistic relationships in the recognized communities (e.g. by means of call graph clustering) instead of to analyze the vocabulary over the source code[3]. A huge quantity of source codes are accessible and free. The use of open source codes in projects can reduce the duration and cost of the project. While several code search engines (CSE) are accessible, it may be difficult to find the most appropriate code. We offer a structure for overcoming the above-mentioned challenge in this document. It begins with XML Class Diagram (Software Architecture) and gathers data from the XML folder, then selects appropriate initiatives using three kinds of GitHub, Source Forge, and Google Code crawlers. Then it discovers among the large number of downloaded applications the most appropriate initiatives. The Abstract Syntax Tree (AST), which extracts identifiers (class names, process names and feature name) and remarks, is presented in all java documents in every project. Words of action (verbs) are obtained from observations based on a POS. For matching, those identifiers and XML file data must be evaluated.With software source codes growing and developing further, it becomes more hard to identify appropriate code for a specific assignment within millions of code lines. When software reuse functions are performed, designers must first recognize the corresponding code pieces for reuse[4]. Temporarily, several code search engines such as Google Code Search, Krugle, Koders, Sourcerer and Codase are used to define code pertaining to the job designers. In this way a request is placed in one of CSEs by the designer. The customer will rewrite the request and search again depending on the significance of the outcomes.This procedure goes on until the outcomes are met by the customer. The customer has two significant task: (1) the question structure and (2) the determination of the relevance of the test outcomes. The most effective way to search for data is the keywords of several reference methods and the source code that is most suitable and relevant. The search centered on keywords can however produce appropriate outcomes together with meaningless outcomes. Identify the most significant outcome is the biggest task. Analyzing source code identifier with relevant class diagram data is the best way to tackle the task. Program Identifiers are a key source of software systems understanding data. Because programmers select program names to convey their software domain ideas. (Classes, Methods, Areas). Several NLP methods and methods for machine learning were used for the analysis of identifiers.Salton and Lesk suggested the first vector space model (VSM) recovery scheme, not just a binary technique
for intrinsic plagiarism identification is included according to Latent Semantic Indexing (LSI) and the systematic approach[10]. LSI is used for the word matrix for information samples, but for estimating the intrinsic inscriptions styles, stylometry is used. This included an experiments series which examined the skills of the limit on dimensionality as the basic principle for LSI in order to gain insight into its impacts using certain small repositories. In[ 11], a relative assessment was provided to exploit the gourmets ' methods for the string tiling. This method mainly selects from the data sample a seed-source source document and, using a source code metric operation (for example, McCabe's Cyclomatic Complication, the count logical, physical, commentary, and empty lines as well as lists of characteristics and processes) acknowledges the top K identical documents. Chava can process Java source files or class files, enabling distant applets with unusable source code to be analyzed. Analysis using class files is mainly feasible because of Java language characteristics. Failure to have a Java preprocessor implies that we do not have to cope with constructions like macros, databases and templates that do not contain any data in an object file. Java is also an architecture-neutral language, so you can inspect object data to find relations with your program in a machine-independent way. The performance figures show that well operating instrument scales show that Chava is working quicker than Javac (the Java compiler) in order of size. Indeed, Chava's Java program dumping the contents of a class file is also quicker than javap. The data base quantity produced is in the order of the class file type which can be managed very well. When compression is used on the database, size could be considerably decreased. There are tiny enough organizations and interactions for efficient queries.Users conduct tailored queries or relationships that investigate multiple organizational elements of the analysis of the C, C++ or Java program. An entity request enables a customer to use the attribute value only indicated in the left part of the query panel for selecting database documents. A
connection request looks at interactions between
organizations with the attribute numbers (left column) of the origin unit and the target unit (correct column) of a connection. The outcome can be shown in database mode, in graphic (these connections are laid out as a chart) or in text mode (the source lines can be shown). Software devices are typically altered to expand or change their features, increase their efficiency, take them to distinct platforms etc. The layout is carried out via piping of the intermediate database to the respective submission tool. It is important to designers to know the system's high-level design before it is modified. The high level design may, however, not be visible to new developers because of the lack or, worse, inconsistency of the design documentation. This issue could be somewhat alleviated if designers could generate low-level source code layout descriptions. The first stage in the method of model regeneration is to remove module-level dependence from the source code and store the results in a database. These models are used in this phase by the software system. After a database has recorded all module-level dependence, the software system executes a data-database request text, filters the request outcomes and generates the Module Dependency Graph
(MDG) visual description. For example: Different
characteristics can be used in DOT-files for charts, nodes and corners. These characteristics can regulate color, form and row styles. For nodes and edges, after an announcement and before a semicolon, one or more attribute value pairs are placed in square brackets. Chart attribute pairs under graph component are defined as immediate value pairs. This paper is focusing on Java source code, presenting a graphic visualization strategy called DA4Java (Dependency Analyzer for Java), to understand dynamic dependencies between sources. DA4Java mainly has the aim of reducing cognitive effort to comprehend graphs of dependence. Long dependency graphs that overlap with many nodes and edges are generally not esthetic and need more understanding. With this strategy, we can only show the data that will address a certain understanding assignment by producing condensed, esthetic charts. DA4Java utilizes embedded charts and a number of functions to add and filter nodes and corners. for this purpose. The characteristics added enable the customer to create the dependency graph incrementally. For example, the function ' Add callers ' provides techniques to call a chosen entity and calls only the appropriate procedure. Rigi is a tool focusing on mastering the structural complexity of large structures with graphical visualization. This is done by removing the data that is meaningless to the program and focuses on understanding the task of programming. It primarily follows a top-down assessment method and utilizes simple multi-perspective opinions of hierarchy (SHriMPs). They diminish confusion while maintaining the large image. Rigi offers a series of filters via border and node types or incoming and exiting interactions of dependence. It presents the notion of interchangeable nesting opinions to allow a customer to discover various data perspectives at various rates of abstraction. Creole is a Shrimp-based Eclipse plugin. The primary distinction with DA4Java is that these instruments lack characteristics for the graph structure.
3.PROPOSED MODEL
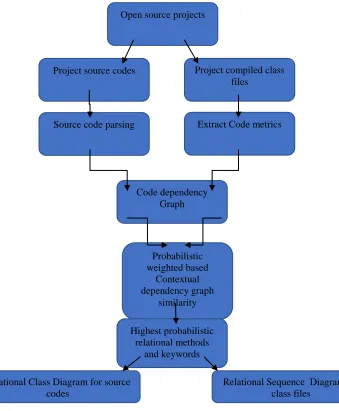
F i g u r e 1 : P r o p o s e d M o d e l
In the figure, initially source code documents and compiled class files are used to pre-process the code structure using tokenization, field extraction and methods extraction. Here, code parsers are used to find and extract the essential patterns in source code documents and class documents. Source code dependency graph is used to find the relational source code and class file metrics for pattern extraction. In the proposed model, a novel weighted
contextual measure is used to improve the similarity context of the source codes for UML representation. Here, a novel clustering method is used to find the contextual relations among the different source code files. These relational source code metrics are used to construct the complex class diagram. Similarly, a novel class clustering measure is used to find the relational metrics in the compiled class files for sequence diagram construction.
Algorithm1: Data Filtering
Input : Source code files SC, Class files CF. Step 1: Read input source codes files SC. Step 2: Read input class files CF.
Step 3:for each source code SCi in SC[]
Do
Project source codes
Source code parsing
Project compiled class files
Extract Code metrics
Code dependency Graph
Probabilistic weighted based
Contextual dependency graph
similarity Open source projects
Highest probabilistic relational methods
and keywords
Relational Class Diagram for source codes
Parse source code SCi with methods M and Fields F.
Mi=ExtractMethods(SCi)
Fi=ExtractFields(SCi)
Mapping (Mi , Fi) to CSi
SC1 (M1,F1)
SC2 (M2,F2)
… …..
SCn (Mn,Fn)
done
Step 4: for each class file CFi in CF[]
Do
Parse class files CFi with methods M and Fields F.
Mi=ExtractMethods(CFi)
Fi=ExtractFields(CFi)
Mapping (Mi , Fi) to CFi
CF1 (M1,F1)
CF2 (M2,F2)
… …..
CFn (Mn,Fn)
done
Step 5: // Remove the duplicate methods and fields in each source code and class files For each code Ci in
SC
i
CF
jDo
i i j
i i j
M
Pr ob(M
M / C);i
j
F
Pr ob(F
F / C);i
j
If( Mi!=0 AND Fi!=0)
Then
Remove Mi in Ci or Cj
Remove Fi in Ci or Cj
End if Done
Step 5: //Pre-processing source code comments using Stanford NLP parser. For each document di in D
Do
T[]=Tokenize(di)
Do
Apply stemming, stopword removal using Stanford NLP library. Done
Done
The source code and class files are used as input to the above algorithm in order to parse the tokens using Stanford NLP and Class parser libraries. Here, each source code and class file is preprocessed using the NLP parsing methods such as tokenization, stemming and stopword removal as source code entities.
Probabilistic Weighted based contextual similarity measure for Source code and class files dependency graph
Input : Project source codes SC, Project class files CF, Project source metrics (SMi,SFi) and Project class metrics (CMi,CFi).
Procedure:
Step 1: Read source code metrics , sci(SMi,SFi) and Project class metrics cfi(CMi,CFi)
Step 2: Constructing a source code dependency graph SDG(V,E) with vertex set V and Edge set E using source code metrics.
Here vertex set V is represented with source code methods and fields and edge set E is represented as weighted rank between the vertices.
Step 3: The probabilistic weights of the edges are computed using the vertex terms ti and tj where
t
i
V
i andt
j
V
j.i, j
i, j i j i j
Prob(t t )
Edgeweight : w(i, j)
2.max{Prob(t ), Prob(t )} Prob(t , t )
i j
Prob(t , t )
is the number of times both terms(t , t )
i j occurred together.i
Prob(t )
is the number of occurrence oft
i in vertex Vij
Prob(t )
is the number of occurrence oft
j in vertex VjStep 4: The vertices with positive edge weights are sorted in ascending order in the dependency graph to find the contextual similarity between the source code metrics.
Step 5: Source code dependency graph SDG is used to find the contextual similarity between the vertex nodes to the neighbor metrics using the following proposed measure.
Let U(SMi) (m1,m2,….mn) denotes the source codes metrics vector at vertex i.
V(SMj) (m1,m2,….mr) denotes the source code metrics vector at vertex j.
2 2 2
i 1 2 p
2 2 2
1 2 q
i j 1 1 2 2 p q
j
| U(S M ) |
U(m )
U(m ) .... U(m )
|
|
V(m )
V(m ) ....V(m )
| U(S M ).V(S M ) | U(m ).V(m )
U(m ).V(m )... U(m ).V(m )
Pr oposed Contextual source code depenedency graph dissimilarity index
is computed a
SM
s
V
1 3
i j i j
i j
U(S M ).V(S M ) * tan
(| U(S M ) |
| V(S M ) |)
CSDGDI=
; where i
j
2 * (| U(S M ) | * | V(S M ) |)
Contextual source code depenedency graph similarity index
CSDGSI
1 CSDGDI;
Contextual source code graph based clustering algorithm Step 1: Read number of clusters c.
Step 2: Read number of iterations I.
Step 3: Initialize k random clusters as centroids. Step 4: for each document at vertex V in graph Do
TF-ID[]= Compute term frequency tf-id Done
Step 5: Repeat until c clusters
Find nearest cluster distance metrics using the following equation Let Document vector one V1, document vector 2 V2
2 2
3
Co sin e(V1[i], V2[i])
Dist(V1, V2)
Correlation(V1, V 2).
V1[i]
V2[i]
Done
Step 6: Merge the graph nodes using the nearest distance measure. Step 7: Update cluster centroid using mean distance.
Step 8: Construct the class diagram using the plant UML library to the filtered top k-clusters C[k]. Step 9: For each source code file SC[i] do
Check the source code file has distance metric >0 If(dist(SC[i],C[k])>0)
Then
Display class diagram in source code file SC[i]. End if
Step 10. done
Step 6: Class file dependency graph CDG is used to find the contextual similarity between the vertex nodes to the neighbor metrics using the following proposed measure.
Let U(CMi) (m1,m2,….mn) denotes the source codes metrics vector at vertex i.
V(CMj) (m1,m2,….mr) denotes the source code metrics vector at vertex j.
2 2 2
i 1 2 p
2 2 2
1 2 q
i j 1 1 2 2 p q
j
| U(C M ) |
U(m )
U(m ) .... U(m )
|
|
V(m )
V(m ) ....V(m )
| U(C M ).V(C M ) | U(m ).V(m )
U(m ).V(m )... U(m ).V(m )
Pr oposed Contextual class code depenedency graph dissimilarity index
is computed as
CM
C
V
3
i j i j
i j
U(C M ).V(C M ) * cos(| U(C M ) |
| V(C M ) |)
CDGDI=
; where i
j
2 * (| U(C M ) | * | V(C M ) |)
Contextual class code depenedency graph similarity index
CCDGSI
1 CCDGDI;
For each class file in CF[i] Do
Add to Sequence diagram designer S. Done
4.EXPERIMENTAL RESULTS
Experimental results are performed on different open source object-oriented software projects such as Weka, Apache, JAMA etc . A total of five java open source projects are taken as input to validate the performance of the proposed model to the existing models. The five open source projects are summarized in table 1. For the experimental evaluation, various performance metrics such as accuracy, similarity index and computational time are used to compare the proposed model to the existing models.
C IC
N
N
Accuracy :
N
In the above formula NC is source code that predict
correctly and NIC is source code reports that predict
incorrectly. Accuracy defines the number of the files that predict correctly over the number of files that is matched. Context similarity defines the number of source codes that are predicted correctly over the project source code documents with high contextual similarity.
Table 1: Summary of selected open source projects(source code files and class files ) with API comments
Software project Number of lines Number of Classes
Weka 32544 425
Apache Commons
Collections 26371 441
Jeuclid 12666 230
JfreeChart 95763 1013
JAMA 5644 253
Table 1, describes the summarization of open source projects and its number of lines and number of classes. From the table, it is clear that the proposed model used different types of complex source code structures and its classes.
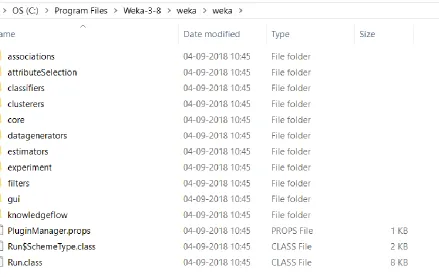
Figure 2: Sample directories of Weka class files
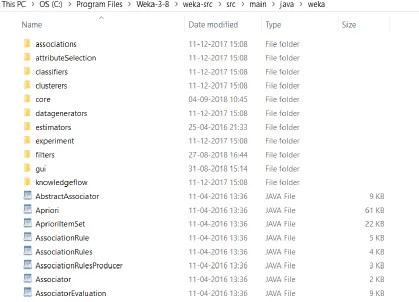
Figure 3: Sample directories of Weka class files
Figure 3, represents the sample input source code files of the open source complex project weka. As shown in the figure, different packages have different class structures and different methods and fields for structural analysis.
Table 2: Computational results of proposed model on the user selected package directory.
=======file 0 file nameASEvaluation.java================ token0
token1 This token2 program token3 is token4 free token5 software token6 you token7 can token8 redistribute token9 it
token21 published token22 by token23 Free token24 Software token25 Foundation token26 either token27 version token28 3 token29 or token30 at token31 your token32 option token33 any token34 later token35 distributed
obj0: name (#225) init signature (#226) ()V=obj1. name (#232) globalInfo signature (#233) ()Ljava/lang/String; type java/lang/String
obj1: name (#232) globalInfo signature (#233) ()Ljava/lang/String; type java/lang/String=obj2. name (#234) searchBackwardsTipText signature (#233) ()Ljava/lang/String; type java/lang/String
obj1: name (#235) setSearchBackwards signature (#236) (Z)V=obj2. name (#239) getSearchBackwards signature (#240) ()Z
obj1: name (#241) thresholdTipText signature (#233) ()Ljava/lang/String; type java/lang/String=obj2. name (#242) setThreshold signature (#243) (D)V
obj1: name (#245) getThreshold signature (#246) ()D=obj2. name (#247) numToSelectTipText signature (#233) ()Ljava/lang/String; type java/lang/String
obj1: name (#248) setNumToSelect signature (#249) (I)V=obj2. name (#251) getNumToSelect signature (#252) ()I
obj1: name (#253) getCalculatedNumToSelect signature (#252) ()I=obj2. name (#254) generateRankingTipText signature (#233) ()Ljava/lang/String; type java/lang/String
obj1: name (#255) setGenerateRanking signature (#236) (Z)V=obj2. name (#257) getGenerateRanking signature (#240) ()Z
obj1: name (#258) startSetTipText signature (#233) ()Ljava/lang/String; type java/lang/String=obj2. name (#259) setStartSet signature (#260) (Ljava/lang/String;)V type java/lang/String
obj1: name (#264) getStartSet signature (#233) ()Ljava/lang/String; type java/lang/String=obj2. name (#265) conservativeForwardSelectionTipText signature (#233) ()Ljava/lang/String; type java/lang/String
obj1: name (#266) setConservativeForwardSelection signature (#236) (Z)V=obj2. name (#268) getConservativeForwardSelection signature (#240) ()Z
obj1: name (#272) getDebuggingOutput signature (#240) ()Z=obj2. name (#273) numExecutionSlotsTipText signature (#233) ()Ljava/lang/String; type java/lang/String
obj1: name (#274) getNumExecutionSlots signature (#252) ()I=obj2. name (#275) setNumExecutionSlots signature (#249) (I)V
obj1: name (#277) listOptions signature (#278) ()Ljava/util/Enumeration; type java/util/Enumeration=obj2. name (#285) setOptions signature (#286) ([Ljava/lang/String;)V type java/lang/String
obj1: name (#293) getOptions signature (#294) ()[Ljava/lang/String; type java/lang/String=obj2. name (#297) startSetToString signature (#233) ()Ljava/lang/String; type java/lang/String
obj1: name (#304) toString signature (#233) ()Ljava/lang/String; type java/lang/String=obj2. name (#306) search signature (#307) (Lweka/attributeSelection/ASEvaluation;Lweka/core/Instances;)[I type weka/attributeSelection/ASEvaluation type weka/core/Instances
obj1: name (#342) rankedAttributes signature (#343) ()[[D=obj2. name (#345) determineNumToSelectFromThreshold signature (#346) ([[D)V
obj1: name (#351) attributeList signature (#352) (Ljava/util/BitSet;)[I type java/util/BitSet=obj2. name (#355) resetOptions signature (#226) ()V
45. Node : 1 value: m_DoNotCheckCapabilities 46. Node : 1 value: Z
47. Node : 1 value: <init> 48. Node : 1 value: ()V 49. Node : 1 value: Code
50. Node : 1 value: LineNumberTable 51. Node : 1 value: LocalVariableTable 52. Node : 1 value: this
53. Node : 1 value: Lweka/attributeSelection/ASEvaluation; 54. Node : 1 value: doNotCheckCapabilitiesTipText 55. Node : 1 value: ()Ljava/lang/String;
56. Node : 1 value: setDoNotCheckCapabilities 57. Node : 1 value: (Z)V
58. Node : 1 value: doNotCheckCapabilities 59. Node : 1 value: getDoNotCheckCapabilities 60. Node : 1 value: ()Z
61. Node : 1 value: buildEvaluator
62. Node : 1 value: (Lweka/core/Instances;)V 63. Node : 1 value: Exceptions
64. Node : 1 value: postProcess 65. Node : 1 value: ([I)[I 66. Node : 1 value: attributeSet 67. Node : 1 value: [I
68. Node : 1 value: forName
69. Node : 1 value: (Ljava/lang/String;[Ljava/lang/String;)Lweka/attributeSelection/ASEvaluation; 70. Node : 1 value: evaluatorName
72. Node : 1 value: options
73. Node : 1 value: [Ljava/lang/String; 74. Node : 1 value: makeCopies
75. Node : 1 value: (Lweka/attributeSelection/ASEvaluation;I)[Lweka/attributeSelection/ASEvaluation; 76. Node : 1 value: i
77. Node : 1 value: I 78. Node : 1 value: model 79. Node : 1 value: num 80. Node : 1 value: evaluators
81. Node : 1 value: [Lweka/attributeSelection/ASEvaluation; 82. Node : 1 value: so
83. Node : 1 value: Lweka/core/SerializedObject;
Key Phrases in SDG :{Utils.forName(ASEvaluation.class, evaluatorName, options)} {Utils.forName(ASEvaluation.class, evaluatorName, options)} ==> Score :0.9711894197576579
Key Phrases in SDG :{Utils.forName(ASEvaluation.class, evaluatorName, options)} {so.getObject()} ==> Score :1.0 Key Phrases in SDG :{Utils.forName(ASEvaluation.class, evaluatorName, options)} {result.enableAll()} ==> Score :1.0
Key Phrases in SDG :{Utils.forName(ASEvaluation.class, evaluatorName, options)} {RevisionUtils.extract("$Revision: 12201 $")} ==> Score :1.0
Key Phrases in SDG :{Utils.forName(ASEvaluation.class, evaluatorName, options)} {evaluator.preExecution()} ==> Score :1.0
Key Phrases in SDG :{Utils.forName(ASEvaluation.class, evaluatorName, options)} {AttributeSelection.SelectAttributes(evaluator, options)} ==> Score :0.9763057908465937
Key Phrases in SDG :{Utils.forName(ASEvaluation.class, evaluatorName, options)} {System.out.println(AttributeSelection.SelectAttributes(evaluator, options))} ==> Score :0.9863905696447163
Key Phrases in SDG :{Utils.forName(ASEvaluation.class, evaluatorName, options)} {e.toString()} ==> Score :1.0 Key Phrases in SDG :{Utils.forName(ASEvaluation.class, evaluatorName, options)} {e.toString().toLowerCase()} ==> Score :1.0
Key Phrases in SDG :{Utils.forName(ASEvaluation.class, evaluatorName, options)} {msg.indexOf("help requested")} ==> Score :1.0
Key Phrases in SDG :{so.getObject()} {Utils.forName(ASEvaluation.class, evaluatorName, options)} ==> Score :1.0 Key Phrases in SDG :{so.getObject()} {so.getObject()} ==> Score :0.826985987428094
Key Phrases in SDG :{so.getObject()} {result.enableAll()} ==> Score :1.0
Key Phrases in SDG :{so.getObject()} {RevisionUtils.extract("$Revision: 12201 $")} ==> Score :1.0 Key Phrases in SDG :{so.getObject()} {evaluator.preExecution()} ==> Score :1.0
Key Phrases in SDG :{so.getObject()} {AttributeSelection.SelectAttributes(evaluator, options)} ==> Score :1.0 Key Phrases in SDG :{so.getObject()} {System.out.println(AttributeSelection.SelectAttributes(evaluator, options))} ==> Score :1.0
Key Phrases in SDG :{so.getObject()} {e.toString()} ==> Score :1.0
Key Phrases in SDG :{so.getObject()} {e.toString().toLowerCase()} ==> Score :1.0 Key Phrases in SDG :{so.getObject()} {msg.indexOf("help requested")} ==> Score :1.0
Key Phrases in SDG :{result.enableAll()} {Utils.forName(ASEvaluation.class, evaluatorName, options)} ==> Score :1.0
Key Phrases in SDG :{result.enableAll()} {so.getObject()} ==> Score :1.0
Key Phrases in SDG :{result.enableAll()} {result.enableAll()} ==> Score :0.826985987428094 Key Phrases in SDG :{result.enableAll()} {RevisionUtils.extract("$Revision: 12201 $")} ==> Score :1.0 Key Phrases in SDG :{result.enableAll()} {evaluator.preExecution()} ==> Score :1.0
==> Score :1.0
Key Phrases in SDG :{result.enableAll()} {e.toString()} ==> Score :1.0
Key Phrases in SDG :{result.enableAll()} {e.toString().toLowerCase()} ==> Score :1.0 Key Phrases in SDG :{result.enableAll()} {msg.indexOf("help requested")} ==> Score :1.0 Cluser-1{
ASSearch.java BestFirst.java
CheckAttributeSelection.java ClassifierAttributeEval.java ClassifierSubsetEval.java GreedyStepwise.java RankedOutputSearch.java Ranker.java
StartSetHandler.java WrapperSubsetEval.java }
[D@281e2377 = [2, 12, 23] Cluser-2{
AttributeEvaluator.java ErrorBasedMeritEvaluator.java SubsetEvaluator.java }
[D@46a2eca6 = [0, 7, 11, 13, 16, 17, 21, 24] Cluser-3{
ASEvaluation.java CfsSubsetEval.java CorrelationAttributeEval.java GainRatioAttributeEval.java InfoGainAttributeEval.java OneRAttributeEval.java ReliefFAttributeEval.java
SymmetricalUncertAttributeEval.java }
[D@4eccb9f0 = [4, 15, 25, 26] Cluser-4{
AttributeSetEvaluator.java HoldOutSubsetEvaluator.java UnsupervisedAttributeEvaluator.java UnsupervisedSubsetEvaluator.java }
[D@3033bb96 = [3, 5, 18] Cluser-5{
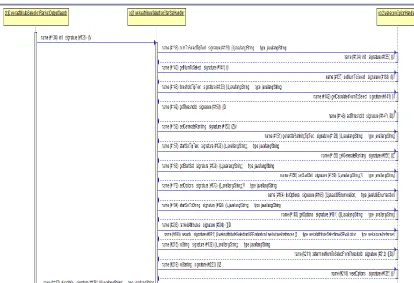
Figure 4 :Complex class diagram
Table 3: Runtime comparison of proposed model on different open source java projects
ClassDiagram Runtime(ms)
Tested Packages Weka JfreeChart Jeuclid JAMA Apache lib
#4 2351 4193 3422 2749 2945
#5 2446 3846 3924 2742 2485
#2 1645 2943 2715 2364 1849
#3 1749 2013 2946 2553 2845
#6 2763 3975 3946 3953 3756
Figure 6: Runtime Comparison of computational runtime of class diagram on different open source projects
Figure 6, describes the comparison of open source projects and its average runtime computation for data processing. In this figure,
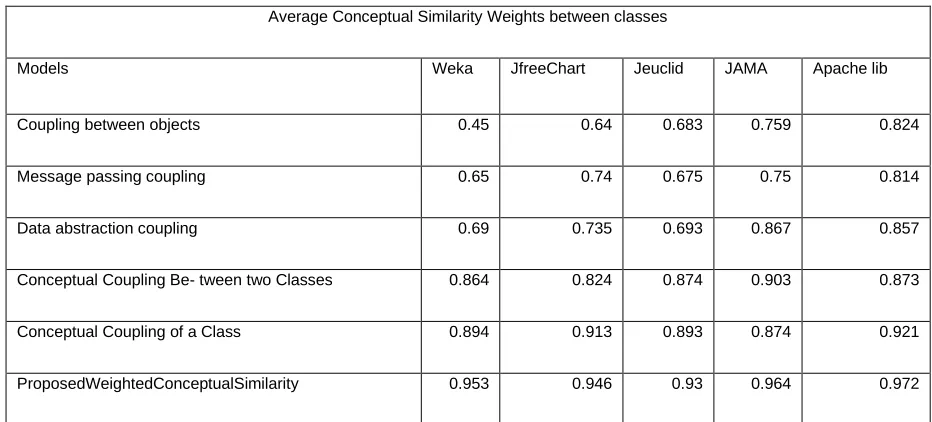
Table 4: Comparison of proposed conceptual similarity weights to the traditional measures.
Average Conceptual Similarity Weights between classes
Models Weka JfreeChart Jeuclid JAMA Apache lib
Coupling between objects 0.45 0.64 0.683 0.759 0.824
Message passing coupling 0.65 0.74 0.675 0.75 0.814
Data abstraction coupling 0.69 0.735 0.693 0.867 0.857
Conceptual Coupling Be- tween two Classes 0.864 0.824 0.874 0.903 0.873
Conceptual Coupling of a Class 0.894 0.913 0.893 0.874 0.921
Figure 7: Comparison of proposed conceptual similarity weights to the traditional measures.
CONCLUSION
In this paper, a novel complex class diagram and sequence diagram are generated using the contextual meaning of the source code and compiled files. In this work, a complex class diagram is constructed on the large source code documents using the weighted probabilistic graph clustering algorithm. Similarly, a novel sequence diagram is constructed using the compiled class files metrics. Experimental results are performed on the different open source java software systems with the traditional models in terms of runtime and computational similarity.
REFERENCES
[1] Blumenthal, D. B. , Bougleux, S. , Gamper, J. , & Brun, L. (2018). Ring based approxima- tion of graph edit distance (pp. 293–303). Cham: Springer International Publishing.
[2] Alnusair, A. , Zhao, T. , & Yan, G. (2014). Rule-based detection of design patterns in program code. International Journal on Software Tools for Technology Transfer, 16 , 315–334 .
[3] Ballis, D. , Baruzzo, A. , & Comini, M. (2008). A rule-based method to match software patterns against UML models. Electronic Notes in Theoretical Computer Science, 219 , 51–66 . Bellahsene, Z. , Bonifati, A. , & Rahm, E. (2011). Schema matching and mapping . Hei- delberg: Springer Berlin Heidelberg . Bernardi, M. L. , Cimitile, M. , & Di Lucca, G. (2014).
[4] E. K. Jackson, E. Kang, M. Dahlweid, D. Seifert, T. Santen, Components, platforms and possibilities: towards generic automation for MDA, in: Proceedings of EMSOFT 10), ACM, 2010, pp. 39–48.
[5] B. P´erez, I. Porres, Reasoning About UML/OCL
Models Using Constraint Logic Programming and MDA, in: Proc. of ICSEA, 2013, pp. 228–233.
[6] B. P´erez, I. Porres, An Overall Framework for
Reasoning About UML/OCL Models Based on Constraint Logic Programming and MDA., International Journal on Advances in Software 7 (1 & 2) (2014) 370– 380.
[7] A. Marcus, G. Antoniol, On the use of text retrieval techniques in software engineering, in: Proceedings of 34th IEEE/ACM International Conference on Software Engineering, Technical Briefing, 2012.
[8] M. J. Howard, S. Gupta, L. Pollock, K. Vijay-Shanker, Automatically mining software-based, semantically-similar words from comment-code mappings, in: Proceedings of the 10th Working Conference on Mining Software Repositories, IEEE Press, 2013, pp. 377–386. [9] J. Yang, L. Tan, Inferring semantically related words from software context, in: Mining Software Repositories (MSR), 2012 9th IEEE Working Conference on, IEEE, 2012, pp. 161–170.
[10]P. W. McBurney, C. McMillan, An empirical study of the
textual similarity between source code and source code summaries, Empirical Software Engineering 21 (1) (2016) 17–42.