Canteen Service Quality And Student
Satisfaction
Norman R. Galabo, EdD, FRIEdr
Abstract: The purpose of the study was to determine the relationship between canteen service quality and student satisfaction at Mintal Comprehensive High School, Mintal, Tugbok, Davao City, Philippines. The research used a non-experimental descriptive correlational research with a total of 200 Grade 11 respondents who were randomly selected. The statistical tools used were the mean, Pearson Product-Moment Correlation (Pearson r) and regression analysis. The indicators of canteen service quality were tangibility, assurance, reliability, responsiveness, and empathy. Student satisfaction was based on the canteen ambiance, cleanliness, facilities, features, and prices. The findings revealed that canteen service quality as perceived by the students is moderately satisfactory and the student satisfaction was moderate. Further, canteen service quality is associated with student satisfaction wherein tangibility, reliability, responsiveness, and empathy showed strong positive correlation. Besides, tangibility, responsiveness, and empathy were the domains of canteen service quality that contribute significantly to student satisfaction. Hence, the school canteen managers are encouraged to improve their service quality provided to students based on the three predictors of student satisfaction.
Index Terms: Basic education, canteen service quality, student satisfaction, correlation, Philippines
————————————————————
1. Introduction
A canteen is a place where food is to be served and eaten, where different snack and drink products are sold. A school utilizes a canteen to meet the food and nutritional needs of its students in order for them to have the energy in to accomplish the task that they would do for the day. The Department of Education is strongly committed to support student‘s health and well-being through its curriculum in schools and range initiatives that offer opportunities for physically fit individuals who love eating healthy food. Schools are encouraged to implement comprehensive health and well-being programs, including food and nutrition education. The establishment and operation of school canteen is important in developing love and interest in buying nutritious and healthy food among students, faculty and the school personnel, making it possible for them to enjoy nutritious and healthy food at affordable prices during the school day. The canteen should also provide the students variety of foods and dishes that enhance their skills and knowledge (DepEd Order No. 8 of 2007). Presently, Mintal Comprehensive High School (MCHS) has various challenges that need to be addressed especially in terms of its canteen service quality provided to students. For instance, a lot of students complain about the price of canteen products because it is too pricey, hence, the students cannot afford because of their insufficient allowances. Besides, teachers and students also recommend a more spacious venue for canteen because most of the time it is crowded. There are also various experiences and complaints from students regarding the kind or variety of foods display in the canteen. Hence, the researcher is challenged to conduct this study in order to assess the canteen service quality provided to students at MCHS where the findings would serve as feedback mechanism of providing good and satisfying canteen services. Besides, there is no existing study conducted pertaining to canteen service quality in MCHS.
1.1 Statement of the Problem
This study aimed to determine the relationship between canteen service quality and student satisfaction at MCHS. Also, this research sought to determine the significant impact of canteen service quality on student satisfaction. Specifically, this study targeted the following questions:
1. What is the level of service quality provided by the school canteen of Mintal Comprehensive High School in terms of tangibility, assurance, reliability, responsiveness, and empathy?
2. What is the level of student satisfaction in the school canteen of Mintal Comprehensive High School? 3. Is there a significant relationship between the
domains of canteen service quality (tangibility, assurance, reliability, responsiveness, and empathy) and student satisfaction at Mintal Comprehensive High School?
4. What domains of canteen service quality (tangibility, assurance, reliability, responsiveness, and empathy) do significantly influence on student satisfaction at Mintal Comprehensive High School?
1.2 Hypothesis
The null hypotheses were formulated and tested at 0.05 alpha level of significance:
H01: There is no significant relationship between the domains of canteen service quality (tangibility, assurance, reliability, responsiveness, and empathy) and student satisfaction at the MCHS canteen.
H02: The domains of canteen service quality (tangibility, assurance, reliability, responsiveness, and empathy) do not significantly influence on student satisfaction at the MCHS canteen.
1.3 Theoretical and Conceptual Framework
This study was anchored on the American theoretical perspective coined by Parasuraman, Zeithaml, and Berry [42], ―SERVQUAL‖ scale for measuring service quality as cited by Chanaka, Wijeratne, and Achchuthan [8]. Service quality concept have focused on three issues: what is service quality; what causes service quality problems; and what can service organizations do to improve quality. Conversely, Lai [32] ————————————————
115 emphasized that the SERVQUAL model provides a theoretical
basis for exploring the relationship between service quality and customer satisfaction and expectations play a significant role in customer satisfaction. Jones, Taylor, Becherer, & Halstead [24] emphasized that, ―when expectations are met or exceeded, customers report higher levels of satisfaction.‖ There are numerous previous studies that had investigated the concept of satisfaction on service setting. Customer satisfaction can be assessed based on the customer‘s satisfaction attitude on various attributes of the product or service. Customer satisfaction depends on a variety of factors, including perceived service quality, customers‘ mood, emotions, social interactions, and other experience-specific subjective factors. Moreover, Parasuraman et al., [41] developed a service quality model to demonstrate that consumers' perceptions of quality are influenced by separate gaps occurring in organizations. However, they listed ten determinants of service quality that can be generalized to any type of service. The ten dimensions include tangibility, reliability, responsiveness, competence, access, courtesy, communication, credibility, security and understanding. In addition, these ten dimensions were then regrouped in the well-known five dimensions in the SERVQUAL model which include tangibility, assurance, reliability, responsiveness, and empathy. These five dimensions are defined as follows: tangibility refers to those physical facilities, equipment, and appearance of personnel; assurance which refers to knowledge and courtesy of employees and their ability to convey trust and confidence; reliability as the ability to perform the promised service dependably and accurately; responsiveness as the willingness to help customers and to provide prompt services; and empathy which refers to caring, individualized attention the firm provides its customers. Presented in Figure 1 is the conceptual framework of study where the independent variable is the canteen service quality with the indicators namely: tangibility, assurance, reliability, responsiveness, and empathy. The dependent variable is the student satisfaction which is based on the provided services of the school canteen of MCHS.
INDEPENDENT VARIABLE DEPENDENT VARIABLE
Figure 1. The Conceptual Framework Showing the
Variables of the Study.
1.4 Delimitation and Limitation of the Study
This study focused only the responses perceived by the Grade 11 students of MCHS about the canteen service quality and their satisfaction. The respondents were only taken from one
curriculum, the Grade 11, which does not represent the entire student population of the said school. Hence, the result may not truly represent the reality in the school canteen as perceived by the entire population of the said school.
1.5 Significance of the Study
This study was conducted to determine the significant relationship between the levels of service quality and student satisfaction in the school canteen of MCHS. The study results may be beneficial to the following:
School Administrators. The results may provide information as basis for policy formulation and improvement of canteen services provided to the students of MCHS. This may help school principals to provide assistance in the provision of canteen facilities to be included in the school improvement plan.
Canteen Managers. This may provide the necessary data for the canteen managers to identify their priority areas of improving the canteen services to better serve its customers, the students.
Teachers. This may encourage teachers to give feedback to the administration and school canteen managers for improvement of services like affordable prices, nutritional foods, facilities, maintaining cleanliness, and sanitation.
Students. This study would be beneficial to students for them to understand the realities about the canteen operations and the basic services that are expected to be provided by the school.
Future Researchers. This may serve as basis for those research enthusiasts to conduct further inquiry regarding canteen service quality and student satisfaction.
1.6 Definition of Terms
Canteen Service Quality. This refers to the basic services provided by the school canteen of MCHS as perceived by the Grade 11 students. As defined by Lewis and Blooms [33] that service quality is a measure of how well the service level delivered matches customers‘ expectations.
Student Satisfaction. This refers to the degree of satisfaction perceived by the students based on the provided services of the school canteen of MCHS. Elliott & Shin [11] defined student satisfaction as the favorability of a student‘s subjective evaluation of the various outcomes and experiences associated with education. In this study, the student satisfaction means customer satisfaction because students are considered customers of school canteen.
2. Literature Review
This part deliberately presented the different views of authors, findings from previous studies, and varied ideas from research writers regarding canteen service quality and student satisfaction. The readings were carefully chosen as to its significant contribution to the purpose of this study. Also, the
Canteen Service
Quality
tangibility
assurance
reliability
responsiveness
empathy
shared views enriched the discussion of this study and gave the researcher a wider understanding and perceptions about this present inquiry.
Canteen Service Quality
The concept of quality is difficult to define because quality means different things to different people. The way one customer will experience a product or service is not the same way another will experience it. Quality can be categorized in terms of various perspectives like judgment, product, user, value or manufacturing perspective [12]. With the judgment perspective, the quality of a product cannot be defined but one can recognize it one he sees it. The user perspective is about how the needs of a customer are met. Kasper, Helsdingen, and Gabbott [27] view there are five service characteristics that determine how service quality is achieved. The first is the inability to own the service the way one would own a product. Quality assessment can only be made after the service has been purchased. The second characteristic is the intangibility of services that make it impossible to assess what is being offered and the quality of what has been delivered. The third characteristic of service delivery is the inseparability of the service from the people involved in its production and consumption. The customer is a participant in the process and therefore this has an effect on the output received. If the customer is not cooperative lower quality may be achieved. The fourth characteristic of services is heterogeneity or variance of the service from time to time. This means that sometimes the service is good while at other times it may be poor. Perishability is the fifth characteristic of the service delivery that affects service quality. If it is not managed well it may mean long waiting lines or no people in the queue at all which the customer interprets as low quality. In addition, a service is an activity which has some element of intangibility associated with it which involves some interaction with customers or with property in their possession, and does not result in a transfer of ownership. A change in condition may occur and production of the service may or may not be closely associated with a physical product. In simple terms services are deeds, processes, and performances [55]. In the study of Jun, Yang, and Kim [25], they identified the key underlying dimensions of online retailing service quality as perceived by online customers. The findings showed that the access dimension had a significant effect on overall service quality, but not on satisfaction. It was concluded that a significantly positive relationship between overall service quality and satisfaction. Furthermore, Tsiotsou [48] investigated the effect of various perceived quality levels on product involvement, overall satisfaction and purchase intentions. The findings of the study are perceived perceptions of product quality were significantly related to all the variables under investigation. Finally concluded perceived quality explained more of the variance in overall satisfaction than in product involvement and purchase intentions. Another study conducted by Kyoon yoo and Ah park [30] about determining the relationships among employees perceived service quality, customers and financial performance. The findings of the study revealed that employee training has an influence on perceived service quality. They concluded that management may keep the consistency and reliability of perceived service quality by
increasing the capability of employee through training and a shared understanding.
Tangibility. This determinant is related to the appeal of facilities, equipment and material used by a service firm as well as to the appearance of service employees [16]. Besides, representing the service physically tangibles are the appearance of physical facilities, equipment‘s, personnel, and communication materials. Tangibles provide physical representations or image of the service that customers, particularly new customers, will use to evaluate quality [17].
Assurance. This means that staffs‘ behavior will give
customers confidence in the school canteen and that the canteen makes customers feel safe. It also means that the employees are always courteous and have the necessary knowledge to respond to customers‘ questions [16]. This is especially critical where trust and confidence in the service provider are crucial. The assurance perceived by customers is an important dimension of service quality in any industry but even more so in the health care industry where customers associate quality with perceptions of human factors [4]. On the other hand, Dehbidi, Salimifard, & Abdollahzadeh [9] investigated an innovative study that focuses on the quality of dimensions which is more attracted by customers. The obtained results from this research showed that courtesy and politeness dimension existed among staff and customers had the highest score which indicates the importance of this dimension from the staff and customers‘ viewpoint. The lowest score belonged to tangible requirements that both groups of participants had the same opinion.
Reliability. This means that the service firm provides its customers with accurate service the first time without making any mistakes and delivers what it has promised to do by the time that has been agreed upon [16]. Likewise, it is defined as be fundamentally concerned with issues of consistency of measures [6]. Moreover, it is the ability to deliver expected standard at all time, how the organization handle customer services problem, performing right services for the first time, providing services within promised time and maintaining error free record. Reliability consists of accurate order of fulfillment, accurate record, accurate quote, accurate billing, and accurate calculation of commissions which keep the service promising to the customer [54]. Additionally, it is also defined as the ability to perform the promised service dependably and accurately. ―In its broadest sense, reliability means that the company delivers on its promises—promises about delivery, service provision, problem resolution, and pricing‖. Customers need to do business with companies that keep their promises. Of the five dimensions, reliability has been consistently shown to be the most important determinant of perception of service quality gap [17].
117 customer‘s requests, questions and complaints promptly and
attentively. A firm is known to be responsive when it communicates to its customers how long it would take to get answers or have their problems dealt with. To be successful, companies need to look at responsiveness from the view point of the customer rather than the company‘s perspective [17].
Empathy. This means that the school or firm understands customers‘ problems and performs in their best interests as well as giving customers individual personal attention and having convenient operating hour [16]. Also, it means carrying individual attention to customers including the features of sensitivity, approachability and understanding customers‘ needs. The aspects of empathy, which could bring about higher levels of customer satisfaction, are providing personalized care and concern, the ability to anticipate a customer‘s need and make him or her feel special [19]. Furthermore, treating customers as individuals‘ individualized attention that the firm provides its customers, the essence of empathy is conveying, through personalized or customized service, that customers are unique and special and that their needs are understood. Customers want to feel understood by and important to firms that provide service to them [17].
Student Satisfaction
Elliott & Shin [11] defined student satisfaction as the favorability of a student‘s subjective evaluation of the various outcomes and experiences associated with education‖. While most student satisfaction study focus on the perspective of customer, researchers is facing a problem of creating a standard definition for student satisfaction thus providing a need of customer satisfaction theory to be selected and modified so that it can explain the meaning of student satisfaction [21]. Even though it is risky to view students as customer, but given the current atmosphere of higher education marketplace, there is a new moral prerogative that student have become ―customer‖ and therefore can, as fee payers, reasonably demand that their views be heard and acted upon [50]. Elliott & Healy [10] define student satisfaction as short-term attitude resulting from an evaluation of a student‘s educational experience. There is not much difference between the two terms because the student is just another kind of customer who is a consumer of the education service and therefore most of the literature on service marketing will apply. Customer satisfaction, as noted by Jashireh, Slambolchi, and Mobarakabadi [23], is a customer's perspective based on expectation and then subsequent post purchase experience‖. In other words, it is an evaluation of products or services quality level that meets or exceeds the customer expectations. Satisfaction as a term means the feeling an individual gets when his or hers wishes, expectations or needs are fulfilled, and the pleasant feeling that follows from it. As satisfaction is a feeling, it resides in the user‘s mind and differs from other observable behaviors, such as complaining, product choice and repurchasing [20]. Satisfaction and dissatisfaction are two ends of a continuum, where the location is defined by a comparison between expectations and outcome. Customers would be satisfied if the outcome of the service meets expectations. When the service quality exceeds the expectations, the service provider has won
while quality relates to managerial delivery of the service. The level of a service quality can be determined based on the amount that paid for the service [45]. According to Klassen et al. [29] purchase decision that made by students will consider about the price. The good value of price, portion size, reasonable price and overall value of dinning is categorized into price. When perceived price is low, the perceived satisfied will be low. Food quality is a quality characteristic of food and then consumers can be acceptable [37]. Food quality is very close and the impact of customer satisfaction that can be measured cafeteria service level by students' satisfaction. The food quality has two factors includes external factors and internal factors. External factor is major appearance, size or color, texture and flavor and internal factors will major focus to nutrition, chemical and physical. That the factors are most important to influence consumer select the food and evaluate food quality. The degree of satisfying university cafeteria depends mostly on the quality of meals, diversity of food, food hygiene and environment [28]. Overall quality of the food, taste of food, freshness of the food and eye appeal of the food are classified for food quality dimension [40].
3. Research Methods
Presented are the discussions on the research design, research locale, research subjects, research instrument, data gathering procedure and statistical treatment of the data.
3.1 Research Design
This study used the non-experimental quantitative research design utilizing correlational method. According to Catena [7], descriptive correlational method is used to determine the relationship between two or more variables and to ascertain their relationship. Besides, Rybarova [44] emphasized that this method was used since the study provides a description of a individuals and aimed to explain the nature of the data. This study is descriptive in nature since it assessed the levels of canteen service quality and student satisfaction at MCHS canteen. This is correlational since it determined whether canteen service quality influences student satisfaction.
3.2 Research Locale
This study was conducted in Mintal Comprehensive High School (MCHS) situated at the heart of Barangay Mintal, Tugbok District, Davao City. Its official mantra is ―Excellence is a Virtue‖ which the school‘s guiding principles in shaping the minds of the students, parents, teachers and stakeholders. It has been 25 years in existence of providing quality basic education in the locality. It offers complete Junior High School (JHS) and Senior High School (SHS) Programs. It is categorized as large school since the total student population is approximately 3,000 students with 70 JHS and 25 SHS competent teachers from different fields of expertise. MCHS has only one school-managed canteen who serves its entire population.
3.3 Research Respondents
The respondents of this study were taken from the Grade 11 Senior High School students of MCHS. Specifically, the respondents were composed of 200 out of 391 total population of Grade 11 students. The said students were officially enrolled
during the School Year 2018 – 2019. Presented in Table 1 is the distribution of respondents using the Slovin‘s Formula (n=N/(1+Ne^2 )) and ratio and proportion for each section.
Table 1 Distribution of Respondents
3.4 Research Instrument
The instrument used in the gathering of data was a survey questionnaire, both service quality and student satisfaction, adopted from the study of Kajenthiran and Karunanithy [26]. To ensure the reliability of the instruments, a pilot test was conducted through calculating the value of Cronbach‘s Alpha with the obtained values of each domains such as 0.910 for tangibility, 0.895 for assurance, 0.900 for reliability, 0.896 for responsiveness, 0.910 for empathy, and 0.905 for student satisfaction. For the statements in the student satisfaction, they were based on its indicators namely ambiance, cleanliness, facilities, special features, and prices of products. Hence, the Cronbach‘s value of the construct meet the minimum reliability of 0.6 which means that the measures used here are consistent enough for the study. In terms of instrument‘s face validity, the items were modified to suit the purpose of this study and were validated by experts. The questionnaire was presented to the adviser for comments, corrections, and suggestions. The perceptions of the respondents among the Grade 11 Senior High School students of Mintal Comprehensive High School were based on the following Five-point Likert rating scales:
Grade & Section
Enrolment Data as of June 2018
No. of
Respondents %
Grade 11 – Aristotle 30 15 7.67
Grade 11 – Democritus 58 30 14.83
Grade 11 – Descartes 55 28 14.07
Grade 11 – Kepler 18 9 4.60
Grade 11 – Marx 57 29 14.58
Grade 11 – Plato 62 32 15.86
Grade 11 – Pythagoras 55 28 14.07
Grade 11 – Socrates 56 29 14.32
119
3.5 Data Gathering Procedure
The following steps were followed in gathering of data.
Permission to Conduct the Study. A letter of endorsement from the research teacher was secured. Then, letter permission from School Principal was secured to conduct the study on canteen service quality and student satisfaction. After the approval, the researchers prepared the letter addressed to the section advisers and subject teachers to formally conduct the survey.
Administration and Retrieval of Questionnaire. The researchers administered the questionnaire personally to the respondents of the study and they were requested to answer the questionnaire honestly so that valid and reliable data could be elicited. Prior to the distribution of the instrument, the researcher explained the purpose of conducting the survey. One hundred percent (100%) of the completely answered questionnaire was retrieved.
Collation and Tabulation of Data. The first step was to ensure that the data collected was accurate. The gathered data through the questionnaire were scored, recorded, and classified with the help of the statistical analysis. The data were collated and tabulated before subjecting it to statistical treatment. Results were analyzed and interpreted based on the purpose of the study with the assistance of the statistician.
3.6 Statistical Treatment of the Data
The following statistical tools were used in the treatment and analysis of the gathered data.
Mean. This was used to determine the level of canteen service quality and student satisfaction of Grade 11 students of Mintal Comprehensive High School.
Pearson r. This statistical tool was used in determining the significant relationship between the canteen service quality and student satisfaction among the Grade 11 students of Mintal Comprehensive High School.
Regression Analysis. This was used to determine the significant influence of the domains of canteen service quality (tangibility, assurance, reliability, responsiveness, and empathy) on the student satisfaction of Grade 11 students of Mintal Comprehensive High School.
4. RESULTS AND DISCUSSION
Presented are the findings of the study, its analysis, and interpretations based on the tabulated and treated data generated from responses of the respondents. The discussion is arranged based on the statement of the problem presented in this study and the presentation concentrates with the highest, middle, and lowest mean ratings.
4.1 Service Quality in terms of Tangibility
Presented in Table 2 is the data on the level of service quality in terms of tangibility. The mean ratings are as follows: assigning good canteen staffs (3.40); providing comfortable facilities in the school canteen (3.17); and having complete and functional equipment of the school canteen (3.07). The overall mean rating is (3.17) which means that the level of canteen service quality in terms of tangibility is moderately satisfactory. This means that students perceived the canteen personnel as good, well-dressed, neat, and provided them with comfortable, complete, and functional facilities. Also, the physical area of the canteen is described as clean and presentable. This is in support to the idea of Gupta and Zeithaml [17] who emphasized that the appearance of physical facilities, equipment, personnel, and written materials in stores to attract their customers. The concept of physical aspects is defined as the retail store appearance and store layout. In empirical study focus the relative importance of quality dimensions, the service quality performance in relation to ‗should‘ and ‗would‘ expectations and the role of context markers. The findings of the study that service providers need to tone up their performance with respect to most of service dimensions.
Range of Means
Descriptive Level
Interpretation
4.20 – 5.00
Very High
This means that the canteen service quality at MCHS as perceived by the Grade 11 students is outstanding.
3.50 – 4.19
High
This means that the canteen service quality at MCHS as perceived by the Grade 11 students is very satisfactory.
2.60 – 3.49
Moderate
This means that the canteen service quality at MCHS as perceived by the Grade 11 students is moderately satisfactory.
1.80 – 2.59
Low
This means that the canteen service quality at MCHS as perceived by the Grade 11 students is rarely satisfactory.
1.00 – 1.79
Very Low
This means that the canteen service quality at MCHS as perceived by the Grade 11 students is poor.
Range of Means
Descriptive Level
Interpretation
4.20 – 5.00
Highly Satisfied
This means that the Grade 11 students of MCHS are highly satisfied with the provided canteen services.
3.50 – 4.19
Very Satisfied
This means that the Grade 11 students of MCHS are very satisfied with the provided canteen services.
2.60 – 3.49
Moderately Satisfied
This means that the Grade 11 students of MCHS are moderately satisfied with the provided canteen services.
1.80 – 2.59
Rarely Satisfied
This means that the Grade 11 students of MCHS are rarely satisfied with the provided canteen services.
1.00 – 1.79
Not Satisfied
Table 2 Tangibility
4.2 Service Quality in terms of Assurance
Reflected in Table 3 is the data on the level of service quality in terms of assurance. The mean ratings are as follows: the canteen staffs show trust and confidence (3.56); the canteen staffs show positive behaviour towards students (3.19); and the canteen staffs have the ability to inspire students. The overall mean rating is (3.25) which mean that the level of canteen service quality in terms of assurance is moderately satisfactory. This implies that canteen staffs conveyed trust, confidence, courtesy, and politeness towards student customers. Besides, canteen employees show positive and inspiring behavior in dealing or serving with their customers. The result is allied on the study of Dehbidi, Salimifard, and Abdollahzadeh [9] about the quality of dimensions which is more attracted by customers. The obtained results from this research showed that courtesy and politeness dimension existed among staff and customers had the highest score which indicates the importance of this dimension from the staff and customers‘ viewpoint. The lowest score belonged to tangible requirements that both groups of participants had the same opinion. In other words, the Grade 11 students perceived assurance indicator as moderate satisfactory because the attributes indicated were sometimes manifested by the canteen personnel.
Table 3 Assurance
4.3 Service Quality in terms of Reliability
Displayed in Table 4 is the data on the level of service quality in terms of reliability. The mean ratings are as follows: keeping canteen staffs being cheerful and kind all the time (3.29); having the attitude to entertain the costumer (3.24); and keeping service accurately (3.14). The overall mean rating is (3.23) which mean that the level of canteen service quality in terms of reliability is moderately satisfactory. This implies that students noticed that reliability is sometimes manifested by the canteen staffs. Additionally, canteen staffs show kindness and cheerfulness in rendering their services to the students. They also keep services dependently, accurately, and with sincere interest in providing the needs of the students.
Table 4 Reliability
No. Items Mean SD Descriptive Level
1. showing sincere interest to the students
3.20 1.09 Moderate
2. keeping service accurately 3.14 0.90 Moderate
3. keeping service dependently 3.27 1.01 Moderate
4. having the attitude to entertain the students
3.24 0.89 Moderate
5. keeping canteen staffs being cheerful and kind all the time
3.29 1.05 Moderate
Overall Mean 3.23 0.80 Moderate
The results show that reliability has been consistently shown to be an important determinant of perceptions of service quality [52]. On the other hand, in restaurants, reliability was found to be an important contributor to customer satisfaction [35]. Some institutional food services offer students the opportunity to pay only those foods eaten each day with a declining-balance account system being used [15].
4.4 Service Quality in terms of Responsiveness
Showed in Table 5 were the data on the level of service quality in terms of responsiveness. The mean ratings are as follows: having the heart to willingly serve and help the students (3.31); providing good and quality service (3.23); responding to students‘ needs (3.23); and prompt service (3.08). The overall mean rating is (3.22) which mean that the level of canteen service quality in terms of responsiveness is moderately satisfactory. This implies that canteen personnel respond positively and promptly to students‘ requests and needs. They also manifest willingness to serve and help the students by proving good and quality services. The importance of responsiveness in canteen services is substantiated by research indifferent sectors of the food service industry. It is important that the staff help customers with positive attitude. Gramling, Byrd, Epps, Keith, Lick, and Tian [14] found out that students expected a better attitude from staff serving them. In another study, university students highlight employee‘s attitude as one of the three most influential factors of students‘ food choices [56]. In contrast with the result of this study, at Shantou University, students were most dissatisfied with the staff being impatient in serving them of all service aspects [3]. This implies that the attitude of service staff can make students feel welcome when using the food services provided by the school canteen.
No. Items Mean SD Descriptive
Level
1. keeping the canteen staffs well-dressed and appear neat
3.20 0.99 Moderate
2. keeping the physical appearance of the school canteen neat and presentable
3.09 0.93 Moderate
3. having complete and functional equipment of the school canteen
3.07 1.02 Moderate
4. providing comfortable facilities in the school canteen
3.17 1.00 Moderate
5. assigning good canteen staffs
3.40 1.02 Moderate
Overall Mean 3.17 1.06 Moderate
No. Items Mean SD Descriptive Level
1. showing knowledge of products sold in the canteen
3.17 1.66 Moderate
2. showing positive behavior towards students
3.19 0.91 Moderate
3. having the ability to inspire students
3.10 1.00 Moderate
4. showing courtesy and politeness
3.25 1.06 Moderate
5. conveying trust and confidence
3.56 1.09 Moderate
121
Table 5 Responsiveness
4.5 Service Quality in terms of Empathy
Shown in Table 6 is the data on the level of service quality in terms of empathy. The mean ratings are as follows: showing kindness to students (3.23); asking students in a nice and cheerful manner (3.22); being approachable and friendly to students; and showing concern and care for the students (2.95). The overall mean rating is (3.15) which means that the level of canteen service quality in terms of empathy is moderately satisfactory. This means that canteen staffs showed empathy in dealing with students through being kind, approachable, understanding, and sensitive to their needs. The results support the idea of Harr [19] that empathy means carrying individual attention to customers including the features of sensitivity, approachability and understanding customers‘ needs. The aspects of empathy, which could bring about higher levels of customer satisfaction, are providing personalized care and concern, the ability to anticipate a customer‘s need and make him or her feel special.
Table 6 Empathy
No. Items Mean SD Descriptive Level
1. understanding the specific needs of the students
3.16 1.04 Moderate
2. showing concern or care for the students
2.95 0.87 Moderate
3. asking students in a nice and cheerful manner.
3.22 1.02 Moderate
4. showing kindness to students
3.23 1.06 Moderate
5. being approachable and friendly to students
3.22 1.07 Moderate
Overall Mean 3.15 0.86 Moderate
4.6 Summary on the Level of Canteen Service Quality
Displayed in Table 7 is the summary on the level of canteen service quality in terms tangibility, assurance, reliability, responsiveness, and empathy. The mean ratings of the indicators are as follows: assurance (3.25); reliability (3.23); responsiveness (3.22); tangibility (3.18); and empathy (3.15). The overall mean rating of canteen service quality is (3.21) which means moderately satisfactory. It means that canteen services manifested with assurance, reliability, responsiveness, tangibility and empathy as perceived by the
students. Although, the level of canteen service quality is neither high nor low, a moderate satisfaction is good enough already. The results mean that the students perceived the canteen service quality as moderately satisfactory in all its domains namely tangibility, assurance, reliability, responsiveness, and empathy. This implies that canteen service quality still needs to be addressed in order to better serve its student customers.
Table 7 The Level of Canteen Service Quality
No. Indicators Mean SD Descriptive Level
1. Tangibility 3.18 0.81 Moderate
2. Assurance 3.25 0.84 Moderate
3. Reliability 3.23 0.80 Moderate
4. Responsiveness 3.22 0.86 Moderate
5. Empathy 3.15 0.86 Moderate
Overall Mean 3.21 0.75 Moderate
4.7 Student Satisfaction
Displayed in Table 8 is the data on the level of student satisfaction in the school canteen of Mintal Comprehensive High School. The mean ratings are as follows: the products displayed in the canteen are presentable, clean, and contain the required nutritional value (3.72) or very satisfied; the canteen staffs entertain student customers promptly and without any delay (3.69) or very satisfied; the canteen staffs wear hair net and gloves to observe cleanliness in the preparation and handling of foods (3.46) or moderately satisfied; the canteen personnel are friendly and accommodating (3.41) or moderately satisfied; the canteen is strategically situated in a place where it is accessible and convenient to all students (3.05) or moderately satisfied; the utensils, tools, and equipment used in the canteen are sanitized or clean (3.21) or moderately satisfied; the canteen is well-organized and well-managed (2.87); the canteen cleanliness is well-maintained (2.79) or moderately satisfied; the ambiance in the canteen is good and refreshing (2.53) or not satisfied; and the foods in the canteen are affordable to the students (2.39) or not satisfied.
Table 8 The Level of Student Satisfaction
No. Items Mean SD Descriptive Level
1. The canteen personnel are friendly and accommodating.
3.41 1.09 Moderately Satisfied 2. The canteen personnel wear hair
net and gloves to observe cleanliness in the preparation and handling of foods.
3.46 0.69 Moderately Satisfied
3. The canteen personnel entertain student customers promptly and without any delay.
3.69 0.91 Very Satisfied
4. The utensils, tools, and equipment used in the canteen are sanitized or clean.
3.21 1.05 Moderately Satisfied
5. The products displayed in the canteen are presentable, clean, and contain the required
3.72 0.63 Very Satisfied
No. Items Mean SD Descriptive Level
1. keeping canteen staffs never bust to respond their student`s request
3.25 1.04 Moderate
2. providing prompt service 3.08 0.97 Moderate
3. having the heart to willingly serve and help the students
3.31 0.94 Moderate
4. providing good and quality service
3.23 1.09 Moderate
5. responding student‘s needs 3.23 1.11 Moderate
nutritional value.
6. The foods in the canteen are affordable to the students.
2.39 0.78 Not Satisfied 7. The canteen cleanliness is
well-maintained.
2.79 1.08 Moderately Satisfied 8. The canteen is well-organized
and well-managed.
2.87 1.14 Moderately Satisfied 9. The ambiance in the canteen is
good and refreshing.
2.53 0.79 Not Satisfied 10. The canteen is strategically
situated in a place where it is accessible and convenient to all students.
3.05 1.05 Moderately Satisfied
Overall Mean 3.11 0.42 Moderately Satisfied
The abovementioned results mean that the student satisfaction in the canteen of Mintal Comprehensive High School is not high or low, but moderate only. Results show that students were satisfied with the products sold in the canteen and the promptness of serving by the canteen staffs. Besides, a moderate satisfaction is manifested in terms of canteen location, cleanliness, sanitation, organization, and management. The results are in accordance to the succeeding previous studies. Firstly, after reviewing the pass researchers about student satisfaction, researcher realized that students will evaluate the quality of service based on the cleanliness of canteen [2]. Secondly, a survey clarify that around 59% customers value cleanliness more than many other factors [5]. Thirdly, every owner of canteen should make many efforts to make sure that their canteen cleanliness is meeting the government regulation and expectation of customer. Lastly, Threevitaya [47] indicated that cleanliness of canteen were the number 1 concern for the students when they walk in a canteen. However, students were not satisfied with the ambiance of the canteen and the prices of the products displayed in the canteen. In other words, canteen is not that refreshing and good place for students to stay and dine with. Students were not agreeable to the prices set by the canteen management for these were so high and not affordable to students for they usually have meager allowance given by their parents. Further, this implies that the school administrator and canteen personnel may do some review on the prices of their canteen products as well as improve the ambiance where the canteen building is situated. The results with emphasis on dissatisfaction of students in terms of canteen ambiance was accentuated by Namkung and Jang [39] that ambiance of cafeteria or canteen plays a big part in customer satisfaction. This element is about comfortable seating arrangement that leave enough space for customer to move, or high quality design of the space and building, and also the suitable music. Besides that, Story, Kaphingst, Robinson-O'Brien, and Glanz [46] explained that the packaging of food, size and design of plate as well as lighting of the cafeteria will directly affect the individual‘s perception. Likewise, Purdue University conducted a research and they found out its recent Fred and Mary Ford cafeteria, which provided customer with a modern café ambience and variety of food attracted more students to patronize their dining court. Place with nice ambiance which decorated with high-end furniture and good choice of colors is the main factor that will build customer loyalty and getting students to come back time and time again to the dining place [13]. Furthermore, it can be gleaned from the result that
students are not satisfied with prices of the products sold in canteen. According to Soriano [45] that the level of a service quality can be determined based on the amount that paid for the service. Also, Klassen, Trybus, and Kumar [29] emphasized that purchase decision that made by students will consider about the price. The good value of price, portion size, reasonable price and overall value of dinning is categorized into price. Thus, when perceived price is low, the perceived satisfied will be low.
4.7 The Relationship between the Canteen Service Quality and Student Satisfaction
Presented in Table 9 is the correlational analysis showing the relationship between canteen service quality and student satisfaction in the school canteen of Mintal Comprehensive High School which obtained the overall computed r-value of 0.681 with an equivalent p-value of 0.039 at alpha 0.05 level of significance. Specifically, each domain of canteen service quality is tested for association with student satisfaction. The r-values are as follows: responsiveness (0.793) with p-value of 0.019; empathy (0.764) with p-value of 0.025; tangibility (0.732) with p-value of 0.036; reliability (0.653) with p-value of 0.044; and assurance (0.436) with p-value of 0.035. The data show that canteen service quality is associated with student satisfaction where the domains: responsiveness, empathy, tangibility, and reliability, show high positive correlations while assurance has obtained a low positive correlation.
Table 9 Correlation Analysis
Domains 1 2 3 4 5 6
1 -
Tangibility -
2 -
Assurance 0.668 -
3 -
Reliability 0.714 0.809 -
4 - Responsive ness
0.762 0.793 0.777 -
5 - Empathy 0.743 0.744 0.763 0.818 -
6 - Canteen Service Quality
0.864 0.894 0.902 0.925 0.907 -
7 - Student
Satisfaction
0.732
(p=0.036 )
0.436
(p=0.035 )
0.653
(p=0.044 )
0.793
(p=0.019 )
0.764
(p=0.025 )
0.681
(p=0.039 )
123 service quality and students‘ satisfaction. The study found that,
positive significant relationship between service quality dimensions (Tangibility, Reliability, Responsiveness, Assurance and Empathy) and students‘ satisfaction. Furthermore, Hanaysha, Abdullah, and Warokka [18], has also pointed out that, all the five dimensions of service quality were correlated with student satisfaction. In the meantime, the finding of the present study is consistent with the results of previous studies in terms of the direction of the relationship.
4.8 The Domains of Canteen Service Quality which Significantly Influence Student Satisfaction
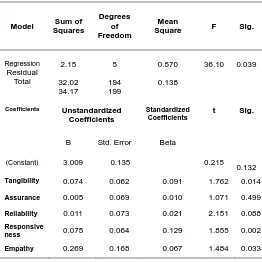
Reflected in Table 10 is the regression analysis showing the influence of canteen service quality on the student satisfaction of Grade 11 students of Mintal Comprehensive High School. Canteen service quality obtains an F-value of 36.10 with a computed p-value of 0.039 at alpha 0.05 level of significance. Since the overall p-value is less than 0.05 alpha level of significance, then, the null hypothesis is rejected and it could be stated therefore that canteen service quality significantly influence student satisfaction.
Table 10 Regression Analysis
Model Sum of Squares
Degrees of Freedom
Mean
Square F Sig.
Regression Residual
Total
2.15 5 0.570 36.10 0.039
32.02 194 0.138
34.17 199
Coefficients Unstandardized
Coefficients
Standardized
Coefficients t Sig.
B Std. Error Beta
(Constant) 3.009 0.135 0.215
0.132
Tangibility 0.074 0.062 0.091 1.762 0.014
Assurance 0.005 0.069 0.010 1.071 0.499
Reliability 0.011 0.073 0.021 2.151 0.088
Responsive
ness 0.075 0.064 0.129 1.855 0.002
Empathy 0.269 0.168 0.067 1.484 0.033
Furthermore, the domains of canteen service quality obtains the following p-values: tangibility (0.014); assurance (0.447); reliability (0.088); responsiveness (0.002); and empathy (0.033). Since the computed p-values of tangibility, responsiveness, and empathy are less than 0.05 alpha level of significance, then the null hypothesis is hereby rejected and it could be stated therefore that tangibility, responsiveness, and empathy contributed significantly on the student satisfaction. This implies that the two other domains, assurance and reliability, do not significantly influence student satisfaction. This also means that providing canteen service quality with high regard on tangibility, responsiveness, and empathy will most likely predict high level of student satisfaction. The
findings are allied in the result of the study by Usman [49] revealed that service quality have a significant impact on the students‘ satisfactory level. Likewise, Poturak [43] identified that, students have slightly positive opinion about the service quality. However, in the study of Kajenthiran and Karunanithy [26], only assurance and responsiveness significantly contribute to student satisfaction. Besides, tangibility, reliability, and empathy were not predictors of student satisfaction.
5.
SUMMARY,
CONCLUSIONS
AND
RECOMMENDATIONS
5.1 Summary
This study was conducted to determine the relationship of canteen service quality in relation to student satisfaction of Grade 11 students of Mintal Comprehensive High School, located at Mintal, Tugbok, Davao City. This study was conducted to 200 respondents, 90 males and 110 females, who were selected through random sampling technique. This made use of the non-experimental research design with mean, Pearson r and regression analysis as data analysis tools. The data were gathered through an adopted and validated questionnaire. The findings of the study were as follows:
1. The level of canteen service quality of Mintal Comprehensive High School had an overall mean rating of 3.11 or moderately satisfactory. This value was obtained based on the following indicators and their corresponding mean ratings: assurance (3.25) or moderately satisfactory; reliability (3.23) or moderately satisfactory; responsiveness (3.22) or moderately satisfactory; tangibility (3.18) or moderately satisfactory; and empathy (3.15) or moderately satisfactory.
2. The level of student satisfaction in the school canteen of Mintal Comprehensive High School is 3.21 or moderately satisfied.
3. There was a significant relationship between canteen service quality and student satisfaction with the r-value of 0.681 and computed p-r-value is 0.039. Specifically, the following domains of canteen service quality gained positive correlation on student satisfaction: responsiveness – r=0.793, p=0.019 or significant correlation; empathy – r=0.764, p=0.025 or significant correlation; tangibility – r=0.732, p=0.036 or significant correlation; reliability – r=0.653, p=0.044 or significant correlation; and assurance – r=0.436, p=0.035 or significant correlation. All p-values were less than alpha 0.05, therefore, the null hypothesis is rejected.
5.2 Conclusions
Based on the findings of the study, the following conclusions are drawn:
1. The level of canteen service quality of Mintal Comprehensive High School is moderately satisfactory.
2. The level of student satisfaction in the school canteen of Mintal Comprehensive High School is moderately satisfied.
3. There is a significant relationship between canteen service quality and student satisfaction at Mintal Comprehensive High School as perceived by the Grade 11 students.
4. The domains of canteen service quality significantly influence on the student satisfaction especially tangibility, responsiveness, and empathy.
5.3 Recommendations
Since the results showed that the canteen service quality is on the level of moderately satisfactory as well as the student satisfaction is moderately satisfied, then, the following recommendations are formulated:
1. The school administrators, canteen managers, and staffs may take action through designing and planning the necessary improvements of the school canteen and its services given to students and other customers.
2. The school canteen staffs may initiate feedback mechanism to continuously improve its services offered to entire school stakeholders.
3. The school canteen managers may also review the prices of the products that are affordable to students. 4. The school canteen staffs may also find ways to make
the canteen more presentable, clean, convenient and making its ambiance more comfortable and refreshing.
5. The students are also encouraged to patronize the school canteen and give constructive feedback to the school canteen managers and staffs which would serve as basis for improvement.
References
[1] Ali, A. Y. S., & Mohamed, A. I. (2014).Service Quality Provided by Higher Education Institutions in Somalia and Its Impact on Student Satisfaction. European Journal of Business and Management, 6(11), 143-148.
[2] Barber, N., & Scarcelli, J. M. (2010). Enhancing the Assessment of Tangible Service Quality through the Creation of a Cleanliness Measurement Scale. Managing Service Quality: An International Journal, 20(1), 70-88.
[3] Binge, C., Xufen, H., Guoying, L., Chunyue, W. & Tingting, Y. (2012). Impacts of campus food service on students‘ life: A anthropological case study of Shantou University. International Journal of China Marketing, 2(2), 123-143.
[4] Brassington, F., & Pettit, S. (2000).Principles of Marketing(2nd edition). London: Prentice Hall.
[5] Brewer, M. S., & Rojas, M. (2008). Consumer Attitudes toward Issues in Food Safety. Journal of Food Safety, 28(1), 1-22.
[6] Bryman, A., & Bell, E. (2003). Breaking down the quantitative/ qualitative divide. Business Research Methods, 465-478.
[7] Catena (2002). Descriptive correlation. Retrieved on
February 9, 2019 from
http://www.ncbi.nlm.njh.gov/pmc/articles/PMC309989 7.
[8] Chanaka, U., AW, W., & Achchuthan, S. (2014). An Assessment of Retail Service Quality: An Empirical Study of the RSQS in Sri Lankan Supermarkets. Developing Country Studies, 4(3), 78-90.
[9] Dehbidi, S. Y., Salimifard, K., & Abdollahzadeh, A. (2014). Evaluating the effective components on dimensions of quality in service organizations (A Fuzzy AHP Approach). Asian Journal of Research in Marketing, 3(1), 169-182.
[10] Elliott, K. M., & Healy, M. A. (2001). Key Factors Influencing Student Satisfaction Related to Recruitment and Retention. Journal of Marketing for
Higher Education, 10(4), 1–11.
doi:10.1300/J050v10n04_01
[11] Elliott, K. M., & Shin, D. (2002). Student satisfaction: An alternative approach to assessing this important concept. Journal of Higher Education Policy and Management, 24(2), 197–209.
[12] Evans, J. R. (2011). The management and control of quality (8th ed.). South-Western-Cengage Learning (USA).
[13] Field, A. (2013). Discovering Statistics Using IBM SPSS statistics. Sage. Food Service Director. (2005, February). James Pond, 18 (3).
[14] Gramling, L., Byrd, R., Epps, L., Keith, D., Lick, R. & Tian, R. (2005). Food service management and its impact on college operations: A business anthropological case study. Foodservice Research International, 16(1-2), 15-43.
[15] Gregoire, M. B.(2010). Food service organizations: A managerial and systems approach. 7th ed. New Jersey: Pearson Education.
125 [17] Gupta, S., & Zeithaml, V. (2006). Customer metrics
and their impact on financial performance. Marketing Science, 25(6), 718-739.
[18] Hanaysha, J., Abdullah, H. H., & Warokka, A. (2011). Service quality and students‘ satisfaction at higher learning institutions: The competing dimensions of Malaysian Universities‘ competitiveness. Journal of Southeast Asian Research, 1.
[19] Harr, K. K. L. (2008). Service dimensions of service quality impacting customer satisfaction of fine dining restaurants in Singapore.
[20] Hom, P. W., Lee, T. W., Shaw, J. D., & Hausknecht, J. P. (2017). One hundred years of employee turnover theory and research. Journal of Applied Psychology, 102(3), 530.
[21] Hom, W. C. (2002). Applying Customer Satisfaction Theory to Community College Planning of Counseling Services.iJournal.
[22] Japan External Trade Organization (JETRO). (2016). Operations Standards Manual (Restaurant Case). Los
Angeles. Retrieved from
https://www.jetro.go.jp/ext_images/en/reports/survey/p df/2015_03_biz4.pdf.
[23] Jashireh, A., Slambolchi, A., & Mobarakabadi, H. (2016). A literature review of service quality and customer satisfaction. Advanced Social humanities and Mangement, 3(2), 1-12.
[24] Jones, M. A., Taylor, V. A., Becherer, R. C., & Halstead, D. (2003). The impact of instruction understanding on satisfaction and switching intentions. Journal of Consumer Satisfaction, Dissatisfaction and Complaining Behavior, 16,10.
[25] Jun, M., Yang, Z., & Kim, D. (2004). Customers' perceptions of online retailing service quality and their satisfaction. International Journal of Quality & Reliability Management, 21(8), 817-840.
[26] Kajenthiran, K., & Karunanithy, M. (2015). Service Quality and Student Satisfaction: A Case Study of Private External Higher Education Institutions in Jaffna, Sri Lanka. Journal of Business, 1, 2.
[27] Kasper, H., Helsdingen, P. van, & Gabbott, M. (2006). Services marketing management (2nd ed.). Chichester, England: John Wiley and sons ltd.
[28] Kim, W. G., & Kim, H. B. (2004). Measuring Customer-based Restaurant Brand Equity. Cornell Hotel and Restaurant Administration Quarterly, 45(2), 115-131.
[29] Klassen, J. K., Trybus, E., & Kumar, A. (2005).
Planning Food Services for a Campus Setting. Hospitality Management, In Press.
[30] Kyoon Yoo, D., & Ah Park, J. (2007). Perceived service quality: Analyzing relationships among employees, customers, and financial performance. International Journal of Quality & reliability management, 24(9), 908-926.
[31] Kursunluoglu, E. (2011). Customer Service Effects on Customer Satisfaction and Customer Loyalty: A Field Research in Shopping Centers in Izmir City Turkey. International Journal of Business and Social Science, 2(17), 52-59.
[32] Lai, T. L. (2004). Service quality and perceived value's impact on satisfaction, intention and usage of short message service (SMS). Information Systems Frontiers, 6(4), 353-368.
[33] Lewis, R. C., & Booms, B. H. (1983).The marketing aspects of service quality. Emerging perspectives on services marketing, 65(4), 99-107.
[34] Lin, I. Y., & Mattila, A. S. (2010). Restaurant servicescape, service encounter, and perceived congruency on customers' emotions and satisfaction. Journal of hospitality marketing & management, 19(8), 819-841.
[35] Liu, Y. & Jang, S. (2009). Perceptions of Chinese restaurants in the US: What affects customer satisfaction and behavioural intentions? International Journal of Hospitality Management, 28(3), 338-348.
[36] Mauri, A. G., & Minazzi, R. (2013). Web reviews influence on expectations and purchasing intentions of hotel potential customers. International Journal of Hospitality Management, 34, 99-107.
[37] McWilliams, M. (2000). Foods: Experimental Perspectives (2nd ed.). New York: Measure Consumer Satisfaction. Hospitality Research Journal, 17(2), 63-74.
[38] Mohsan, F., Nawaz, M. M., Khan, M. S., Shaukat, Z., & Aslam, N. (2011). Impact of customer satisfaction on customer loyalty and intentions to switch: Evidence from banking sector of Pakistan. International Journal of Business and Social Science, 2(16).
[39] Namkung, Y., & Jang, S. (2008). Are Highly Satisfied Restaurant Customers Really Different? International Journal of Contemporary Hospitality Management, 20(2), 142-155.
thesis). Oklahoma State University, Stillwater, Oklahoma.
[41] Parasuraman, A., Zeithaml, V.A. and Berry, L.L. (1985).A conceptual model of service quality and its implications for future research. Journal of Marketing, 49(3), 41-50.
[42] Parasuraman, A., Zeithaml, V.A., and Berry, L. L. (1988) ‗SERVQUAL: a multiple-item scale for measuring consumer perceptions of service quality‘. Journal of Retailing, 64(1), 12-40.
[43] Poturak, M. (2014). Private universities service quality and students satisfaction. Global Business and Economics Research Journal, 3(2), 33-49.
[44] Rybarova, D. (2006). Descriptive and correlational studies. Retrieved on February 9, 2019 from http://www.u.arizona.edu/
[45] Soriano, D. R. (2003). The Spanish Restaurant Sector: Evaluating the Perceptions of Quality. The Service Industries Journal, 23(2), 183-194.
[46] Story, M., Kaphingst, K. M., Robinson-O'Brien, R., & Glanz, K. (2008). Creating Healthy Food and Eating Environments: Policy and Environmental Approaches. Annu. Rev. Public Health, 29(1), 253-272.
[47] Threevitaya, S. (2003). Factors that Influenced the Decisions of Customers to Dine at Selected Restaurants in Bangkok, Thailand (Doctoral dissertation, University of Wisconsin-Stout).
[48] Tsiotsou, R. (2005). Perceived quality levels and their relation to involvement, satisfaction, and purchase intentions. Marketing Bulletin, 16(4), 1-10.
[49] Usman, A. (2010). The Impact of Service Quality on Students‘ Satisfaction in Higher Education Institutes of Punjab. Journal of Management Research, 2(2).
[50] Van Ossel, G., Stremersch, S., & Gemmel, P. (2003). Customer satisfaction and complaint management. B van Looy, P Gemmel and R Van Dierdonck Services management: An Integrated Approach, London, Prentice hall 2nd edition.
[51] William, J. (2002). The student satisfaction approach: student feedback and its potential role in quality assessment and enhancement. 24th EAIR Forum, Prague, 8-11 September.
[52] Wilson, A. Zeithaml, V., Bitner, M.J. & Gremler, D. (2008). Services marketing: Integrating costumer focus across the firm. Maidenhead: McGrall Hill.
[53] Xu, Y., Goedegebuure, R., & Van der Heijden, B. (2007). Customer perception, satisfaction, and
customer loyalty within Chinese securities business: towards a mediation model for predicting customer behavior. Journal of relationship marketing, 5(4), 79-104.
[54] Yang, Z., & Fang, X. (2004). Online service quality dimensions and their relationships with satisfaction: A content analysis of customer reviews of securities brokerage services. International Journal of Service Industry Management, 15(3), 302-326.
[55] Zeithaml, V. & Bitner, M.J. (2003).Services Marketing,3rd ed., McGraw-Hill Irwin, Boston, MA
[56] Zopiatis, A., & Pribic, J. (2007). College students' dining expectations in Cyprus. British Food Journal, 109(10), 765-776.