Datawarehouse For Monitoring And Reporting Of
Inclusive Financial Agents
Ivan Ari Wibawa, Abba Suganda Girsang
ABSTRACT: The goals of the thesis were to develop a data warehouse which was loaded from operational database PT. XYZ, to analyze data warehouse with Tableau Software to resolve the problems faced by PT. XYZ on operational management of inclusive financial agents in terms of presenting reports more quickly and efficiently for reporting purposes to regulators. then this data warehouse is also needed to help the management of PT. XYZ in getting information to support the decisions that will be taken.
Keywords: Data warehouse, inclusive financial agents.
————————————————————
1.
INTRODUCTION
PT. XYZ is the largest commercial banking BUMN in Indonesia, PT. XYZ was established on December 16, 1895 in Purwokerto, Central Java. PT. XYZ remains consistent in providing services to the micro, small and medium enterprises (MSME) segments. In addition to staying focused on the MSME segment of PT. XYZ to continue to improve its services, PT. XYZ continues to expand its network of both conventional business units in the form of offices and in the form of electronics banking. Various electronic banking products have been developed that can be accessed through the internet, telephone, SMS, Automatic Teller Machine (ATM), Cash Recycle Machine (CRM), Electronic Data Capture. Besides that, PT. XYZ also began to develop a network with agency concepts (Branchless Banking). Branchless Banking is an expansion of PT. XYZ's financial services, where PT. XYZ collaborates with its customers as agents who can serve banking transactions for the community in real time online with the concept of revenue sharing. Services that can be served include withdrawals, deposits, transfers, bill payments, purchase of credit. PT. XYZ has partnered with 300,000 agents throughout Indonesia. LakuPandai is The branchless banking concept is also the implementation of the government program "Financial Services without Offices in the Context of Inclusive Financial Benefits During this time the processing and presentation of report data to regulators and to management is done manually by workers who are specifically dedicated to handling the reporting process. This condition causes a process that is less efficient in terms of providing human resources with an average workforce of 10 working days. Besides that manual workmanship is very vulnerable to human error. The company must also continue to prepare a cadre of workers dedicated to the work given that turnover and entry and exit of workers is very likely to occur. Based on the conditions above, the author tries to overcome the problem of how to process lakupandai agent data can be processed and presented more effectively and efficiently, thereby reducing the risk of fines or reprimand and increasing efficiency in the manufacturing process. In this case study, the author will use a data warehouse system approach to support the process of making and presenting reports in the company PT. XYZ
2.
LITERATURE
REVIEW
2.1. Data warehouse
Data warehouse is data collection process that is subject-oriented, integrated, time varied, and nonvolatile. It is used to support strategic decision-making process for an organization. Data warehouse contains the extraction of various corporate operating systems, each of which holds different records from every business transaction.[4] The data warehouse characteristics are as follows [5]
1) Subject-oriented, which covers the subject or main business entities in an organization such as the lecturers, students, subjects, grades, and curriculum. Data warehouse is designed to facilitate thorough analysis of data in a considerable amount. The data arranged by subject only contains important information for Decision Support System (DSS) processing. The information stored in the database is classified by particular subjects, for instance, in library case, members and books. The data in every subject is summarized into dimensions, such as time period; thus, historical data can be provided for analysis.[6]. Integrated, with the data collected from operational data and external data which are integrated in a data warehouse in order to get a single data base to support a decision. The data in data warehouse can be obtained from several separate sources. This data will be stored in the same segment in a specific and consistent format. The data in data warehouse is sourced from operational database (internal source) and from outside of the system (external source). Data warehouse can store the data from separate sources in a consistent and integrated format.[6] Time-variant, with the data that are collected in data warehouse contain time dimension to identify trend, predict future operations, and controlling operational target. Data warehouse stores historical data useful for analysis and decision-making. The data in data warehouse is characterized as series data in the form of time-variant historical data. This function is geared to perform trend analysis of the data. Some ways of looking into time interval in measuring the accuracy of a data warehouse include the following: a) presenting data warehouse at a particular time interval, which is the simplest one, b) using time variance presented within the data warehouse, either explicitly using time units, such as day, week, months and particular time or
_______________________________________________________
Ivan Ari Wibawa is currently pursuing masters degree program at Computer Science Department, BINUS Graduate Program-Master of Computer Science, Bina Nusantara University, Jakarta, Indonesia 11480. E-mail: ivan.wibawa@binus.ac.id
150 implicitly and c) using time variance presented by data
warehouse through a long set of snapshots.[6] Non-volatile, where the data available in data warehouse are not updated in real time, but refreshed regularly from the operational system. New data are always added to update the database. The data stored within a data warehouse cannot be changed. Unlike the data in the OLTP system, the data in a data warehouse is not updated in real time/continuously (by applying the insert, update and delete functions); the data can only be viewed or added with new data. In a data warehouse, only two data manipulation activities can be conducted, namely data loading (extracting data) and data access (accessing the data warehouse). The data in a data warehouse is uploaded on a periodic basis in the same period.[6]
2.2 Nine-step methodology
Data warehouse planning method used was based on the Nine-step methodology from Kimball. The steps were[11]: 1. Selection of the process: The data mart that is built first
must be the one that can be transferred in a timely manner and address all important business queries. Data mart is a database containing data that only describes segments of corporate operations.[10].
2. Identification of the grain: To decide for certain what is represented by a fact table. Grain is a process in which what will be described by a record in a fact table is determined.[12].
3. Identification and adjustment: A well-built dimension set, making it easy to understand and use data mart, this dimension is essential for describing the facts contained in a fact table. In this stage, an adjustment of dimension and grain presented in the form of a matrix is done.[13]. 4. Identification of facts: The source of a fact table
determines which facts are usable in the data mart. All facts must be expressed at a level predetermined by the source.
5. Storage of pre-calculation data in tables: Storing pre calculation in the fact table.
6. Declaring the dimensional table: In this stage, complete information is inserted into the dimensional table. Textual description is added to possible. dimensions too. The textual description must be easy for users to use and understand. [14].
7. Selection of database duration: For instance, in an insuring company, data must be stored for a duration of 10 years or more. Selection of duration of historical data belonging to a hospital can be performed according to the information need. In most cases, the more the data is transferred into a data warehouse, the more complete the information is generated. Attention should be paid to the duration of historical data by taking into account the existing data content and format. Care must be exercised so as to avoid transferring useless junk data.[13].
8. Tracking the dimensional changes slowly: Tracking slow dimensional change. The following are three types of slow
attributes of a dimension that has changed make new
has changed make an alternative, allowing the values of the old and new attributes to be accessed simultaneously at the same dimensions.
9. Determining priority and query mode: In this stage,
physical planning is required. The effect of physical planning, such as the sorting of the fact tables in the disk, and the location of initial storage of summaries or aggregate are taken into consideration. [13] All of the steps above should be taken before a data warehouse is implemented. The next stage is implementing simple data warehouse or data mart.[9]
2.3.DATA WAREHOUSE MODELING
Dimensional Model scheme that was used to develop the data warehouse in this study was Fact Constellation Scheme. This scheme is considered as constellation scheme since there is a dimensional table used simultaneously by one or more fact tables. [15] Fact Constellation Schema is a schema comprising several fact tables that share the same dimensional table. This schema can be viewed as a star constellation, thus it is often called the galaxy schema. [16] Fact constellation schema is more complex than star schema as it contains various fact tables. In fact constellation schema, one dimensional table can be used in several fact tables, thus requiring a more complex design. An advantage of fact constellation schema is its ability to model business more accurately using some fact tables. However, it is difficult to manage and has a complex design.[17]
2.4ETL PROCESS PLANNING
ETL process, or Extract, Transform, and Load, is a data processing that change it from OLTP database into data warehouse. ETL process is part of data staging. The process changes, re-formats and integrates data that are obtained from one or more OLTP systems [19]. ETL is a critical process in data warehousing. With ETL, the data from the operational activity can be inserted into the data warehouse. ETL can also be used for integrating data with the existing system. The purpose of ETL is to collect, filter, process and combine relevant data from various sources to be stored in the data warehouse. ETL process results in data that meets the data warehouse criteria, such as being historical, integrated, summarized, static and in a structure designed for analysis purpose. [20]
1. Extraction
The first stage of ETL process is to extract data from data sources. Most data warehouse projects combine data from different sources. There is a high chance that separate systems use different data formats. Extraction is converting data into a format which will be useful for transformation process.[20]
2. Transformation
Select certain columns to be inserted into the data warehouse;
Translate values in the form of code;
Encode the values into a free form (for example, map ―Male‖ as ―M‖ and ―Female‖ as ―F‖);
Conduct calculation of new values (for example, value
various sources;
Make a summary from some data rows; Generate surrogate key value;
Conduct transposing or pivoting (convert a set of columns into a set of rows, and vice versa);
Split a column into some columns
Use various forms of data validation, both simple and complex.
3. Loading
Loading is a process to transfer data physically from OLTP system into data warehouse. Loading phase is a stage in which data is inserted into the final target, mostly a warehouse data. How much time taken for this process will depend on the organization‟s need. [20].
2.5 Data Warehouse
The following are the tools used by users for various purposes after a Data Warehouse is established: [4]
1.
OLAP (On-Line Analytical Processing).OLAP is one of Data Warehouse tools used for data analysis. OLAP is a technology designed to provide superior performance for ad hoc business intelligence queries [21]. OLAP is designed to operate efficiently with data organized following general dimension models normally used in Data Warehouse. The following are ways in which OLAP is useful [5].
a). OLAP improves productivity of manager, executive and business analysis.
b). Effectively using OLAP enables users make their own analyses confidently without the help of IT assistance. c). OLAP greatly benefits IT developers, in that it is highly useful for improving the performance of their applications.
d). OLAP improves work efficiency. OLAP may be used for the following:[22]
2.
PentahoPentaho Kettle is open-source software released by Pentaho corp, which is based in Orlando, the United States. The main elements of Pentaho Kettle are transformation and job. Transformation is a set of instructions for converting input into desired output, while job is a set of instructions for executing transformation. [23]
3.
ReportingReporting tools are the tools used to help users retrieve historical or current data and undertake some statistical analysis standards [24]. The data generated from the reporting tools can take the form of either normal report or graphics. The tool used for reporting is Tableau.
Tableu is easy to use, especially in making data visualization, data analysis and reporting, owing to drag and drop system it
uses. Tableu is capable of combining data from various data sources, such as spreadsheet, database, cloud data and big data into one program to be used in a dynamic analysis. [25]
3. RESEARCH
METHODOLOGY
3.1 Research Steps
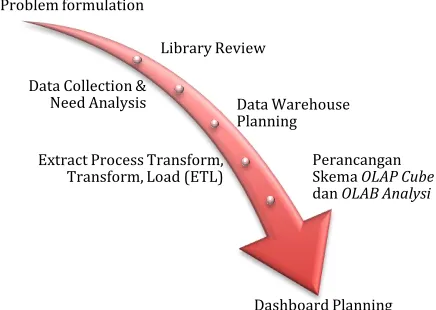
The description of the mindset in this study can be seen in this case study study at PT XYZ, beginning with the problems formulated in the solution to the existing problems. This formulation is supported by data collection and information and interviews. In addition, it is supported by some literature regarding several related studies that have been done before. The development of this data warehouse is done by nine step design methodology [1] using Pentaho software. Furthermore OLAP is used to analyze data according to the needs of PT XYZ. The final stage in the research carried out is to make a report and dashboard, so that it can facilitate decision making. The Figure 1 is a mindset in research:
Figure 1 Data warehouse Development
3.2 Preparation Stage
Preparation The first step taken in this research is to determine the problem formulation. Problems faced by PT. XYZ:
1. The length of the process of presenting data for reporting to regulators is because the process is done manually using microsof excel software for processing large amounts of data and related to multiple tables, this requires a long loading time. In addition, the manual process has the potential to cause human error so that the reporting process must be revised until there is absolutely no error. 2. Automation mechanism for data processing is
needed by utilizing the Date warehouse approach which is expected to generate reports quickly and efficiently.
3. Management of PT. XYZ requires an executive information system to facilitate and support the information and making the necessary decisions. By providing easy access to relevant information for
Problem formulation
Library Review
Data Collection &
Need Analysis Data Warehouse Planning
Extract Process Transform,
Transform, Load (ETL) Perancangan Skema OLAPCube dan OLABAnalysi
152 improving company performance. Reports are needed
that can help executives analyze, compare and highlight important variables so that they can monitor performance and identify opportunities and problems.
4. With the data warehouse, it is expected that PT. XYZ can benefit more from business intelligence to help identify, develop and create opportunities for new business strategies. Furthermore, it is expected to be able to implement an effective strategy to gain competitive market benefits and long-term stability
3.3 Collecting Data
After the formulation of the problem is determined, the next step is collecting data. The data needed is data agent and transactions on January to December 2018, Data collection techniques used in this study are:
a. observation b. Interview
c. Study of literature.
Based on the results of the design of the data warehouse that has been carried out through the nine-step design methodology, a star scheme is obtained consisting of 2 fact tables and several dimension tables identified as figure 2:
Figure 2 Star Schema Lakupandai
4.
RESULT
AND
DISCUSSION
4.1 Implementation of Data warehouse
1. Extraction: In this step, the data was imported from xml file into mysql database, Creating new database and tables using mysql, Importing the available data into the new database.
2. Transformation: there were 3 steps performed in this process:
a. Data selection: Selecting data from extraction results
(student, subject, batch, and grade).
b. Data cleaning: Noise was cleaned at this step by manipulating empty or incomplete data. c. Splitting/Joining: At this step, manipulation and
joining of data were performed based on the fact tables developed previously (example: merging/joining students table with subjects table or students table with grades table, etc.)
2. Loading: This process is the last stage in ETL. Cleaned data were stored in data warehouse. The output was in the form of transformed data from Pentaho that was stored in mysql database
4.2 Implementation of Tableau tools
1. This report is intended for management to obtain information on the development of lakupandai from year to year. This is needed to measure performance and project year-on-year targets. Figure 3 shows the growth of lakupandai.
Figure 3 Lakupandai Growth
2. Management makes it possible to obtain information on lakupandai distribution by province. To find out the development and business potential of each province in Indonesia as shown Figure 4
3. Management makes it possible to obtain information on lakupandai distribution by province. To find out the development and business potential of each province in Indonesia as shown Figure 5
Figure 5 Distribution Lakupandai
4. To find out the transaction performance of the cover agent of each regional office, a Transaction report is required based on the achievement of transactions per Regional Office as shown Figure 6
Figure 6 Transaction Lakupandai
5. The management requires a report in the form of an analysis of the area's potential in the form of a map, which can represent the linkages between the conditions of the region and the performance of the intelligence agency. For example, in the province of Aceh, the North Sumatra agents are performing well in coastal areas or close to the coast as shown Figure 7.
Figure 7 Regional Potential Lakupandai
5.
C
ONCLUSIONSFrom the results of designing the data warehouse, OLAP, report and reort analysis, the following are conclusions that can be taken With the data warehouse, PT. XYZ can quickly present report data intended for regulators so that potential reprimand and fines can be minimized and The data warehouse, which has been built to assist the management of PT. XYZ in making decisions, decisions taken will be based on analysis of data and reports provided from the data warehouse. The designed Lakupandai warehouse data is considered to have been quite helpful and provides added value for PT. XYZ in carrying out its business operations. However, there are a number of considerations to make it better by adding more in-depth analysis features.
LIST
OF
REFERENCES
[1]. Kimball R., & Caserta, J. (2004). The Data Warehouse ETL Toolkit: Pratical Techniques for Extracting, Cleaning, Conforming and Delivering Data. Indianapolis: Wiley Publishing.
[2]. Connolly, T., & Begg, C. (2010). Database Systems: A Practical Approach to Design, Implementation, and Management, Fifth Edition. Pearson Education, Boston
[3]. El-Sappagh, S.H, Hendawi, A. M., & Bastawissy, A. H. (2011). A Proposed Model for Data warehouse ETL Processes. Journal of King Saud University - Computer and Information Sciences, 23(2), 91-104.
[4]. Gothwal, M. (2014). Analysis of Data Warehousing, Data Mining, OLAP, OLTP Technologies. International Journal of Innovative Research in Technology,1(6),979-983.
154 2016.
[6]. H. B. Seta, T. Wati, and I. N. Isnainiyah, ―Perancangan Data Warehouse pada Perpustakaan UPN „ Veteran ‟ Jakarta Data Warehouse Development for UPN „ Veteran ‟ Jakarta Library,‖ vol. 2, no. 2, pp. 161–166, 2017.
[7]. P. Ponniah, Data Warehousing Fundamentals: A Comprehensive Guide for IT Professionals, vol. 6. 2001. [8]. J. Sistem and A. Cucus, ―Fakultas Ilmu Komputer.‖ [9]. A. Sudrajat, ―Pengembangan Data Warehouse Call
Center Dengan Metodologi Kimball NineStep Pada Bina Saran Informatika,‖ Informatika, vol. II, no. 2, pp. 345– 361, 2015.
[10]. V. N. September and A. Gui, ―ISSN : 2087-1244 ( Print ) Volume 6 No . 3 September 2015 Computer , Mathematics and Engineering Applications ComTech Computer , Mathematics and Engineering Applications,‖ vol. 6, no. 3, 2015.
[11]. A. Prasetyo, B. w Soedijono, and A. Amborowati, ―Perancangan Data Warehouse Untuk Mendukung Perencanaan Pemasaran Perguruan Tinggi,‖ J. Telemat., vol. 10, no. 1, pp. 1–22, 2017.
[12]. C. Hadis, ―PERANCANGAN DATA WAREHOUSE PADA RUMAH SAKIT ( STUDI KASUS : BLUD RSU KOTA BANJAR ) Kata Kunci : Data Warehouse , Nine Step Methodology , Skema , Rumah Sakit,‖ vol. 3, no. 2, 2017.
[13]. M. Suzana, Jemakmun, and Suyanto, ―Analisis Dan Perancangan Data Warehouse Rumah Sakit Umum Daerah Palembang Bari,‖ J. Ilm. Tek. Inform. Ilmu Komput., no. 12, pp. 1–14, 2013.
[14]. A. R. Diah Triesia,Debri Pramiarta, ―Perancangan Data Warehouse Pasien pada RS Muhammadyah Palembang,‖ no. Bisnis Intelejen, pp. 1–6.
[15]. R. Rezalini, P. S. W. Anggraeni, and R. Prasetianto, ―Perancangan Dan Pembuatan Data Warehouse Untuk Kebutuhan Sistem Pendukung Keputusan Di Bidang Akademik Pada Jurusan Sistem Informasi ,.‖
[16]. I. Tresnawati, E. Susilowati, D. Warehouse, and S. Schema, ―Implementasi Teknologi Olap Pada Sistem Pengolahan Data Penjualan,‖ Tinf-014, no. November, pp. 1–7, 2014.
[17]. Parsiyono, Kusrini, and A. Sunyoto, ―Perancangan Data Warehouse Akademik Di Sekolah Tinggi Agama Buddha Semarang,‖ vol. 1, no. 2, pp. 44–51, 2015. [18]. S. Darudiato, ―Perancangan Data Warehouse Penjualan
Untuk Mendukung Kebutuhan Informasi Eksekutif Cemerlang Skin Care,‖ SemnasIF, vol. 2010, no. semnasIF, pp. 350– 359, 2010.
[19]. R. Pratama, S. R. Sucimdpgmailcom, A. Rahman, and J. T. Informatika, ―Perancangan Data Warehouse Pemetaan Data Siswa Pada Disdikpora Kota Palembang,‖ Peranc. Data Wareh. Pemetaan Data Siswa Pada Disdikpora Kota Palembang, vol. 1, pp. 1– 9, 2012.
[20]. G. Wijaya, ―Perancangan Data Warehouse Nilai Mahasiswa dengan Kimball Nine-Step Methodology,‖ J. Inform., vol. 4, no. 1, pp. 1–11, 2017.
[21]. F. Ardanu, H. Himawan, and D. B. P, ―PEMANFAATAN TEKNOLOGI DATA MINING DALAM MENENTUKAN EFEKTIFITAS PENYEBARAN BROSUR,‖ 2013. [22]. A. Supriyatna, ―Sistem Analisis Data Mahasiswa
Menggunakan Aplikasi Online Analytical Processing
(Olap) Data Warehouse,‖ vol. XII, no. 1, pp. 62– 71, 2016.
[23]. T. Pustaka, ―Analisis Dan Perancangan Data Warehouse Perpustakaan (Studi Kasus : Perpustakaan Universitas Binadarma Palembang),‖ vol. 2015, no. November, pp. 43– 48, 2015.
[24]. U. Fadilah, W. W. Winarno, A. Amborowati, U. Fadilah, W. W. Winarno, and A. Amborowati, ―Perancangan Data Warehouse Untuk Sistem Akademik STMIK Kadiri Data Warehouse System Design for Academic STMIK Kadiri,‖ vol. 6, no. 2, pp. 217–228, 2016.
[25]. R. Akbar, A. Soniawan, R. Dinur, J. Adrian, R. Azim, and A. Zikri, ―Implementasi Business Intelligence untuk Menganalisis Data Persalinan Anak di Klinik Ani Padang dengan Menggunakan Aplikasi Tableau Public,‖ J. Online Inform., vol. 2, no. 1, pp. 20–24, 2017.
[26]. D. Dharmayanti, A. M. Bachtiar, and A. Heryandi, ―Pemodelan Data Warehouse,‖ vol. 12, no. 2, pp. 151–168, 2013.