Infant Susceptibility of Mortality to Air Pollution in Seoul, South Korea
Eun-Hee Ha, MD, PhD*; Jong-Tae Lee, PhD*; Ho Kim, PhD‡; Yun-Chul Hong, MD, PhD§; Bo-Eun Lee, MPH*; Hye-Sook Park, MD, PhD*; and David C. Christiani, MD, MS㛳
ABSTRACT. Objective. Susceptibility of target popu-lations to air pollution is an important issue, because air pollution policies and standards should be based on the susceptibilities of those at particular risk. To evaluate which age group is more susceptible to the adverse health effects of air pollution, we compared the effects of air pollution on mortality among postneonates, those aged 2 to 64 years, and those over 65 years of age.
Design. Daily counts of total and respiratory death along with daily levels of meteorological variables and air pollutants were analyzed using generalized additive Poisson regression. The relative risks (RR) of mortality for interquartile changes of the levels of particulate mat-ter<10m (PM10) were calculated on the same day.
Results. For postneonates, the RR of total mortality for an interquartile change (42.9 g/m3) in PM
10 (RR:
1.142; 95% confidence interval [CI]: 1.096 –1.190) was greatest among age groups. Next were the elderly over 65 years of age (RR: 1.023; 95% CI: 1.022–1.024). Regarding respiratory mortality, RR for an interquartile change of PM10 in postneonates (RR: 2.018; 95% CI: 1.784 –2.283)
was also greater than those in the other groups.
Conclusions. These results agree with the hypothesis that infants are most susceptible to PM10 in terms of
mortality, particularly respiratory mortality. Pediatrics 2003;111:284 –290; infant mortality, air pollution, PM10, Seoul.
ABBREVIATIONS. TSP, total suspended particle; CO, carbon monoxide; NO2, nitrogen dioxide; SO2, sulfur dioxide; O3, ozone; RR, relative risk; PM10, particles⬍10m in aerodynamic diame-ter; ppm, parts per million; ppb, parts per billion; CI, confidence interval.
I
t has long been known that air pollution is asso-ciated with adverse health effects, morbidity, and mortality among humans.1–3In particular, the el-derly, infants, and persons with chronic cardiopul-monary disease, influenza, or asthma are considered susceptible to air pollution.4,5 Several studies of the effects of air pollution on mortality and morbidityhave supported this susceptibility among the elder-ly.1,6 – 8 The increased mortality in London in 1952 was higher among the elderly, in terms of deaths from respiratory and cardiovascular diseases.1 Simi-lar findings have been also reported in Philadelphia,1 Mexico,6Edinburgh,7and Quebec.8In terms of effect size, the risk of mortality was about 3 times greater in persons older than 65 years of age than in persons younger than 65 for the increase of the total sus-pended particle (TSP) concentrations.1
Much of the evidence on susceptibility to air pol-lution involves its effects on the elderly population. However, there is less evidence about the suscepti-bility of infants to air pollution, although effects of air pollution on infants have more implications than those on any other age groups. Recently, a number of studies have dealt with mortality associated with air pollution, and have found that infants would be more susceptible to air pollution than the general population.5,9 –11 In addition, Pope et al4 reported that earlier age of onset of the effects of fine particles result in greater overall loss of life, using the survival curve.
In response to air pollution exposure, different age groups may respond differently.12Who is at risk or who is more susceptible to the adverse health effects of air pollution is an important question for air pol-lution management. However, the question of which age group is more susceptible to the adverse health effects of air pollution has not been fully considered. In this study, we compared the effect of air pollution on mortality among postneonates, those aged 2 to 64 years, and on those over 65 years of age.
METHODS Mortality Data
Daily records of mortality in Seoul were obtained from the Korean National Death Registry for the period January 1995 to December 1999. It provided the date of birth, place of residence, date of death, and the underlying cause. We used the code of the
International Classification of Diseases, 10th Revisionfor the cause of death. Daily counts of total mortality were divided into 3 age groups: 1) aged 1 month to 1 year (postneonates), 2) aged 2 to 64 years, and 3) those over 65 years of age. We excluded neonates from this analysis, because neonates are influenced easily by peri-natal conditions.13We also excluded accidental deaths. In addition to total mortality, we calculated mortality from respiratory disease for each age group.
Exposure Assessment
Seoul is the largest metropolitan city in the country and is divided into 25 administrative areas. It has a distinct 4-season climate, and the major air pollution sources are the automobile exhaust and domestic heating. The Ministry of Environment pro-vided data on air pollution.
From the *Department of Preventive Medicine, College of Medicine, Ewha Medical Research Center, Ewha Womans University, Seoul, South Korea; ‡Department of Epidemiology and Biostatistics and Institute of Health and Environmental Sciences, School of Public Health, Seoul National University, Seoul, South Korea; §Department of Occupational and Environmental Med-icine, College of MedMed-icine, Inha University, Incheon, Korea; and㛳 Depart-ment of EnvironDepart-mental Health, Harvard School of Public Health, Boston, Massachusetts.
Received for publication Dec 27, 2001; accepted Jul 1, 2002.
Reprint requests to (E-H.H.) Department of Preventive Medicine, College of Medicine, Ewha Womans University, 911–1, Mok-6-Dong, Yangcheon-Gu, Seoul, South Korea 158–710. E-mail: eunheeha@ewha.ac.kr
Exposure measurements during the study period were taken from 27 monitoring sites, which represented all administrative areas. Measurements of particles⬍10m in aerodynamic diam-eter (PM10;-ray absorption method), carbon monoxide (CO; non-dispersive infrared photometry), nitrogen dioxide (NO2; chemilu-minescence), sulfur dioxide (SO2; ultraviolet photometry), and ozone (O3; ultraviolet photometry) were undertaken hourly. Twenty-four-hour pollutant concentration averages were con-structed for the measurement sites. In the case of ozone, a daytime 8-hour average was used instead of a 24-hour average. Meteoro-logical information from a station in the central part of Seoul was obtained from the National Meteorological Office. This included 24-hour average temperature and relative humidity.
Except for occasionally missing or excluded observations, data for air pollution and meteorological parameters were available for the period from January 1, 1995, to December 31, 1999.
Statistical Analysis
The mortality and exposure data were merged to create an analysis file with days as the units of observation. To compare the mortality among age groups, age-stratified analyses were per-formed for both total and respiratory mortality. To allow for nonlinear relations between mortality and predictor variables, we used a generalized additive model.14To control long-term trends, seasonality, and meteorological influences (temperature and rela-tive humidity), we used smoothing parameters with LOESS (lo-cally-weighted smoother) function in S-PLUS.15 The Loess smoother that was used in this study has particular local behavior and therefore picked up awkward shapes in the data well.16
Dummy variables were used to allow for day-of-the-week and holiday effects. We added the individual pollutant concentrations of the same day, 1 to 7 lagged-days, or moving averages from 1 to 5 days. Because the best fit was obtained by Akaike’s information criteria, the concentrations of the same day for air pollutants were used. We analyzed with the same day levels of air pollutants in the results. In addition, we inserted autoregressive terms in the model to remove serial correlations of residuals when the remaining variation has systematic pattern.12
To compare the effect magnitude of pollutants on mortality, we calculated the relative risk (RR) of total or respiratory mortality for interquartile changes of levels of PM10and other air pollutants for each age group.
RESULTS
In total, 1045 postneonates, 67 597 persons aged 2 to 64 years, and 100 316 elderly over 65 years died during the study period. The average deaths per day were 0.6, 37.1, and 54.9, respectively (Table 1).
Table 2 shows summary statistics of air pollution and weather in Seoul from 1995 to 1999. The 24-hour mean concentrations were 1.2 parts per million (ppm) for CO, 32.5 ppb for NO2, 11.1ppb for SO2, and 69.2 g/m3 for PM
10. The 8-hour average O3 level was 21.2 parts per billion (ppb).
Table 3 shows the correlation matrix for the air
TABLE 1. Descriptive Statistics of Mortality Variables, Seoul, 1995–1999
Variables Daily Death
(Mean⫾SD)
Total Death
Mortality Rate*
All causes
Postneonatal deaths 0.6⫾0.8 1045 772.8
Deaths⬍65 37.1⫾9.2 67 597 695.7
Deathsⱖ65 54.9⫾9.0 100 316 20 726.9
Respiratory causes
Postneonatal deaths 0.04⫾0.2 71 52.5
Deaths⬍65 1.2⫾1.1 2194 22.6
Deathsⱖ65 4.1⫾2.3 7573 1564.7
SD indicates standard deviation.
* Mortality rate per 105person-years, standardized 1997 population in Seoul, South Korea.
TABLE 2. Summary Statistics of Air Pollution and Weather Information, Seoul, 1995–1999 Variables PM10
(g/m3)
NO2 (ppb) SO2 (ppb) CO (100 ppb) O3 (ppb) Temp* (°C) Humid† (%)
N‡ 1763 1825 1825 1825 1825 1826 1826
Mean 69.2 32.5 11.1 11.6 21.2 12.9 63.2
SD 31.6 10.3 7.0 4.7 11.6 10.1 14.5
Minimum 10.5 10.2 2.4 3.9 2.9 ⫺11.9 18.8
Lower quartile 44.8 24.8 6.2 8.2 12.3 4.0 53.0
Median 64.2 31.4 8.9 10.5 19.4 14.4 64.0
Upper quartile 87.7 39.7 14.0 14.0 28.4 22.1 73.8
Maximum 245.4 65.1 46.0 33.8 69.1 30.4 96.1
SD indicates standard deviation. * Mean temperature of the day. † Relative humidity.
‡ Number of days of observation.
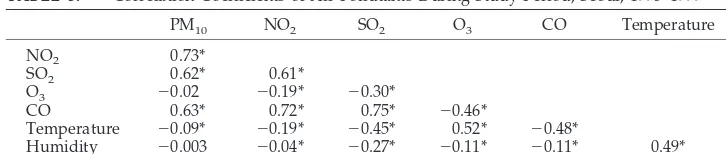
TABLE 3. Correlation Coefficients of Air Pollutants During Study Period, Seoul, 1995–1999
PM10 NO2 SO2 O3 CO Temperature
NO2 0.73*
SO2 0.62* 0.61*
O3 ⫺0.02 ⫺0.19* ⫺0.30*
CO 0.63* 0.72* 0.75* ⫺0.46*
Temperature ⫺0.09* ⫺0.19* ⫺0.45* 0.52* ⫺0.48*
Humidity ⫺0.003 ⫺0.04* ⫺0.27* ⫺0.11* ⫺0.11* 0.49*
pollutant concentrations during the study period. The concentrations of CO, NO2, SO2, and PM10were positively correlated with each other (0.61 ⬍ r ⬍
0.73). However, the concentration of O3 was nega-tively correlated with the other pollutants.
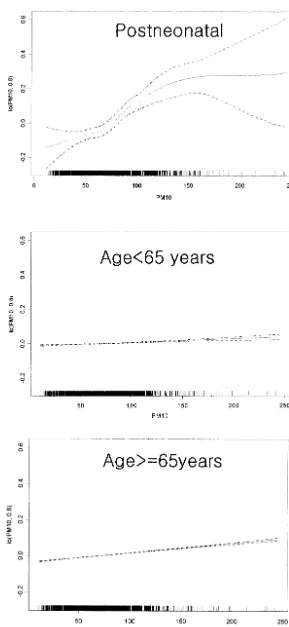
Figure 1 shows plots of the relation between air
pollutants and total death by age group. To allow direct comparison of the slope, the scale of Y axes are the same. For all age groups, total deaths increased with concentrations of PM10. In particular, the effect of PM10on total mortality in postneonates was much greater than those in the other groups. The RR of
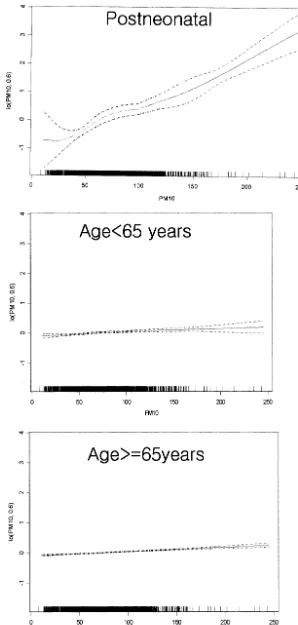
total mortality for an interquartile change of PM10 was calculated on the same day (Table 4). For post-neonates, RR of total mortality (RR: 1.142; 95% con-fidence interval [CI]: 1.096 –1.190) for PM10was high-est among the age groups. This was followed by RR in the old age group over 65 (RR: 1.023; 95% CI: 1.022–1.024), and the least affected was the age 2 to 64 age group (RR: 1.008; 95% CI: 1.006 –1.010). Figure 2 shows plots of the relation between air pollutants and respiratory deaths by age group. For respiratory disease, the relation between air pollutants and deaths are consistent with the result for total mortal-ity. With respect to the effect size (Table 5), RR of respiratory mortality for an interquartile change of PM10 in postneonates (RR: 2.02; 95% CI: 1.78 –2.28) was greater than that of total mortality. In addition, CO levels were significantly associated with respira-tory-specific death, and the magnitude of risk was also largest in postneonates (RR: 1.39; 95% CI: 1.01– 1.91).
DISCUSSION
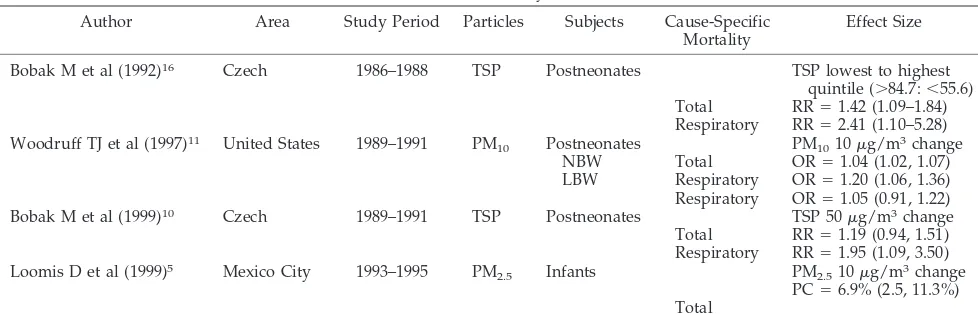
Researches in several countries have shown that infants are considered particularly susceptible to par-ticulate air pollution (Table 6). Annual infant mortal-ity rates in the Czech Republic were associated with annual average concentrations of TSP.10,17 In the United States, the odds ratio of overall postneonatal mortality in 86 cities was 1.04 for each 10g/m3rise in PM10,11and in Mexico City, excess infant mortality was associated with the level of environmental fine particles in the days before death.5
In this study, we found that postneonatal infants are most susceptible to PM10 in terms of mortality, especially of respiratory mortality. Postneonatal mortality increased by 14.2% for each 42.9 g/m3 rise in PM10.Although mortality of other groups was significantly associated with PM10, the effect size was smaller, 0.8% in persons aged 2 to 64 years and 2.3% in those over 65. Regarding the cause of death for postneonatal infants, PM10 had a greater effect on respiratory mortality than on total mortality, with an estimated risk ratio of 2.02 (95% CI: 1.78 –2.28). This finding is consistent with the analyses of Bobak,10,16 who found that the effects of TSP on postneonatal mortality were greater and specific for respiratory causes.
Particulate air pollution is known to invoke alve-olar inflammatory mediators and to increase blood viscosity, thereby leading to acute episodes of respi-ratory or cardiac death.18 –23 Many studies on air
pollution and mortality among adults or the elderly have dealt with respiratory mortality and cardiac mortality.6,8,24An association between PM
2.5and re-spiratory mortality was found in Quebec among in-dividuals older than 65 years at the time of death.8 Similar patterns were observed for respiratory deaths associated with fine particles 4 days previ-ously in Mexico City.6 In Philadelphia, the risk of chronic obstructive pulmonary disease mortality as-sociated with TSP was 3 times the risk of all-cause mortality.1The mortality associated with increases in PM10has been attributed to the exacerbation of pre-existing lung disease in older individuals.25
Children or infants are reported to respond differ-ently to particulate exposure from adults. Particulate air pollution was positively associated with respira-tory hospital admission with bronchitis and asthma among children.12,13,26 –28 We hypothesized that in-fants are more vulnerable to respiratory disease lead-ing to death from particulate air pollution, because the infant lung and immune system is immature and unable to control adequately the inflammation re-sulting from exposure to ambient particle.12Several studies indicated that the effects of air pollution on postneonatal respiratory mortality were greater than those on all-cause mortality. Expressed per 50g/m3 increase in TSP, the adjusted rate ratios for postneo-natal respiratory mortality were 2.11 (95% CI: 1.35– 3.29) and 1.95 (95% CI: 1.09 –3.50) in 2 Czech stud-ies10,16 and 1.58 (95% CI: 1.16 –2.11) in the United States.11 These rate ratios are close to the increased risk of postneonatal respiratory mortality found in our analysis, which was 2.02 (95% CI: 1.78 –2.28) for an increase of 42.9g/m3in PM
10.
In addition, our study showed that the increase in respiratory mortality was associated with CO expo-sure, and the risk estimates were also largest in post-neonates. In agreement with this finding, Conceicao et al also reported that CO level was associated with mortality attributable to respiratory disease in chil-dren under 5 years.29Saldiva et al30found increased risk for respiratory mortality in children exposed to high levels of CO, although it did not reach statistical significance.
Our study has some limitations.31–34First, environ-mental monitoring data do not necessarily represent individual exposures. However, this kind of mea-surement error is known to cause a bias toward the null and to underestimate pollution effects. Second, individual risk factors, such as underlying disease or exposure to smoking and infectious agents, were not
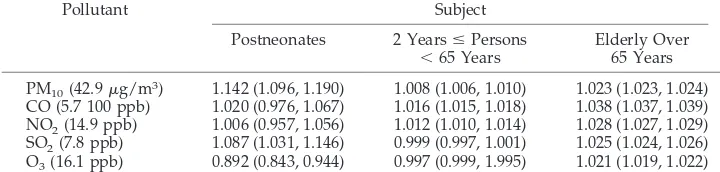
TABLE 4. RR and 95% CI in Total Mortality for an Interquartile Range Increase of the Same Day Levels of Air Pollutants, Seoul, 1995–1999*
Pollutant Subject
Postneonates 2 YearsⱕPersons
⬍65 Years
Elderly Over 65 Years
PM10(42.9g/m3) 1.142 (1.096, 1.190) 1.008 (1.006, 1.010) 1.023 (1.023, 1.024) CO (5.7 100 ppb) 1.020 (0.976, 1.067) 1.016 (1.015, 1.018) 1.038 (1.037, 1.039) NO2(14.9 ppb) 1.006 (0.957, 1.056) 1.012 (1.010, 1.014) 1.028 (1.027, 1.029) SO2(7.8 ppb) 1.087 (1.031, 1.146) 0.999 (0.997, 1.001) 1.025 (1.024, 1.026) O3(16.1 ppb) 0.892 (0.843, 0.944) 0.997 (0.999, 1.995) 1.021 (1.019, 1.022)
considered in this analysis. However, there is no reason to believe that daily variations in the individ-ual risk factors correlate with daily changes in air pollution; therefore, they are unlikely to be con-founders in this time-series study. Third, the main
cause of postneonatal death was congenital anoma-lies, which could confound the association between air pollution and mortality. We examined the asso-ciation between death attributable to congenital anomalies and air pollution, however, we could not
find any significant association between them (RR: 0.94; 95% CI: 0.84 –1.05). Therefore, it would not con-found the association between air pollution and mor-tality.
In addition, low temperature could be associated with excess deaths as well as air pollution episodes, confounding the association between air pollution and mortality. We controlled the short-term and pro-longed effects of low temperature by adding the temperatures of the same day in addition to the seasonal factor in the analysis.
To our knowledge, this is the first study to deter-mine that infants are the most susceptible age group after directly comparing with other age groups. This result has serious implications on the air pollution criteria, which should be based on the effects on infant health rather than adult health.
ACKNOWLEDGMENTS
This study was supported by grant 2000-0-219-003-2 from the Basic Research Program of the Korea Science and Engineering Foundation.
REFERENCES
1. Schwartz J, Dockery DW. Increased mortality in Philadelphia associated with daily air pollution concentrations.Am Rev Respir Dis.1992;145: 600 – 604
2. Dockery DW, Pope CA III, Xu X, et al. An association between air pollution and mortality in six US cities. N Engl J Med. 1993;329: 1753–1759
3. Pope CA III, Thun MJ, Namboodiri MM, et al. Particulate air pollution as a predictor of mortality in a prospective study of US adults.Am J Respir Crit Care Med. 1995;151:669 – 674
4. Pope CA III. Epidemiology of fine particulate air pollution and human
health: biologic mechanisms and who’s at risk?Environ Health Perspect.
2000;108(suppl 4):713–723
5. Loomis D, Castillejos M, Gold DR, McDonnell W, Borja-Aburto VH. Air pollution and infant mortality in Mexico City.Epidemiology. 1999;10: 118 –123
6. Borja-Aburto VH, Castillejos M, Gold DR, Bierzwinski S, Loomis D. Mortality and ambient fine particles in southwest Mexico City, 1993–1995.Environ Health Perspect.1998;106:849 – 855
7. Prescott GJ, Cohen GR, Elton RA, Fowkes FGR, Agius RM. Urban air pollution and cardiopulmonary ill health: a 14.5 year time series study.
Occup Environ Med.1998;55:697–704
8. Goldberg MS, Burnett RT, Bailar JC, et al. The association between daily mortality and ambient air particle pollution in Montreal, Quebec. En-viron Res.2001;86(section A):26 –36
9. Penna MLF, Duchiade MP. Air pollution and infant mortality from pneumonia in the Rio de Janeiro Metropolitan area.Bull PAHO.1991; 25:47–54
10. Bobak M, Leon DA. The effect of air pollution and infant mortality appears specific for respiratory causes in the postneonatal period. Epi-demiology.1999;10:666 – 670
11. Woodruff TJ, Grillo J, Schoendorf KC. The relationship between selected causes of postneonatal infant mortality and particulate air pollution in the United States.Environ Health Persp.1997;105:608 – 612
12. Braga ALF, Saldiva PHN, Pereira LAA, et al. Health effects of air pollution exposure on children and adolescents in Sao Paulo, Brazil. Pediatr Pulmonol.2001;31:106 –113
13. Gouveia N, Fletcher T. Respiratory diseases in children and outdoor air pollution in Sao Paulo, Brazil: a time series analysis.Occup Environ Med.
2000;57:477– 483
14. Hastie TJ, Tibshirani RJ.Generalized Additive Models. London, United Kingdom: Chapman & Hall; 1996
15. Venables WN, Ripley BD.Modern Applied Statistics With S-PLUS.3rd ed. New York, NY: Springer-Verlag New York, Inc; 1999
16. Hajat S, Anderson HR, Atkinson RW, Haines A. Effects of air pollution on general practitioner consultations for upper respiratory diseases in London.Occup Environ Med.2002;59:294 –299
17. Bobak M, Leon DA. Air pollution and infant mortality in the Czech Republic, 1986 – 88.Lancet.1992;340:1010 –1014
18. Abbey DE, Nishino N, McDonnell WF, et al. Long-term inhalable
par-TABLE 5. RR and 95% CI in Respiratory Mortality for an Interquartile Range Increase of the Same Day Levels of Air Pollutants, Seoul, 1995–1999*
Pollutant Subject
Postneonates 2 YearsⱕPersons
⬍65 Years
Elderly Over 65 Years
PM10(42.9g/m3) 2.018 (1.784, 2.283) 1.066 (1.044, 1.090) 1.063 (1.055, 1.072) CO (5.7 100 ppb) 1.388 (1.009, 1.911) 1.088 (1.064, 1.112) 1.073 (1.064, 1.081) NO2(14.9 ppb) 0.638 (0.429, 0.949) 1.074 (1.048, 1.101) 1.063 (1.053, 1.072) SO2(7.8 ppb) 0.818 (0.595, 1.126) 1.071 (1.044, 1.098) 1.009 (1.000, 1.018) O3(16.1 ppb) 1.226 (0.588, 2.558) 1.098 (1.068, 1.130) 1.037 (1.026, 1.048)
* Adjusted for seasonality, temperature, relative humidity, and day of week.
TABLE 6. Effect Sizes of Particulate Air Pollutants on Infant Mortality in Several Published Researches
Author Area Study Period Particles Subjects Cause-Specific
Mortality
Effect Size
Bobak M et al (1992)16 Czech 1986–1988 TSP Postneonates TSP lowest to highest
quintile (⬎84.7:⬍55.6) Total RR⫽1.42 (1.09–1.84) Respiratory RR⫽2.41 (1.10–5.28) Woodruff TJ et al (1997)11 United States 1989–1991 PM
10 Postneonates PM1010g/m3change
NBW Total OR⫽1.04 (1.02, 1.07)
LBW Respiratory OR⫽1.20 (1.06, 1.36) Respiratory OR⫽1.05 (0.91, 1.22)
Bobak M et al (1999)10 Czech 1989–1991 TSP Postneonates TSP 50g/m3change
Total RR⫽1.19 (0.94, 1.51) Respiratory RR⫽1.95 (1.09, 3.50) Loomis D et al (1999)5 Mexico City 1993–1995 PM
2.5 Infants PM2.510g/m3change
PC⫽6.9% (2.5, 11.3%) Total
ticles and other air pollutants related to mortality in nonsmokers.Am J Resp Crit Care Med.1999;159:373–382
19. Liao D, Creason J, Shy C, Williams R, Watts R, Zweidinger R. Daily variation of particulate air pollution and poor cardiac autonomic in the elderly.Environ Health Perspect.1999;107:521–525
20. Pope CA III, Verrier RL, Lovett EG, et al. Heart rate variability associ-ated with particulate air pollution.Am Heart J.1999;138:890 – 899 21. Gold DR, Litonjua A, Schwartz J. Ambient air pollution and heart rate
variability.Circulation.2000;10:1267–1273
22. Seaton A, MacNee W, Donaldson K, Godden D. Particulate air pollution and acute health effects.Lancet.1995;345:176 –178
23. Nolan J, Batin PD, Andrews R. Prospective study of heart rate variabil-ity and mortalvariabil-ity in chronic heart failure.Circulation.1998;98:1510 –1516 24. Goldberg MS, Burnett RT, Bailar JC III, et al. Identification of persons with cardiorespiratory conditions who are at risk of dying from the acute effects of ambient air particles. Environ Health Perspect. 2001; 109(suppl 4):487– 494
25. Schwartz J, Morris R. Air pollution and hospital admissions for cardio-vascular disease in Detroit, Michigan. Am J Epidemiol.1995;142:23–35 26. Ostro BD, Eskeland GS, Sanchez JM, Feyzioglu T. Air pollution and
health effects: a study of medical visits among children in Santiago, Chile.Environ Health Perspect.1999;107:69 –73
27. Lin CA, Martins MA, Farhat SC, Pope CA III, et al. Air pollution and
respiratory illness of children in Sao Paulo, Brazil. Paediatr Perinatol Epidemiol.1999;13:475– 488
28. Norris G, Young Poung SN, Koenig JQ, Larson TV, Sheppard L, Stout JW. An association between fine particles and asthma emergency de-partment visits for children in Seattle.Environ Health Perspect.1999;107: 489 – 493
29. Conceicao GM, Miraglia SG, Kishi HS, Saldiva PH, Singer JM. Air pollution and child mortality: a time-series study in Sao Paulo, Brazil.
Environ Health Perspect.2001;109(suppl 3):347–350
30. Saldiva PH, Lichtenfels AJ, Paiva PS, et al. Association between air pollution and mortality due to respiratory diseases in children in Sao Paulo, Brazil: a preliminary report.Environ Res.1994;65:218 –225 31. Brenner H, Savitz DA, Jockel K, Greenland S. Effects of nondifferential
exposure misclassification in ecologic studies.Am J Epidemiol.1992;135: 85–95
32. Morgensterm H. Use of ecologic analysis in epidemiologic research.
Am J Public Health.1982;72:1336 –1344
33. Gamble J. PM2.5 and mortality in long term prospective cohort studies: cause-effect or statistical associations?Environ Health Perspect.1998;106: 535–549
34. Kunzil N, Targer IB. Comments on PM2.5 and mortality in long term prospective cohort studies: cause-effect or statistical associations? Envi-ron Health Perspect.1999;107:234 –236
ODE TO A WORM
“When the Nobel Prize in Physiology or Medicine was awarded to 2 Britons and an American. . . it should also have gone to a fourth contributor that made their pioneering research possible, the tiny soil worm known asCaenorhabditis elegans, or
C elegansfor short. Over the past 3 decades, this unassuming creature has elbowed its way to the forefront of laboratory specimens, joining the legions of rats, mice, fruit flies, and bacteria that serve as convenient model organisms for studying the processes of life. . . The prize was awarded for a series of seminal discoveries by the 3 scientists about the ways genes regulate organ development and cell death. . .C elegans was the very first animal to have its genome deciphered, and there is a surprising amount of overlap with the human genome. We are a lot more like worms, genetically, than anyone imagined.”
New York Times.October 9, 2002
DOI: 10.1542/peds.111.2.284
2003;111;284
Pediatrics
and David C. Christiani
Eun-Hee Ha, Jong-Tae Lee, Ho Kim, Yun-Chul Hong, Bo-Eun Lee, Hye-Sook Park
Infant Susceptibility of Mortality to Air Pollution in Seoul, South Korea
Services
Updated Information &
http://pediatrics.aappublications.org/content/111/2/284
including high resolution figures, can be found at:
References
http://pediatrics.aappublications.org/content/111/2/284#BIBL
This article cites 32 articles, 4 of which you can access for free at:
Subspecialty Collections
http://www.aappublications.org/cgi/collection/respiratory_tract_sub
Respiratory Tract
http://www.aappublications.org/cgi/collection/pulmonology_sub
Pulmonology
following collection(s):
This article, along with others on similar topics, appears in the
Permissions & Licensing
http://www.aappublications.org/site/misc/Permissions.xhtml
in its entirety can be found online at:
Information about reproducing this article in parts (figures, tables) or
Reprints
http://www.aappublications.org/site/misc/reprints.xhtml
DOI: 10.1542/peds.111.2.284
2003;111;284
Pediatrics
and David C. Christiani
Eun-Hee Ha, Jong-Tae Lee, Ho Kim, Yun-Chul Hong, Bo-Eun Lee, Hye-Sook Park
Infant Susceptibility of Mortality to Air Pollution in Seoul, South Korea
http://pediatrics.aappublications.org/content/111/2/284
located on the World Wide Web at:
The online version of this article, along with updated information and services, is
by the American Academy of Pediatrics. All rights reserved. Print ISSN: 1073-0397.