EVALUATION OF NON-FUNCTIONAL
ATTRIBUTES USING WEB-BASED
ARCHITECTURE
Pragati Priyadarshinee
Chaitanya Bharathi Institute Of Technology, Hyderabad.
Dr Shekhar Verma, IIIT Allahabad
Abstract
The quality of an architectural design of a software system has a great influence on achieving non-functional requirements to the system. Here, we present a technique for describing behavioral aspects of software architectures formally based on Coloured Petri Nets (CPNs) and a technique for evaluating their non-functional qualities by analyzing CPNs . We provide quality models for evaluating security, efficiency and reliability, and integrate them with CPN descriptions of software architectures. Their qualities are evaluated by simulating the CPNs on CPN analysis tool called Design/CPN. It allows us to clarify trade-off on issues of selecting which architecture should be selected.
Keywords
Evaluation, Colored petrinets, Service oriented architecture, Reliability, Timeliness.
Objective
Petrinet Modeling is used to describe and analyze the synchronization, communication and resource sharing between concurrent processes. Different architectures like Client-server, Pipe and filter etc. are evaluated using colored petrinet. Some work has been done on Client-server architecture using petrinets.. But, web based architecture(S-O-A) is new to this field. So, in this paper some evaluation techniques are given to calculate the non-functional quality attributes like Reliability and Timeliness; in regard of Service Oriented Architecture.
1. Introduction:
A CPN Model consists of a set of modules which each contains a network of places, transitions and arcs. The modules interact with each other through a set of well-defined interfaces in a similar way as from many modern programming languages.CP-nets also has a formal ,mathematical representation with a well-defined syntax and semantics.Untimed CPN models are usually used to validate the functional or logical correctness of a system; where as timed CPN models are used to evaluate the performance of the system.
A technique is given over here which describes the behavioral aspects of software architecture for evaluating the non-functional qualities by analyzing Colored Petri Nets . Some quality models are provided for evaluating Reliability and Timeliness. The quality of an architectural design has a great influence on achieving performance, fault-tolerance and security.
2. Service-oriented-architecture based On CPNS
2.1:ServiceOrientedArchitecture
communication can involve either simple data passing or two or more services coordinating some activity. Some means of connecting services to each other is needed. Service-oriented architectures are not a new thing. The first service-oriented architecture for previously was with the use of DCOM or Object Request Brokers (ORBs) based on the CORBA specification.
2.2: What is petrinet modeling
In the early 60’s and 70’s petrinets were invented , and they are detected as being one of the most adequate languages for analysis of synchronisation, communication and resource sharing between concurrent processes. It has two serious drawbacks.
i) There are no concepts of data; therefore the models often became excessively large, because all data manipulation had to be represented directly into the net structure.
ii) There are no hierarchy concepts; therefore this was not possible to build a large model with a set of sub models with well-defined interfaces.
These two serious problems are removed in the development of high-level Petri nets in 70'ies and hierarchical Petri nets in 80'ies . Colored Petri Nets is one of the most well-known high-level Petri nets. CP-nets include both data structuring and hierarchical decomposition.
Colored Petri Nets (CP-nets or CPNs ) is a modeling language developed for systems in which communication, synchronization and resource sharing play an important role. CP-nets combine the strengths of ordinary Petri nets with the strengths of a high-level programming language. Petri nets provide the primitives for process interaction, while the programming language provides the primitives for the definition of data types and the manipulations of data values. CP-nets also have a formal, mathematical representation with a well-defined syntax and semantics. This representation is the foundation for the definition of the different behavioral properties and the analysis methods. Without the mathematical representation it would have been totally impossible to develop a sound and powerful CPN language. However, for the practical use of CP-nets and their tools, it suffices to have an intuitive understanding of the syntax and semantics. This is analogous to programming languages which are successfully applied by users who are not familiar with the formal, mathematical definitions of the languages.
A CPN model consists of a set of modules which each contains a network of places, transitions and arcs. The modules interact with each other through a set of well-defined interfaces, in a similar way as known from many modern programming languages. The graphical representation makes it easy to see the basic structure of a complex CPN model, i.e., understand how the individual processes interact with each other.
3. Specification of non-functional quality attributes
In this section, we illustrate quality attributes of non-functional requirements. Here, we mainly focus on reliability and timeliness , both of which are closely related to behavioral aspects of service-oriented-architecture [1].
1. Reliability 2. Timeliness
3.1: Reliability
A reliability value is calculated as an accumulation of the multiplication based on the failure probabilities [1]. According to the above figure the time for the firing sequences are given with the values. A reliability value is calculated as an accumulation of the multiplication based on the failure probabilities.
Here the result of the time stamps will be f which is the accumulation ratio. F denotes the failure ratio.
So, success ratio will be 1-F.
Final reliability depends upon the value of “f*(1-F)”. In Fig.1, t1 = informs = 1
t2 = orders = 2
t4 = controls = 3
And, t1.1 = t1.2 = t1.3 = includes.
Where the times of t1.1 = 0.5, t1.2 = 0.25 , t1.3 = 0.25
Non-functional Quality = w1 * f(x) + w2* g(x) Or ( ∑f(x) +∑g(x)) ⁄ n+ m
Where, w1 and w2 are the probabilities of firing sequence; f(x) and g(x) are the quality values.
n and m are the times. Hence,
(∑0.81+∑1+∑0.729+∑0.9) ⁄ 1+2+2+3= 0.871 Which is the value of “f”; it denotes the reliability. Reliability can be calculated as follows.
Reliability = f*(1-F)
Where, F= Failure ratio and (1-F) = Success Ratio. Suppose F=0.1
So, 1 –F =1.-0.1=0.9
Finally, Reliability = 0.871* 0.9 =0.7839 3.2: Timeliness
Time stamps are only referred for timeliness and the value of (t2-t1) is calculated.
Here, the differences between the time stamps are taken.
Timeliness = t2- t1 = 2 – 1 = 1
4. Related Work
4.1: PASA
PASA is a method for the performance assessment of software architectures [7]. It uses the principles and techniques of SPE [Williams and Smith 1998], [Smith and Williams 2002] to identify potential areas of risk within the architecture with respect to performanceand other quality objectives. If a problem is found, PASA also identifies strategies for reducing or eliminating those risks.
The PASA process consists of the ten steps summarized below.
1. Process Overview—The assessment process begins with a presentation designed to familiarize both managers and developers with the reasons for an architectural assessment, the assessment process, and the outcomes.
2. Architecture Overview—In this step, the development team presents the current or planned architecture.
3. Identification of Critical Use Cases —The externally visible behaviors of the software that are important to responsiveness or scalability are identified.
4. Selection of Key Performance Scenarios—For each critical use case, the scenarios that are important to performance are identified.
5. Identification of Performance Objectives—Precise, quantitative, measurable performance objectives are identified for each key scenario for each situation or performance study of interest.
6. Architecture clarification and discussion—Participants conduct a more detailed discussion of the architecture and the specific features that support the key performance scenarios. Problem areas are explored in more depth.
7. Architectural Analysis— The architecture is analyzed to determine whether it will support the performance objectives.
8. Identification of Alternatives—If a problem is found, alternatives for meeting performance objectives are identified.
9. Presentation of Results—Results and recommendations are presented to managers and developers.
4.2 Software architecture evaluation and modifiability [8]
It has been shown that SA constrains the achievement of various quality attributes in a software intensive system. One of the most important quality attributes is modifiability. Architecting applications in the face of uncertain requirements and creating flexible, modifiable architectures has drawn substantial attention from both industry and academia. Models for predicting modifiability at the architectural level have been proposed and validated in industrial settings [24]. However, these methods have not focused on reconstructing an architecture from an existing code base and evaluating its modifiability.
4.3 Software architecture reconstruction [8]
Software architecture reconstruction has its root in traditional software reverse engineering. Software reverse engineering has focused on program understanding and visualizing code structure and behavior at different abstraction levels. Architecture reconstruction requires more than program comprehension and code level analysis. This is because software architecture affects quality attributes, and these are mostly not directly expressed in an application’s source code. Architecture evaluations have the goal of evaluating important quality attributes.
Quality attribute driven architecture evaluation complements various architecture reconstruction methods .Consequently, architecture reconstruction requires the reconstructed model to incorporate architecturally significant concepts. These include architectural level components and connectors including COTS technologies, design patterns, component distribution information and architectural decisions as first class elements. These typically cannot be directly extracted from source code without input from software engineers/architects. This additional information must be constructed and expressed during the reconstruction process by producing models at different abstraction levels. Importantly, the mapping between levels must be retained and available during the architecture evaluation. However, the precise natures of the architectural level concepts that need to be constructed depend on the goals of the evaluation being undertaken - they can not in the general case be pre-determined.
4.4:- Reconstruction Tools and Design Metrics [8]
There is a range of existing tools that can contribute to anarchitecture reconstruction exercise. Substantial effort has alsobeen made in developing reconstruction tool frameworks to facilitate tool interoperability. Comparison studies have been performed to evaluate reverse engineering tools for program understanding and architectural recovery. These comparisons address the usability of the tools, the common views the tools can generate and the accuracy of their extraction.
5. Conclusion
A limited set of non-functional quality attributes like reliability and timeliness are calculated in this paper.. However in this approach other quality attributes can be evaluated; if the following conditions are satisfied. i) They can be calculated from some numerical factors.
ii) The numerical factors can be assigned to the components and connectors in the architecture.
iii) The calculation can be progressed according the execution of the architecture, i.e. the quality attribute values are decided during architecture execution.
References
[1] Kimiyuki Fukuzawa and Motoshi Saeki, Evaluating Software Architectures by Coloured Petri Nets, Proceedings of the 14th international conference on Software engineering and knowledge engineering , July 2002 .
[2] H. Gomaa and D. Menasce. Design and Performance Modeling of Component Interconnection Patterns for Distributed Software Architectures.In Proc. of WOSP 2000, pages 117–126, 2000
[3] ISO/IEC 9126. Information Technology – Software product evaluation – Quality characteristics and guidelines for their use, 1991. [4] K. Jensen. Coloured Petri Nets, volume 1-2. Springer- Verlag, 1992.
[5] E. Juan, J. Tsai, and T. Murata. Compositional Verification of Concurrent Systems Using Petri-Net -Based Condensation Rules. ACM Trans. On Programming Languages and Systems, 20(5):917–979,
[6] http://www.daimi.au.dk/designCPN
[7] PASASM: A Method for the performance assessment of Software Architecture Lloyd G. Williams Software Engineering Research 264 Ridgeview Lane Boulder, Colorado 80302 (303) 938-9847 [email protected] Connie U. Smith Performance Engineering Services PO Box 2640 Santa Fe, New Mexico, 87504-2640(505) 988-3811http://www.perfeng.com/.
Processing
Service Negotiating
Delivering Service
Reporting Status CUSTOMER
t1
t2
t3
t4
t1.1
t1.2
t1.3
Installing IT Component
Administrating Configuration
Administrating Service
Figure1. Sequence Diagram of SOA.
Firing Sequence Times Value
t1
t1
t1
t2<return>
t2<return>
t2
QUALITY VALUES
0.9
3
t4
0.729
2
t3
1
2
t2
0.81
1
t1=t1.1+
t1.2+t1.3
Values
Times
Sequence
Table1.Calculation of quality values
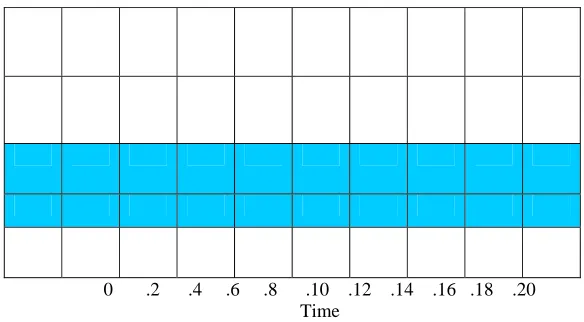
Sequences Times
T1 0.2
T2 0.4
T3 0.6
T4 0.8
T5 0.10
T6 0.12
T7 0.14
T8 0.16
T9 0.18
T10 0.20
0 .2 .4 .6 .8 .10 .12 .14 .16 .18 .20 Time
Table3. The reliability value increases uniformly in the graph. The colored portion in the graph indicates this.
Excessive
Data Loss Around 700%
0 100 200 300 400 500 600 700 800 900 1000
Percentage of data loss