Income Disparities and Cardiovascular
Risk Factors Among Adolescents
Sandra L. Jackson, PhD, MPH, a Emily C. Yang, b Zefeng Zhang, MD, PhDa
BACKGROUND AND OBJECTIVES: Socioeconomic disparities in cardiovascular health among adults
have been documented, but disparities during adolescence are less understood. In this study, we examined secular trends in 7 cardiovascular risk factors and disparities among US adolescents.
METHODS: We analyzed NHANES data from 1999 to 2014, including 11557 (4854 fasting)
participants aged 12 to 19 years. To examine trends in cardiovascular risk factors, adolescents were stratified into 3 groups on the basis of family poverty-income ratio: low income (poverty-income ratio, <1.3), middle income (≥1.3 and <3.5), and high income (≥3.5).
RESULTS: From 1999 to 2014, the prevalence of obesity increased (16.5%–21.0%, P = .001) but
only among low- and middle-income adolescents, with significant disparities in prevalence by income (21.7% vs 14.6% among low- versus high-income adolescents, respectively, in 2011–2014). In addition, there were significant and persistent disparities in the prevalence of smoking (20.8% vs 7.4% among low- versus high-income adolescents, respectively, in 2011–2014), low-quality diet (67.8% vs 49.0%), and physical inactivity (25.6% vs 17.0%). No significant disparities were observed in the prevalence of prediabetes and diabetes, hypertension, or hypercholesterolemia, although the prevalence of prediabetes and diabetes increased among low-income adolescents (21.4%–28.0%, P = .01). Overall, the prevalence of adolescents with 2 or more risk factors declined (48.3% to 37.1%, P<.001), but this decline was only significant for high- and middle-income adolescents.
CONCLUSIONS: Recent improvements in cardiovascular health have not been equally shared by
US adolescents of varying socioeconomic status.
abstract
aDivision for Heart Disease and Stroke Prevention, National Center for Chronic Disease Prevention and Health
Promotion, Centers for Disease Control and Prevention, Atlanta, Georgia; and bDavidson College, Davidson,
North Carolina
Dr Jackson and Ms Yang conceptualized and designed the study and drafted the initial manuscript; Dr Zhang contributed to study design and conducted the analyses; and all authors reviewed and revised the manuscript, approved the final manuscript as submitted, and agree to be accountable for all aspects of the work.
The findings and conclusions in this report are those of the authors and do not necessarily represent the official position of the Centers for Disease Control and Prevention.
DOI: https:// doi. org/ 10. 1542/ peds. 2018- 1089
Accepted for publication Aug 17, 2018
Address correspondence to Sandra L. Jackson, PhD, MPH, Division for Heart Disease and Stroke Prevention, Centers for Disease Control and Prevention, 4770 Buford Highway NE, Chamblee, GA 30341. E-mail: sljackson@cdc.gov
PEDIATRICS (ISSN Numbers: Print, 0031-4005; Online, 1098-4275).
Copyright © 2018 by the American Academy of Pediatrics
WHAT’S KNOWN ON THIS SUBJECT: There are socioeconomic disparities in cardiovascular disease among adults, but disparities during adolescence are less understood. Cardiovascular risk factors in adolescents are important because they can track into adulthood, and cardiovascular disease is a leading cause of morbidity and mortality. WHAT THIS STUDY ADDS: We examined secular trends and socioeconomic disparities in
cardiovascular risk factors among US adolescents from 1999 to 2014. Obesity increased, whereas other risk factors improved. Significant disparities persisted, and improvements were not shared equally across income strata.
To cite: Jackson SL, Yang EC, Zhang Z. Income Disparities and Cardiovascular Risk Factors Among Adolescents.
Heart disease is the leading cause of death in the US population, with cardiovascular disease (CVD) claiming >10 million lives in the past 18 years.1 A substantial burden of cardiovascular risk factors exists among adolescents in the United States2 and globally, 3 and emerging evidence suggests that patterns of cardiovascular health are established early and track into adulthood.4 There are striking disparities in risk factors and CVD across socioeconomic strata in the United States, 5, 6 and lower socioeconomic status may influence CVD risk through diverse pathways including increased exposure to environmental hazards such as poor air quality; decreased educational attainment and poorer health behaviors; decreased access to health care; decreased family, neighborhood, and community resources such as healthy food and safe places for physical activity; and increased chronic stress associated with violence, deprivation, or discrimination.7, 8 Few studies have examined secular trends in CVD risk factors and disparities among adolescents despite the fact that disparities may be widening, given the increasing income inequality in the United States.9 The purpose of this study was to examine socioeconomic disparities in cardiovascular risk factor trends among US adolescents from 1999 to 2014.
METHODS
Study Design and Population
We used data from the National Health and Nutrition Examination Survey (NHANES), a nationally representative, cross-sectional survey of the civilian, noninstitutionalized US population. Data were collected through household interviews and physical examinations.10 We included data
from NHANES 1999–2002, 2003–
2006, 2007–2010, and 2011–2014
for adolescents aged 12 to 19 years, excluding those pregnant (in
NHANES 1999–2006, for which this
information was available) or those with missing data (Supplemental Fig 5), yielding a total of 11557. Of these, a random subsample of 4854 adolescents had fasting glucose and lipid measurement; these adolescents had morning blood draws and reported fasting at least 8 hours since their last meal.
Variables
Sociodemographic Variables
Demographic characteristics included age, sex, and race and Hispanic origin (classified as non-Hispanic white, non-Hispanic black, Mexican American, and “other” for sufficient sample size). Income was categorized by family poverty-income ratio (PIR) values taken from the ratio of family income to poverty thresholds (stratified in 3 categories: low income [PIR <1.3], middle income [1.3 ≤ PIR < 3.5], and high income [PIR ≥3.5]).11 A PIR value of 1.3 corresponds to a family income 130% of the poverty level for that survey year; 3.5 corresponds to 350%. Education of the head of household was categorized as <12 years, 12 years or General Equivalency Diploma, or >12 years.
Disparity Measures
To evaluate disparities in CVD prevalence trends across survey years, we used both absolute and relative measures of health disparity. We calculated the rate difference, an absolute measure, which
captured the difference in risk factor prevalence between the low-income group and high-income group. We also calculated the slope index of inequality (SII), which captured the average difference in risk factor prevalence among adolescents ranked from the lowest to the highest income group. The relative index of inequality (RII) captured the mean risk factor prevalence of all weighted
income groups. RII and SII are summary measures recommended
for making comparisons over time.12
These indices are regression-based, population-weighted disparity measurements, and take PIR group distribution into account. A negative SII indicates that the risk factor prevalence decreases with increasing PIR (from low to high income), a positive SII means that the prevalence increases with increasing PIR, and 0 indicates no association. Similarly, a negative rescaled RII (multiplying the results by 100) indicates the percentage decline in the risk factor’s prevalence from low- to high-income groups, and vice versa for positive RII values. We used the Health Disparity Calculator developed by the National Cancer Institute to calculate the health disparity measures.13
Obesity
Adolescent weight status was classified according to age- and sex-specific reference values from the 2000 Centers for Disease Control and Prevention growth charts.14
Adolescents having a BMI ≥95th
percentile were classified as having obesity.
Smoking
Smoking status was classified as “not current smoker” or “current smoker” (self-reported cigarettes within 30 days, or sex- and race-specific serum cotinine levels [≥8.78, ≥6.01, ≥1.18, and ≥8.78 ng/mL] for non-Hispanic white, non-Hispanic black, Mexican American, and other male individuals, respectively; ≥2.95, ≥2.81, ≥0.66, and ≥2.43 for corresponding female individuals, respectively).15 Established cutoffs for “other” race and Hispanic origin were not available, so corresponding sex-specific levels were used.
Low Quality Diet
differences in diet quality.16 It consists of 12 components representing major food groups, including fruit and vegetables, whole grains, proteins, dairy, oils, sodium, and empty calories. The sum yields a total score ranging from 0 to 100, where a higher score indicates a more healthy diet.17 In the current
study, HEI-2010 scores ≤50 were
classified as low-quality diets, 18, 19 using the NHANES first 24-hour dietary recall.
Physical Inactivity
The NHANES questions for physical activity changed during this time period; for consistency, we only present physical activity data for
NHANES 2007–2014. We classified
adolescents as inactive if they reported no physical activity or <10 minutes in a typical week. Although correlations between self-reported and objectively-measured physical activity are
low-to-moderate, 20 epidemiologic analyses have repeatedly demonstrated associations between cardiovascular outcomes and self-reported physical activity, and recommendations are largely based on self-reported data.21
Hypertension
The mean of up to 3 systolic and diastolic blood pressure (BP) readings were used to classify adolescents as having hypertension according to age-, sex-, and height-specific percentile tables provided in the 2017 American Academy of Pediatrics (AAP) Clinical Practice Guideline.22 For adolescents aged 12 to 17, hypertension was BP
≥95th percentile, BP ≥130/80
mmHg, or antihypertensive
medication use. For those aged 18
to 19, hypertension was ≥130/
80 mmHg or antihypertensive
medication use. (Medication use was only available for adolescents aged 16–19 years.)
Prediabetes and Diabetes
Adolescents with a self-reported diagnosis of diabetes, hemoglobin A1c (HbA1c) ≥6.5%, or fasting
plasma glucose (FPG) ≥126 mg/dL
were classified as having diabetes. Those without a self-reported diagnosis of diabetes (and with an HbA1c level of 5.7% to 6.4% or an FPG level of 100 to 125 mg/dL) were classified as having
prediabetes.23 Forward calibration equations were used to adjust earlier NHANES cycles of data to be consistent with later years, to account for changes in glucose measurement methods over time.24,25 We combined diabetes and
prediabetes into 1 category (“prediabetes and diabetes”) for stable estimates and restricted these analyses to the fasting sample.
Hypercholesterolemia
Serum total cholesterol (TC) levels were assessed using enzymatic reactions. Serum high-density lipoprotein cholesterol was measured
by direct immunoassay in 2007–
2014 and by heparin manganese precipitation in 1999–2006.26–28 Serum low-density lipoprotein cholesterol (LDL-C) was calculated by using the following formula for adolescents with triglyceride level ≤400 mg/dL: LDL-C = TC − [high-density lipoprotein cholesterol + (triglycerides/5)].29, 30 Serum
LDL-C levels were used to classify adolescents as having borderline high or high LDL-C. Adolescents were classified as having hypercholesterolemia if levels
of LDL-C were ≥130 mg/dL or
TC were ≥200 mg/dL.31 These analyses were restricted to adolescents with fasting data.
Statistical Analysis
We used multivariable logistic regression to estimate the prevalence of individual risk factors, as well as combinations of risk factors (1 or more; 2 or more)
by PIR and period (1999–2002,
2003–2006, 2007–2010, and 2011–2014), adjusted for age, sex, and race and Hispanic origin. Analyses for prediabetes and diabetes, hypercholesterolemia, and combinations of risk factors used fasting sample data. Trends across survey periods, differences in prevalence between 1999-2002 vs 2011-2014, and differences in prevalence between low- vs high- income adolescents within each NHANES cycle, were assessed by
t test. We estimated the number
of adolescents with risk factors in each PIR group by multiplying the PIR-specific prevalence of risk factors by the total number of noninstitutionalized adolescents in each PIR category, derived from the Current Population Survey for
each NHANES cycle (1999–2002,
2003–2006, 2007–2010, 2011– 2014).32 To estimate change in total number of adolescents with each risk factor across cycles, the estimated numbers of adolescents with each risk factor were summed across income categories, and then the summed estimates for NHANES
1999–2002 were subtracted
from the summed estimates for
NHANES 2011–2014. Examination
weights were used for analysis of hypertension, physical inactivity, smoking, and obesity, dietary weights were used for diet, and fasting subsample weights were used for prediabetes and diabetes and hypercholesterolemia. SUDAAN, version 11, was used for analysis, taking into account the complex sampling design.
RESULTS
Among 11557 US adolescents
aged 12 to 19 years, the weighted percentage within each age, sex, and family income group remained consistent from 1999 to 2014 (Table 1). The proportion of adolescents under
>12 years of education increased from 54.4% to 66.5% (P < .001).
Obesity
Although the prevalence of obesity increased (16.5%–21.0%, P = .001), with an estimated increase of 1.8 million adolescents with obesity
in 2011–2014 compared with
1999–2002 (Table 2, Fig 1), increases were only observed among the low income (18.1%–21.7%, P = .002)
and middle income (17.1%–26.0%,
P = .01) groups. Among high-income
adolescents, obesity prevalence
remained stable (14.3%–14.6%,
P = .91). There were statistically significant disparities (RII and SII) in obesity prevalence in the most recent
NHANES cycles (2007–2010 and
2011–2014).
Smoking
The prevalence of smoking as defined in this study declined
among all adolescents (24.1%–
13.2%, P < .001), with an estimated
3.3 million fewer current smokers
in 2011–2014 compared with 1999–
2002 (Table 2, Fig 1). Although declines were significant across all income strata, significant disparities persisted (both RII and SII), with low-income adolescents having the highest prevalence of smoking throughout the survey period.
Low-Quality Diet
The percentage of US adolescents consuming a low-quality diet decreased (81.1%–59.4%, P < .001), with an estimated 6 million fewer adolescents with a low-quality diet
in 2011–2014 compared with 1999–
2002 (Table 2, Fig 2). Improvements were significant across all income groups (all P < .001). However, diet improved the most among high-income adolescents, and significantly fewer high-income adolescents had low-quality diet compared to low-income adolescents in 2011-2014. There was little disparity in the prevalence of low-quality diet
between income groups throughout the first 3 survey periods, but the disparity was statistically significant in 2011–2014.
Physical Inactivity
Overall, ∼20% of US adolescents were physically inactive, which remained
stable between 2007–2010 and 2011–
2014 (Table 2, Fig 2). The prevalence of physical inactivity differed among income groups, with low-income adolescents (25.6%) more likely to be inactive than high-income adolescents (17.0%) in 2011–2014. Disparities were statistically significant.
Hypertension
Overall, the prevalence of
hypertension among US adolescents decreased from 1999 to 2014 (8.6%–4.2%, P < .001), with an estimated 1.3 million fewer adolescents having hypertension
in 2011–2014 compared with
1999–2002 (Table 2, Fig 3). Patterns were fairly consistent across income
TABLE 1 Characteristics of Adolescents Aged 12–19 Years: NHANES 1999–2014
Characteristics NHANES 1999–2002,
N = 3792
NHANES 2003–2006,
N = 3719
NHANES 2007–2010,
N = 2040
NHANES 2011–2014,
N = 2006
P for Trenda
% (95% CI) % (95% CI) % (95% CI) % (95% CI)
Age group, y
12–15 51.4 (49.0−53.7) 52.2 (49.4−54.9) 51.8 (49.4−54.3) 52.4 (49.2−55.7) .659
16–19 48.6 (46.3−51.0) 47.8 (45.1−50.6) 48.2 (45.7−50.6) 47.6 (44.3−50.8)
Sex
Male 51.8 (49.8−53.7) 51.3 (49.2−53.4) 51.7 (49.1−54.3) 51.3 (48.4−54.2) .865
Female 48.2 (46.3−50.2) 48.7 (46.6−50.8) 48.3 (45.7−50.9) 48.7 (45.8−51.6)
Race and Hispanic origin
Non-Hispanic white 60.3 (56.3−64.2) 64.6 (58.8−70.0) 61.4 (55.8−66.8) 56.8 (50.3−63.0) .259
Non-Hispanic black 13.2 (10.3−16.7) 14.5 (11.2−18.4) 14.0 (11.6−16.9) 14.1 (10.3−19.2) .772
Mexican American 10.3 (7.96−13.3) 10.9 (8.34−14.2) 12.3 (9.19−16.3) 14.1 (11.0−18.0) .073
Other 16.2 (12.5−20.8) 10.1 (8.06−12.5) 12.2 (9.43−15.7) 15.0 (12.4−17.9) .847
Education attainment of household head, y
n=3702 n=3622 n=2016 n=1983
<12 21.2 (19.1−23.5) 14.7 (12.5−17.3) 15.5 (13.2−18.2) 16.1 (13.3−19.4) .017
12 24.4 (21.5−27.4) 22.4 (19.2−25.9) 18.8 (16.3−21.6) 17.4 (14.3−21.1) <.001
>12 54.4 (50.7−58.1) 62.9 (59.1−66.5) 65.6 (61.7−69.4) 66.5 (61.9−70.8) <.001
PIR
<1.3 (low income) 32.6 (29.8−35.5) 27.5 (23.7−31.6) 30.2 (26.6−34.1) 31.9 (25.7−38.7) .955
≥1.3–<3.5 (middle
income)
35.5 (32.6−38.6) 36.8 (33.7−40.0) 34.5 (30.6−38.7) 38.3 (33.4−43.3) .524
≥3.5 (high income) 31.9 (28.9−35.0) 35.7 (31.2−40.5) 35.3 (30.4−40.5) 29.9 (24.6−35.8) .531
CI, confidence interval.
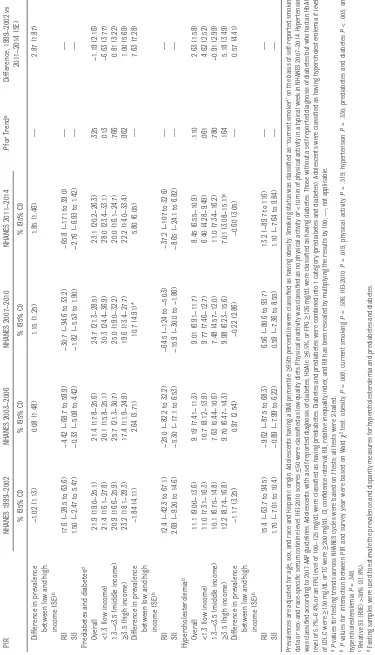
TABLE 2
Adjusted Prevalence of CVD Risk Factors by PIR in Adolescents Aged 12
–
19 Years, NHANES 1999
– 2014 PIR NHANES 1999 – 2002 NHANES 2003 – 2006 NHANES 2007 – 2010 NHANES 2011 – 2014 P for T rend a Difference, 1999 – 2002 vs 2011 – 2014 (SE)
% (95% CI)
% (95% CI)
% (95% CI)
% (95% CI)
Obesity Overall 16.5 (14.9−18.2) 17.7 (15.2−20.5) 18.9 (16.8−21.1) 21.0 (18.8−23.4) .001 −4.55 (1.40)*
<1.3 (low income)
18.1 (15.7−20.6) 18.2 (15.1−21.7) 25.6 (22.3−29.1) 21.7 (19.2−24.4) .002 −3.61 (1.74)* 1.3 –
<3.5 (middle income)
17.1 (15.0−19.6) 20.3 (16.8−24.3) 17.1 (13.9−20.8) 26.0 (21.2−31.3) .010 −8.81 (2.82)* ≥
3.5 (high income)
14.3 (11.1−18.2) 14.2 (10.8−18.4) 14.4 (11.5−17.9) 14.6 (9.75−21.3) .909 −0.33 (3.39)
Difference in prevalence between low and high income (SE)
b 3.77 (1.84)* 3.96 (1.84)* 11.1 (2.33)** 7.05 (3.09)* — 3.28 (3.56) RII −
33.6 (−72.6 to 5.46)
−37.7 (−80.9 to 5.47)
−86.7 (−125 to −48.8)
−46.3 (−91.3 to −1.27)
—
—
SII
−5.55 (−11.8 to 0.72)
−6.60 (−14.0 to 0.77)
−16.2 (−23.1 to −9.33)
−9.81 (−18.7 to −0.90)
—
—
Current smoking Overall
24.1 (21.6−26.8) 20.6 (18.8−22.6) 21.1 (18.9−23.5) 13.2 (11.3−15.4) <.001 10.9 (1.64)**
<1.3 (low income)
30.5 (25.2−36.3) 26.7 (22.2−31.8) 28.7 (23.3−34.7) 20.8 (16.8−25.3) .013 9.74 (3.40)* 1.3 –
<3.5 (middle income)
25.1 (22.1−28.3) 19.8 (16.9−22.9) 21.3 (17.1−26.2) 12.3 (8.47−17.4) <.001 12.8 (2.73)** ≥
3.5 (high income)
17.7 (14.8−21.1) 16.2 (13.0−19.9) 14.4 (11.8−17.6) 7.35 (5.15−10.4) <.001 10.3 (2.01)**
Difference in prevalence between low and high income (SE)
b 12.8 (2.88)** 10.6 (3.22)* 14.3 (3.31)** 13.4 (2.63)** — 0.60 (3.76) RII
−77.0 (−113 to −41.4)
−73.6 (−114 to −32.9)
−100 (−140 to −60.4)
−144 (−195 to −93.4)
—
—
SII
−18.9 (−28.3 to −9.45)
−15.0 (−23.4 to −6.61)
−21.1 (−30.3 to −11.9)
−19.5 (−26.6 to −12.3)
— — HEI-2010 score ≤ 50 Overall 81.1 (78.7−83.2) 75.2 (73.2−77.2) 70.8 (66.9−74.5) 59.4 (55.6−63.1) <.001 21.7 (2.18)**
<1.3 (low income)
83.1 (78.9−86.7) 75.9 (71.5−79.8) 67.7 (61.6−73.3) 67.8 (63.2−72.2) <.001 15.3 (2.89)** 1.3 –
<3.5 (middle income)
81.1 (76.4−85.0) 76.6 (73.3−79.5) 75.9 (71.5−79.8) 60.3 (53.8−66.4) <.001 20.8 (3.87)** ≥
3.5 (high income)
79.0 (73.6−83.6) 72.8 (67.6−77.5) 68.3 (60.4−75.3) 49.0 (41.2−56.8) <.001 30.0 (4.71)**
Difference in prevalence between low and high income (SE)
b 4.10 (3.32) 3.07 (3.31) −0.60 (4.68) 18.8 (4.85)** — 14.7 (5.79)* RII
−7.44 (−18.9 to 3.97)
−6.57 (−19.3 to 6.13)
−0.05 (−20.0 to 19.9)
−45.8 (−68.6 to −22.9)
—
—
SII
−6.04 (−15.3 to 3.18)
−4.93 (−14.4 to 4.55)
−0.04 (−14.1 to 14.1)
−27.1 (−40.0 to −14.3)
—
—
Physical inactivity Overall
— — 19.1 (17.1−21.3) 20.4 (18.1−23.0) .424 −1.34 (1.67)
<1.3 (low income)
— — 25.3 (22.0−28.9) 25.6 (21.4−30.3) .920 −0.27 (2.68) 1.3 –
<3.5 (middle income)
— — 19.9 (16.7−23.6) 19.1 (14.5−24.6) .787 0.85 (3.15) ≥
3.5 (high income)
— — 11.9 (8.94−15.7) 17.0 (12.8−22.3) .079 −5.09 (2.87)
Difference in prevalence between low and high income (SE)
b — — 13.4 (2.40)** 8.57 (3.62)* — −4.82 (4.08) RII — —
−107 (−147 to −67.1)
−61.0 (−107 to −14.5)
—
—
SII
—
—
−20.0 (−27.1 to −12.9)
−12.5 (−21.9 to −3.17)
— — Hyper tension Overall 8.55 (7.37−9.89) 7.43 (5.84−9.40) 5.93 (4.81−7.27) 4.22 (3.37−5.27) <.001 4.33 (0.79)**
<1.3 (low income)
8.07 (6.54−9.93) 7.05 (5.34−9.26) 6.20 (4.74−8.07) 5.60 (4.08−7.62) .034 2.47 (1.21)* 1.3 –
<3.5 (middle income)
8.53 (6.32−11.4) 8.11 (5.82−11.2) 6.54 (4.88−8.70) 3.37 (1.90−5.89) <.001 5.16 (1.59)* ≥
3.5 (high income)
PIR NHANES 1999 – 2002 NHANES 2003 – 2006 NHANES 2007 – 2010 NHANES 2011 – 2014 P for T rend a Difference, 1999 – 2002 vs 2011 – 2014 (SE)
% (95% CI)
% (95% CI)
% (95% CI)
% (95% CI)
Difference in prevalence between low and high income (SE)
b −1.02 (1.13) 0.08 (1.48) 1.15 (1.25) 1.85 (1.46) — 2.87 (1.87) RII
17.6 (−28.5 to 63.6)
−4.42 (−68.7 to 59.9)
−30.7 (−94.6 to 33.2)
−65.8 (−171 to 39.0)
—
—
SII
1.50 (−2.47 to 5.47)
−0.33 (−5.08 to 4.42)
−1.82 (−5.53 to 1.90)
−2.76 (−6.93 to 1.42)
—
—
Prediabetes and diabetes
d Overall 21.9 (19.0−25.1) 21.4 (17.8−25.6) 24.7 (21.3−28.5) 23.1 (20.2−26.3) .325 −1.19 (2.16)
<1.3 (low income)
21.4 (16.1−27.8) 20.1 (15.8−25.1) 30.3 (24.4−36.9) 28.0 (23.4−33.1) .013 −6.63 (3.77) 1.3 –
<3.5 (middle income)
20.9 (16.6−25.9) 25.7 (21.3−30.7) 25.0 (19.0−32.2) 20.0 (16.1−24.7) .766 0.81 (3.22) ≥
3.5 (high income)
23.2 (18.1−29.3) 17.4 (11.9−24.9) 19.6 (13.4−27.7) 22.2 (14.0−33.4) .962 1.00 (5.69)
Difference in prevalence between low and high income (SE)
b −1.84 (4.11) 2.64 (3.71) 10.7 (4.91)* 5.80 (6.05) — 7.63 (7.28) RII
12.4 (−42.3 to 67.1)
−25.0 (−82.2 to 32.2)
−64.5 (−124 to −5.03)
−37.2 (−107 to 32.6)
—
—
SII
2.69 (−9.20 to 14.6)
−5.30 (−17.1 to 6.53)
−15.9 (−30.0 to −1.86)
−8.65 (−24.1 to 6.82)
— — Hypercholesterolemia d Overall 11.1 (9.00−13.6) 9.19 (7.41−11.3) 9.01 (6.91−11.7) 8.45 (6.55−10.9) .110 2.63 (1.58)
<1.3 (low income)
11.0 (7.31−16.3) 10.7 (8.12−13.9) 9.77 (7.46−12.7) 6.40 (4.28−9.49) .061 4.62 (2.52) 1.3 –
<3.5 (middle income)
10.1 (6.75−14.8) 7.63 (5.44−10.6) 7.48 (4.57−12.0) 11.0 (7.34−16.2) .780 −0.91 (2.99) ≥
3.5 (high income)
12.2 (8.74−16.8) 9.70 (6.47−14.3) 9.98 (6.23−15.6) 7.01 (3.08−15.1) e .164 5.18 (3.49)
Difference in prevalence between low and high income (SE)
b −1.17 (3.25) 0.97 (2.54) −0.22 (2.86) −0.60 (3.05) — 0.57 (4.41) RII
15.4 (−63.7 to 94.5)
−9.62 (−87.5 to 68.3)
6.56 (−80.6 to 93.7)
13.2 (−89.7 to 116)
—
—
SII
1.70 (−7.01 to 10.4)
−0.89 (−7.99 to 6.22)
0.59 (−7.36 to 8.55)
1.10 (−7.64 to 9.84)
—
—
Prevalences are adjusted for age, sex, and race and Hispanic origin. Adolescents having a BMI percentile
≥
95th percentile were classified as having obesity. Smoking status was classified as
“
current smoker
”
on the basis of self-repor
ted smoking
data or sex- and race-specific serum cotinine level. HEI-2010 scores
≤
50 were classified as low-quality diets. Physical inactivity was classified as no physical activity or <10 min of physical activi
ty in a typical week in NHANES 2007
–
2014. Hyper
tension
was classified according to 2017 AAP guidelines. Adolescents with a self-repor
ted diagnosis of diabetes, HbA1c
≥
6.5%, or FPG
≥
126 mg/dL were classified as having diabetes. Those without a self-repor
ted diagnosis of diabetes but who had an HbA1c
level of 5.7%
–
6.4% or an FPG level of 100
–
125 mg/dL were classified
as having prediabetes. Diabetes and prediabetes were combined into 1 category (prediabetes and diabetes). Adolescents were clas
sified as having hypercholesterolemia if levels
of LDL-C were
≥
130 mg/dL or TC were
≥
200 mg/dL. CI, confidence inter
val; RII, relative inequality index, and RII has been rescaled by multiplying the results by 100;
—
, not applicable.
aP
values for testing trends across NHANES cycles were based on
t
tests; all tests were 2-tailed.
bP
values for interaction between PIR and sur
vey year were based on Wald
χ
2 test: obesity
P
= .008; current smoking
P
= .586; HEI-2010
P
= .019; physical activity
P
= .319; hyper
tension
P
= .330; prediabetes and diabetes
P
< .003; and
hypercholesterolemia
P
= .348.
c Relative SE (RSE) >30% (31.8%). d Fasting samples were used to estimate the prevalence and disparity measures for hypercholes
terolemia and prediabetes and diabetes.
*P
< .05; **
P
< .001.
TABLE 2
FIGURE 1
Adjusted prevalence and trends of CVD risk factors and number of estimated adolescents by PIR among adolescents aged 12 to 19 years, NHANES
1999–2014. A, Obesity. B, Current smoking. Adolescents having a BMI percentile ≥95th percentile were classified as having obesity. Smoking status was
FIGURE 2
Adjusted prevalence and trends of CVD risk factors and number of estimated adolescents by PIR among adolescents aged 12 to 19 years, NHANES 1999–
2014, continued. C, Low-quality diet (HEI-2010 ≤50). D, Physical inactivity. HEI-2010 scores ≤50 were classified as low-quality diets. Physical inactivity was
FIGURE 3
Adjusted prevalence and trends of CVD risk factors and number of estimated adolescents by PIR among adolescents aged 12 to 19 years, NHANES
1999–2014, continued. E, Hypertension. F, Prediabetes and diabetes. Hypertension was classified according to 2017 AAP guidelines. Adolescents with a
self-reported diagnosis of diabetes, HbA1c ≥6.5%, or FPG ≥126 mg/dL were classified as having diabetes. Those without a self-reported diagnosis of diabetes
strata, and all income groups had statistically significant declines.
Prediabetes and Diabetes
The prevalence of prediabetes and diabetes among US adolescents did not increase significantly from 1999-2014 (21.9% to 23.1%, p=0.33; Table 2; Fig 3). There was a significant increase among low-income adolescents (21.4% to 28.0%, p=0.01), and a total of ∼7.8 million adolescents had prediabetes and diabetes in 2011–2014.
Hypercholesterolemia
Hypercholesterolemia prevalence did not change significantly from 1999 to 2014 (11.1%–8.5%, P = .11) among US adolescents overall or stratified by income (Table 2, Fig 4).
Multiple Risk Factors
Most adolescents had at least 1 CVD risk factor (Supplemental
Table 4). Overall, the proportion of adolescents with 1 or more CVD risk factors decreased across survey years (90.4%–80.1%, P < .001; Table 3). Throughout the first 3 survey periods, there was little disparity in prevalence of at least 1 CVD risk factor between income groups, but the disparity became significant in
2011–2014. The prevalence of having
at least 2 risk factors declined overall (48.3%–37.1%, P < .001), but this decline was only significant among high- and middle-income adolescents.
DISCUSSION
In this study, we provide a comprehensive analysis of secular trends in CVD risk factors and disparities among US adolescents from 1999 to 2014. During this time, the prevalence of obesity increased, but only among low- and middle-income adolescents. There were also significant and persistent
disparities in the prevalence of smoking, low-quality diet, and physical inactivity. No significant disparities were observed in the prevalence of prediabetes and diabetes, hypertension, or hypercholesterolemia for the most recent period (2011-2014), although the prevalence of prediabetes and diabetes increased among low-income adolescents from 1999 to 2014. Overall, the prevalence of adolescents with two or more CVD risk factors declined during this period (primarily because of declines in smoking, low-quality diet, and hypertension), but this decline was only significant for high- and middle-income adolescents.
Our findings are consistent with previous surveillance of adolescent obesity, which has increased across recent decades.33 However, the most recent data from NHANES suggest a plateau in obesity prevalence,
FIGURE 4
Adjusted prevalence and trends of CVD risk factors and number of estimated adolescents by PIR among adolescents aged 12 to 19 years, NHANES
1999–2014, continued. G, Hypercholesterolemia. Adolescents were classified as having hypercholesterolemia if levels of LDL-C were ≥130 mg/dL or TC
TABLE 3
Adjusted Prevalence and Disparity of Number of CVD Risk Factors by PIR in Adolescents Aged 12
–
19 Years: NHANES, 1999
– 2014 PIR NHANES 1999 – 2002 NHANES 2003 – 2006 NHANES 2007 – 2010 NHANES 2011 – 2014 P for T rend a Difference 1999 – 2002 vs 2011 – 2014 (SE)
% (95% CI)
% (95% CI)
% (95% CI)
% (95% CI)
1 or more risk factors
b Overall 90.4 (87.8−92.6) 89.3 (86.7−91.4) 87.1 (84.2−89.6) 80.1 (75.3−84.1) <.001 10.4 (2.53)**
<1.3 (low income)
92.4 (87.8−95.4) 89.4 (85.0−92.6) 88.5 (84.3−91.6) 86.2 (80.1−90.7) .049 6.19 (3.16) 1.3 –
<3.5 (middle income)
89.1 (83.7−92.9) 90.9 (87.2−93.6) 86.8 (80.7−91.2) 81.5 (73.9−87.3) .036 7.59 (4.09) ≥
3.5 (high income)
90.0 (86.2−92.9) 87.2 (81.4−91.3) 86.0 (80.1−90.3) 71.0 (60.1−79.8) <.001 19.1 (5.34)**
Difference in prevalence between low and high income
c 2.38 (2.31) 2.21 (3.08) 2.52 (3.03) 15.3 (5.75)* — 12.9 (6.12)* RII
−3.92 (−11.9 to 4.09)
−4.22 (−14.5 to 6.02)
−4.23 (−15.0 to 6.50)
−27.5 (−48.2 to −6.76)
—
—
SII
−3.55 (−10.8 to 3.71)
−3.76 (−12.8 to 5.33)
−3.68 (−13.0 to 5.62)
−21.9 (−38.0 to −5.94)
—
—
2 or more risk factors
b Overall 48.3 (44.6−52.1) 48.5 (43.5−53.4) 43.2 (40.0−46.4) 37.1 (33.4−40.8) <.001 11.3 (2.62)**
<1.3 (low income)
53.5 (45.8−60.9) 53.2 (45.0−61.2) 51.5 (44.9−58.0) 47.3 (41.8−52.9) .178 6.14 (4.64) 1.3 –
<3.5 (middle income)
42.3 (36.4−48.4) 50.5 (44.9−56.1) 43.2 (37.0−49.6) 34.7 (27.8−42.3) .046 7.61 (4.77) ≥
3.5 (high income)
49.7 (42.7−56.7) 41.8 (34.1−49.9) 35.9 (29.0−43.5) 29.1 (19.6−40.8) <.001 20.6 (6.38)*
Difference in prevalence between low and high income
c 3.77 (5.18) 11.4 (5.07)* 15.6 (4.88)* 18.3 (6.79)* — 14.5 (8.39) RII
−11.8 (−43.1 to 19.5)
−35.7 (−70.5 to −0.94)
−53.7 (−88.5 to −18.9)
−71.8 (−122 to −21.1)
—
—
SII
−5.71 (−20.9 to 9.44)
−17.2 (−33.7 to −0.68)
−23.1 (−37.7 to −8.60)
−26.6 (−43.7 to −9.49)
—
—
Prevalences are adjusted for age, sex, and race and Hispanic origin. Adolescents having a BMI percentile
≥
95th percentile were classified as having obesity. Smoking status was classified as
“
current smoker
”
on the basis of self-repor
ted smoking
data or sex- and race-specific serum cotinine level. HEI-2010 scores
≤
50 were classified as low-quality diets. Hyper
tension was classified according to 2017 AAP guidelines. Adolescents with a self-repor
ted diagnosis of diabetes, HbA1c
≥
6.5%, or FPG
≥
126 mg/dL were
classified as having diabetes. Those without a self-repor ted diagnosis
of diabetes but who had
an HbA1c level
of 5.7%
–
6.4% or an
FPG level of 100
–
125 mg/dL
were classified as having
prediabetes. Diabetes and prediabetes
were
combined into 1 category (prediabetes and diabetes). Adolescents were classified as having hypercholesterolemia if levels of LDL
-C were
≥
130 mg/dL or TC were
≥
200 mg/dL. RII, relative inequality index, and RII had been rescaled by multiplying
the results by 100; CI, confidence inter
val;
—
, not applicable.
aP
values for testing trends across NHANES cycles were based on
t
tests; all tests were 2-tailed.
b Fasting samples were used to estimate the prevalence of the number of CVD risk factors. The number of risk factors is calculat
ed out of 6 total (obesity, smoking, low-quality diet, hyper
tension, prediabetes and diabetes, hypercholesterolemia).
Physical inactivity was not included because consistent data were not available across all 4 time
inter
vals examined.
cP
value for interaction between PIR and sur
vey year: 1 or more risk factors
P
= .40; 2 or more risk factors
P
= .07.
*P
< .05; **
P
with a nonsignificant increase from
18.1% in 2007–2008 to 20.6% in
2015–2016 among those aged 12
to 19.34 Our study indicates obesity has risen only among adolescents belonging to low- and middle-income groups while remaining stable among high-income adolescents. Disparities in adolescent obesity prevalence have been previously reported, 35 and there are numerous pathways through which socioeconomic status may impact obesity and other cardiovascular risk factors.7, 8 For example, socioeconomic status may affect obesity and other cardiovascular risk factors by influencing both diet and physical activity.36–40 Poverty is associated with food insecurity (which is paradoxically associated with obesity in the United States), 41 reduced ability to afford healthy food such as fruits and vegetables, or neighborhood factors such as having fewer supermarkets and more fast food outlets.38 We observed modest improvements in diet among all adolescents, which is consistent with previous work.42, 43 However, high-income adolescents improved the most, and disparities worsened over time. The prevalence of physical inactivity remained fairly stable between 2007 and 2014 but was significantly higher among low-income adolescents compared with high-income adolescents. Socioeconomic and racial and/or ethnic disparities in physical activity exist44 and may be related to factors such as difficulty affording equipment for organized sports, reduced access to parks and other places to exercise, and high crime rates or lack of perceived safety for outdoor physical activity.45 Public health initiatives such as the US Surgeon General’s “Step It Up!” call to action highlight the importance of community and environmental factors in improving physical activity.46 Increasing obesity prevalence, and high prevalence of both poor diet
and physical inactivity, may have contributed to the observed increase in prediabetes and diabetes among low-income adolescents.47 Obesity, particularly abdominal obesity, is strongly associated with the development of insulin resistance and type 2 diabetes, and the period of pubertal insulin resistance may mean that adolescent development is a particularly vulnerable time if multiple risk factors for diabetes occur together.48 Autonomic dysfunction and chronic inflammation may contribute to the link between obesity and diabetes.49 The increase in prediabetes and diabetes among low-income youth, combined with existing socioeconomic disparities and a growing burden of cardiometabolic disease among adults, 5, 44 is cause for concern. Increasing CVD risk factors such as obesity and diabetes among youth and young adults may be contributing to observed increases in burden of stroke among younger adults.50 However, the current study could not distinguish between type 1 and type 2 diabetes, and underlying risk factors and trends of these conditions differ. If current trends continue, 1 study projected that the prevalence of type 1 diabetes may triple and type 2 diabetes may quadruple by 2050 among youth <20 years of age in the United States.51
The prevalences of smoking and hypertension decreased significantly and the prevalence of hypercholesterolemia remained stable. The observed decline in adolescent smoking is consistent with previous reports and may reflect tobacco control efforts.52, 53 However, we could not examine use of
other inhaled nicotine products (such as e-cigarettes) or marijuana, which may have increased during this time period.54, 55 Moderate declines in hypercholesterolemia and in hypertension among adolescents
have been previously shown.56, 57 Although largely unexplained, these trends may be related to improved diet or improved screening and earlier clinical intervention.43, 58 Additional research could explore the contrast observed between rising obesity and decreasing hypertension among US adolescents.
This study had several limitations. First, we could not exclude pregnant adolescents from NHANES 2007 to 2014 because pregnancy data became confidential; the number of pregnant teens in these cycles was likely to be small because NHANES stopped oversampling this subpopulation. Second, we only examined physical inactivity among adolescents for NHANES
2007–2014 to maintain consistency
ABBREVIATIONS
AAP: American Academy of Pediatrics
BP: blood pressure
CVD: cardiovascular disease FPG: fasting plasma glucose HbA1c: hemoglobin A1c
HEI-2010: Healthy Eating Index 2010
LDL-C: low-density lipoprotein cholesterol
NANES: National Health and Nutrition Examination Survey
PIR: poverty-income ratio RII: relative index of inequality SII: slope index of inequality TC: total cholesterol
FINANCIAL DISCLOSURE: The authors have indicated they have no financial relationships relevant to this article to disclose.
FUNDING: No external funding.
POTENTIAL CONFLICT OF INTEREST: The authors have indicated they have no potential conflicts of interest to disclose. CONCLUSIONS
There is a disproportionate burden of CVD risk factors across socioeconomic strata among US adolescents, and some disparities appear to be worsening. This supports the need for further surveillance and public health action to address CVD risk factors and disparities among youth. Establishing healthy behaviors early in life can help maintain those behaviors into adulthood, 59 and addressing risk factors such as hypertension during adolescence may reduce cardiovascular risk later in life.60 Individual-level behavior change and health education programs may be less effective types of public health intervention, 8 while broader strategies to improve adolescent health and reduce disparities include addressing the social determinants of health such as economic stability of families and communities; neighborhood and environmental factors such as housing,
transportation, safety, and walkability; access to high-quality education from early childhood through K-12 schooling; social support systems; and access to quality health care.61, 62 Within health care, related efforts include the Center for Medicare and Medicaid Innovation’s State Innovation Models Initiative, which emphasizes population health; certain Medicaid delivery and payment reforms, such as patient-centered medical homes (which coordinate care for persons with chronic conditions and can include care management, patient and family support, and referrals to social support services); and programs that support community health centers and community health workers.62 Efforts to improve cardiovascular health and reduce disparities among adolescents may help to slow the rising tide of CVD among middle aged adults50 and may help alleviate health inequalities.
ACKNOWLEDGMENTS
We acknowledge Robert Merritt and Quanhe Yang (Division for Heart Disease and Stroke Prevention, Centers for Disease Control and Prevention) for their insight and support of this project.
REFERENCES
1. Centers for Disease Control and Prevention; National Center for Health Statistics. Underlying cause of death 1999-2015 on CDC WONDER online database. 2016. Availablle at: https:// wonder. cdc. gov/ Accessed July 3, 2017 2. Steinberger J, Daniels SR, Hagberg N,
et al; American Heart Association Atherosclerosis, Hypertension, and Obesity in the Young Committee of the Council on Cardiovascular Disease in the Young; Council on Cardiovascular and Stroke Nursing; Council on Epidemiology and Prevention; Council on Functional Genomics and Translational Biology; Stroke Council. Cardiovascular health promotion in children: challenges and opportunities for 2020 and beyond: a scientific statement from the American
Heart Association. Circulation. 2016;134(12):e236–e255
3. Caleyachetty R, Echouffo-Tcheugui JB, Tait CA, Schilsky S, Forrester T, Kengne AP. Prevalence of behavioural risk factors for cardiovascular disease in adolescents in low-income and middle-income countries: an individual participant data meta-analysis. Lancet Diabetes Endocrinol. 2015;3(7):535–544
4. Expert Panel on Integrated Guidelines for Cardiovascular Health and Risk Reduction in Children and Adolescents; National Heart, Lung, and Blood Institute. Expert panel on integrated guidelines for cardiovascular health and risk reduction in children and adolescents: summary report.
Pediatrics. 2011;128(suppl 5):S213–S256
5. Odutayo A, Gill P, Shepherd S, et al. Income disparities in absolute cardiovascular risk and cardiovascular risk factors in the United States, 1999-2014. JAMA Cardiol. 2017;2(7):782–790 6. Braveman PA, Cubbin C, Egerter S,
Williams DR, Pamuk E. Socioeconomic disparities in health in the United States: what the patterns tell us.
Am J Public Health. 2010;100(suppl 1): S186–S196
7. Wood D. Effect of child and family poverty on child health in the United States. Pediatrics. 2003; 112(3 part 2):707–711
9. Bor J, Cohen GH, Galea S. Population health in an era of rising income inequality: USA, 1980-2015. Lancet. 2017;389(10077):1475–1490
10. National Center for Health Statistics. National Health and Nutrition Examination Survey. 2018. Available at: https:// www. cdc. gov/ nchs/ nhanes/ index. htm. Accessed February 1, 2018 11. Ogden CL, Carroll MD, Fakhouri TH,
et al. Prevalence of obesity among youths by household income and education level of head of household - United States 2011-2014. MMWR Morb Mortal Wkly Rep. 2018;67(6):186–189 12. Mackenbach JP, Kunst AE. Measuring
the magnitude of socio-economic inequalities in health: an overview of available measures illustrated with two examples from Europe. Soc Sci Med. 1997;44(6):757–771
13. Breen N, Scott S, Percy-Laurry A, Lewis D, Glasgow R. Health disparities calculator: a methodologically rigorous tool for analyzing inequalities in population health. Am J Public Health. 2014;104(9):1589–1591
14. Kuczmarski RJ, Ogden CL, Guo SS, et al. 2000 CDC growth charts for the United States: methods and development.
Vital Health Stat 11. 2002;(246): 1–190
15. Benowitz NL, Bernert JT, Caraballo RS, Holiday DB, Wang J. Optimal serum cotinine levels for distinguishing cigarette smokers and nonsmokers within different racial/ethnic groups in the United States between 1999 and 2004. Am J Epidemiol. 2009;169(2):236–248
16. Guenther PM, Kirkpatrick SI, Reedy J, et al. The Healthy Eating Index-2010 is a valid and reliable measure of diet quality according to the 2010 Dietary Guidelines for Americans. J Nutr. 2014;144(3):399–407
17. Guenther PM, Casavale KO, Reedy J, et al. Update of the Healthy Eating Index: HEI-2010. J Acad Nutr Diet. 2013;113(4):569–580
18. Ford ES, Greenlund KJ, Hong Y. Ideal cardiovascular health and mortality from all causes and diseases of the circulatory system among adults in the United States. Circulation. 2012;125(8):987–995
19. Sattler ELP, Bhargava V. Food insecurity and cardiovascular risk factors in US adolescents. J Appl Res Child. 2015;6(2)
20. Prince SA, Adamo KB, Hamel ME, Hardt J, Connor Gorber S, Tremblay M. A comparison of direct versus self-report measures for assessing physical activity in adults: a systematic review.
Int J Behav Nutr Phys Act. 2008;5:56 21. Physical Activity Guidelines Advisory
Committee. Physical Activity Guidelines Advisory Committee report, 2008. 2008. Available at: https:// health. gov/ paguidelines/ report/ pdf/ CommitteeReport. pdf. Accessed June 29, 2018
22. Flynn JT, Kaelber DC, Baker-Smith CM, et al; Subcommittee on Screening and Management of High Blood Pressure in Children. Clinical practice guideline for screening and management of high blood pressure in children and adolescents. Pediatrics. 2017;140(3):e20171904
23. American Diabetes Association. Standards of medical care in diabetes–2014. Diabetes Care. 2014;37(suppl 1):S14–S80
24. National Center for Health Statistics. National Health and Nutrition Examination Survey 2005-2006 Data Documentation, Codebook, and Frequencies: Plasma Fasting Glucose & Insulin (GLU_D) https://wwwn.cdc.gov/ nchs/nhanes/2005-2006/GLU_D.htm. Published 2008. Accessed October 22, 2018.
25. National Center for Health Statistics. National Health and Nutrition Examination Survey 2007-2008 Data Documentation, Codebook, and Frequencies: Plasma Fasting Glucose & Insulin (GLU_E). https://wwwn.cdc.gov/ Nchs/Nhanes/2007-2008/GLU_E.htm. Published 2010. Accessed October 22, 2018.
26. Allain CC, Poon LS, Chan CS, Richmond W, Fu PC. Enzymatic determination of total serum cholesterol. Clin Chem. 1974;20(4):470–475
27. Sugiuchi H, Uji Y, Okabe H, et al. Direct measurement of high-density lipoprotein cholesterol in serum with polyethylene glycol-modified enzymes and sulfated alpha-cyclodextrin. Clin Chem. 1995;41(5):717–723
28. Carroll MD, Kit BK, Lacher DA, Shero ST, Mussolino ME. Trends in lipids and lipoproteins in US adults, 1988-2010.
JAMA. 2012;308(15):1545–1554 29. Friedewald WT, Levy RI, Fredrickson
DS. Estimation of the concentration of low-density lipoprotein cholesterol in plasma, without use of the
preparative ultracentrifuge. Clin Chem. 1972;18(6):499–502
30. Garoufi A, Drakatos A, Tsentidis C, et al. Comparing calculated LDL-C with directly measured LDL-C in healthy and in dyslipidemic children.
Clin Biochem. 2017;50(1–2):16–22 31. Lozano P, Henrikson NB, Morrison CC,
et al. Lipid screening in childhood and adolescence for detection of multifactorial dyslipidemia: evidence report and systematic review for the US Preventive Services Task Force.
JAMA. 2016;316(6):634–644
32. National Center for Health Statistics. Key concepts about population counts. Available at: https:// www. cdc. gov/ nchs/ tutorials/ nhanes/ NHANESAnalyses/ AgeStandardizatio n/ Info2. htm. Accessed February 1, 2018
33. Ogden CL, Carroll MD, Lawman HG, et al. Trends in obesity prevalence among children and adolescents in the United States, 1988-1994 through 2013-2014.
JAMA. 2016;315(21):2292–2299 34. Hales CM, Fryar CD, Carroll MD,
Freedman DS, Ogden CL. Trends in obesity and severe obesity prevalence in US youth and adults by sex and age, 2007-2008 to 2015-2016. JAMA. 2018;319(16):1723–1725
35. Ogden CL, Lamb MM, Carroll MD, Flegal KM. Obesity and socioeconomic status in children and adolescents: United States, 2005-2008. NCHS Data Brief. 2010;(51):1–8
36. Drewnowski A, Specter SE. Poverty and obesity: the role of energy density and energy costs. Am J Clin Nutr. 2004;79(1):6–16
37. Black JL, Macinko J. Neighborhoods and obesity. Nutr Rev. 2008;66(1): 2–20
39. Carlson JA, Mignano AM, Norman GJ, et al. Socioeconomic disparities in elementary school practices and children’s physical activity during school. Am J Health Promot. 2014;28(suppl 3):S47–S53
40. Larson NI, Story MT, Nelson MC. Neighborhood environments: disparities in access to healthy foods in the U.S. Am J Prev Med. 2009;36(1):74–81
41. Franklin B, Jones A, Love D, Puckett S, Macklin J, White-Means S. Exploring mediators of food insecurity and obesity: a review of recent literature.
J Community Health. 2012;37(1): 253–264
42. Iannotti RJ, Wang J. Trends in physical activity, sedentary behavior, diet, and BMI among US adolescents, 2001-2009.
Pediatrics. 2013;132(4):606–614 43. Gu X, Tucker KL. Dietary quality of the
US child and adolescent population: trends from 1999 to 2012 and associations with the use of federal nutrition assistance programs. Am J Clin Nutr. 2017;105(1):194–202 44. Benjamin EJ, Blaha MJ, Chiuve SE, et al;
American Heart Association Statistics Committee and Stroke Statistics Subcommittee. Heart disease and stroke statistics-2017 update: a report from the American Heart Association. Circulation. 2017;135(10):e146–e603
45. Cohen DA, Han B, Derose KP, et al. Neighborhood poverty, park use, and park-based physical activity in a Southern California city. Soc Sci Med. 2012;75(12):2317–2325
46. US Department of Health and Human Services. Step it up! The surgeon general’s call to action to promote walking and walkable communities. 2015. Available at: https:// www. surgeongeneral. gov/ library/ calls/ walking- and- walkable- communities/ call- to- action- walking- and- walkable- communites. pdf. Accessed January 30, 2018
47. Dabelea D, Mayer-Davis EJ, Saydah S, et al; SEARCH for Diabetes in Youth Study. Prevalence of type 1 and
type 2 diabetes among children and adolescents from 2001 to 2009. JAMA. 2014;311(17):1778–1786
48. Goran MI, Ball GD, Cruz ML. Obesity and risk of type 2 diabetes and cardiovascular disease in children and adolescents. J Clin Endocrinol Metab. 2003;88(4):1417–1427
49. Parish RC, Todman S, Jain SK. Resting heart rate variability, inflammation, and insulin resistance in overweight and obese adolescents. Metab Syndr Relat Disord. 2016;14(6):291–297 50. George MG, Tong X, Bowman BA. Prevalence of cardiovascular risk factors and strokes in younger adults. JAMA Neurol. 2017;74(6): 695–703
51. Imperatore G, Boyle JP, Thompson TJ, et al. Projections of type 1 and type 2 diabetes burden in the U.S. population aged <20 years through 2050. Dynamic modeling of incidence, mortality, and population growth. Diabetes Care. 2012;35(12):2515–2520
52. Thompson AB, Mowery PD, Tebes JK, McKee SA. Time trends in smoking onset by sex and race/ethnicity among adolescents and young adults: findings from the 2006-2013 National Survey on Drug Use and Health. Nicotine Tob Res. 2018;20(3):312–320
53. Farrelly MC, Loomis BR, Han B, et al. A comprehensive examination of the influence of state tobacco control programs and policies on youth smoking. Am J Public Health. 2013;103(3):549–555
54. Collaco JM, Drummond MB, McGrath-Morrow SA. Electronic cigarette use and exposure in the pediatric population. JAMA Pediatr. 2015;169(2):177–182
55. Azofeifa A, Mattson ME, Schauer G, McAfee T, Grant A, Lyerla R. National estimates of marijuana use and related indicators - National Survey on Drug Use and Health, United States, 2002-2014. MMWR Surveill Summ. 2016;65(11):1–28
56. Kit BK, Kuklina E, Carroll MD, Ostchega Y, Freedman DS, Ogden CL. Prevalence
of and trends in dyslipidemia and blood pressure among US children and adolescents, 1999-2012. JAMA Pediatr. 2015;169(3):272–279
57. Yang Q, Zhong Y, Merritt R, Cogswell ME. Trends in high blood pressure among United States adolescents across body weight category between 1988 and 2012. J Pediatr. 2016;169:166–173.e3
58. George MG, Tong X, Wigington C, Gillespie C, Hong Y; Centers for Disease Control and Prevention (CDC). Hypertension screening in children and adolescents–National Ambulatory Medical Care Survey, National Hospital Ambulatory Medical Care Survey, and Medical Expenditure Panel Survey, United States, 2007-2010. MMWR Suppl. 2014;63(2):47–53
59. Lloyd-Jones DM, Hong Y, Labarthe D, et al; American Heart Association Strategic Planning Task Force and Statistics Committee. Defining and setting national goals for cardiovascular health promotion and disease reduction: the American Heart Association’s strategic impact goal through 2020 and beyond. Circulation. 2010;121(4):586–613
60. Juhola J, Magnussen CG, Berenson GS, et al. Combined effects of child and adult elevated blood pressure on subclinical atherosclerosis: the International Childhood Cardiovascular Cohort Consortium. Circulation. 2013;128(3):217–224
61. Adler NE, Cutler DM, Fielding JE, et al. Addressing social determinants of health and health disparities. 2016. Available at: https:// nam. edu/ wp- content/ uploads/ 2016/ 09/ Addressing- Social- Determinants- of- Health- and- Health- Disparities. pdf. Accessed February 14, 2018
DOI: 10.1542/peds.2018-1089 originally published online October 17, 2018;
2018;142;
Pediatrics
Sandra L. Jackson, Emily C. Yang and Zefeng Zhang
Income Disparities and Cardiovascular Risk Factors Among Adolescents
Services
Updated Information &
http://pediatrics.aappublications.org/content/142/5/e20181089 including high resolution figures, can be found at:
References
http://pediatrics.aappublications.org/content/142/5/e20181089#BIBL This article cites 55 articles, 20 of which you can access for free at:
Subspecialty Collections
http://www.aappublications.org/cgi/collection/public_health_sub
Public Health
http://www.aappublications.org/cgi/collection/obesity_new_sub
Obesity
following collection(s):
This article, along with others on similar topics, appears in the
Permissions & Licensing
http://www.aappublications.org/site/misc/Permissions.xhtml in its entirety can be found online at:
Information about reproducing this article in parts (figures, tables) or
Reprints
DOI: 10.1542/peds.2018-1089 originally published online October 17, 2018;
2018;142;
Pediatrics
Sandra L. Jackson, Emily C. Yang and Zefeng Zhang
Income Disparities and Cardiovascular Risk Factors Among Adolescents
http://pediatrics.aappublications.org/content/142/5/e20181089
located on the World Wide Web at:
The online version of this article, along with updated information and services, is
http://pediatrics.aappublications.org/content/suppl/2018/10/15/peds.2018-1089.DCSupplemental Data Supplement at:
by the American Academy of Pediatrics. All rights reserved. Print ISSN: 1073-0397.