A Proposed Design for The Development of
Vital Sign(Electrocardiogram) Patient
Monitoring System
MD. MOKARRAM HOSSAIN
Lecturer, Stamford University Bangladesh, Dhaka, Bangladesh
A.S.M.MOHSIN
Lecturer, Stamford University Bangladesh, Dhaka, Bangladesh
IFAT-AL-BAQEE
Lecturer, Stamford University Bangladesh, Dhaka, Bangladesh
AHMED-UR-RAHMAN
System Engineer - NOC, NovoTel Ltd, International Telecom Gateway, Dhaka, Bangladesh.
RAKIBUL ISLAM RONY
WiMAX Engineer, Huawei Technologies Bangladesh Ltd.
Abstract
The vital signs monitor is essentially a real time device that displays certain received signals from the human body. It is widely used in medical institutes. The projects of this sort under taken so far have used windows to display the output whereas this project aims to generate a real time display of the signals received from the human body using Linux. Linux was preferred for its ability to simultaneously process data and display it in real time. This includes creating appropriate sensors, proper modifying circuits and ensuring real time display. The project has a channel for the variable that will be continuously measured and displayed by the device. The variable is electrocardiogram.
The development of this project was circled around the need for real time display. Appropriate circuits modified the input signals to make them suitable for DAQ card reading. Linux was used to display the output of DAQ card in real time. This enhanced the real time characteristic of the output.
Key Words: Electrocardiogram (ECG); Data Acquisition Card; Electro gram Circuit; Electrocardiogram pin configuration; Experimental Graph of ECG.
1. Introduction
The objective of Patient Monitoring Systems is to have a quantitative assessment of the important physiological variable of patients during critical periods of biological functions. For diagnostic and research purposes it is necessary to know actual value or trend of change of this variable. Patient monitoring systems are used for measuring continuously or at regular intervals, automatically, the values of patient's important physiological parameters.
There are several categories of patients who may need continuous monitoring or intensive care. Critically ill patients recovering from surgery, heart attack or serious illness, are often placed in special units, generally known as intensive care units, where they can be supervised constantly by the use of electronic instruments.
The main features of patient monitoring systems
d. Ensuring better care.
The most often monitored biological functions are Electrocardiogram (ECG), heart rate, pulse rate, temperature and respiratory rate. Among these body temperature is the centre of this thesis.
2. Electrocardiogram (ECG)
The recording of electrical activity associated with the functioning of the heart is known as Electrocardiogram. ECG acts as a recorder of bioelectric events. The waveforms thus derived from ECG have been standardized in terms of amplitude and phase relationships and any deviation from this would reflect the presence of abnormality.
a. Data Acquisition Card
The Data Acquisition Card (DAQ card) was used to digitize the analog output of the circuits. Certain changes were made to the circuits to accommodate this process. The DAQ card fed its digitized data to the computer which worked using Linux. This ensured real time display as the aim of this project was to enhance the real time display characteristics of a Vital Signs Monitor.
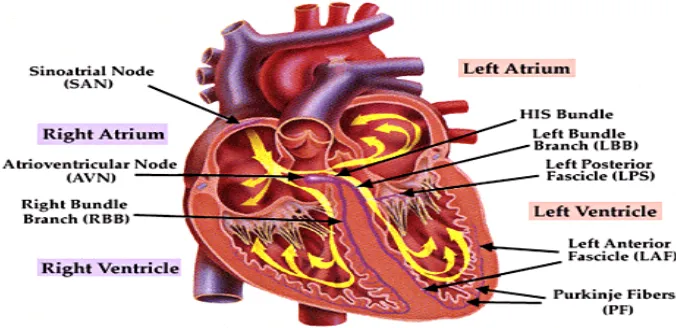
b. Physiological Structure of the Heart
The heart is basically a four chamber pumping system where the ventricles perform must of the pumping functions. The atria are only chambers used for storing blood, when the ventricles are performing their pumping functions. The phase where the ventricles are filled with blood is referred to as the “diastole stage”. The pumping of the blood out of the ventricles is referred to as the “systole” stage. It has been shown over the past century that rhythmic contraction of the atria and ventricles has an electrical characteristic. The rhythmic contraction of the atria and the ventricles is set up by a pattern of electrical activity in the muscular structure of the atria and ventricular walls.
The pace-making cells located at the Sinoatrial (SA) node, located between the vena cava and the right atrium is where the rhythmic cardiac impulse is generated. It can be seen that there are three routes or directions from the SA to the Atrio-Ventricular node, there are as follows: Anterior, Middle and Posterior inter-nodal tracts. Bachman’s Bundle connects the SA node and the Left Atrium through the anterior tract. Therefore, it can be inferred that the right atrium is activated before the left atrium.
The specialized conduction system is relatively small is relation to the heart’s overall size. The wall of the left ventricle is approximately three times the size of the wall of the right ventricle. The septum is also as thick as the left ventricular wall. The majority of the muscle mass of the ventricular wall consists of the free walls of the left and right ventricles and the septum. If we consider the heart being an electrical source, the signal strength is proportional to the mass of active muscle (also referred to active myocardial cells). Therefore it can be seen that
the free wall of both the atria and ventricles and the septum are major contributors to this electrical source.
Even the lungs, although mostly filled with air, conduct electricity to a surprising extent, and fluids in other tissues surrounding the heart conduct electricity even more easily. Therefore, the heart is actually suspended in a conductive medium. When one portion of the ventricles depolarizes and therefore becomes electronegative with respect to the remainder, electrical current flows from the depolarized area to the polarized area in large
circuitous routes.
The cardiac impulse first arrives in the ventricles in the septum (division between two ventricles) and shortly thereafter spreads to the inside surfaces of the remainder of the ventricles. This provides electro-negativity on the insides of the ventricles and electro-positivity on the outer walls of the ventricles, with electrical current flowing through the fluids surrounding the ventricles along elliptical paths. If one algebraically averages all the lines of current flow (the elliptical lines), one finds that the average current flow occurs with negativity toward the base of the heart and with positivity toward the apex.
During most of the remainder of the depolarization process, current also continues to flow in this same direction, while depolarization spreads from the inside outward through the ventricular muscle mass. Then, immediately before depolarization has completed its course through the ventricles, the average direction of current flow reverses for about 0.01 second, flowing from the ventricular apex toward the base, because the last part of the heart to become depolarized is the outer walls of the ventricles near the base of the heart.
In normal heart ventricles, current flows from negative to positive primarily in the direction from the base of the heart toward the apex during almost the entire cycle of depolarization, except at the very end. And if a meter is connected to electrodes on the surface of the body, the electrode nearer to the base will be negative, whereas the electrode nearer to the apex will be positive, and the recording meter will show positive recording in the electrocardiogram
The electrocardiogram is composed of waves and complexes. Waves and complexes in the normal sinus rhythm are the P wave, PR Interval, PR Segment, QRS Complex, ST Segment, QT Interval and T wave.
Fig 02: PQRST Curve
c. Normal Voltages in the Electrocardiogram
The recorded voltages of the waves in the normal electrocardiogram depend on the manner in which the electrodes are applied to the surface of the body and how close the electrodes are to the heart. When one electrode is placed directly over the ventricles and a second electrode is placed elsewhere on the body away from the heart, the voltage of the QRS complex may be as great as 3 to 4 millivolts. When electrocardiograms are recorded from electrodes on the two arms or on one arm and one leg, the voltage of the QRS complex usually is 1.0 to 1.5 millivolt from the top of the R wave to the bottom of the S wave; the voltage of the P wave is between 0.1 and 0.3 millivolt; and that of the T wave is between 0.2 and 0.3 millivolt. By convention:
A wave of depolarization approaching the positive electrodes results in an upward deflection of EKG A wave of depolarization approaching the negative electrodes results in a downward deflection of the
EKG tracing.
A wave of depolarization proceeding parallel to an electrode axis (the line connecting two electrodes) produces the maximal deflection of that dipole.
3. Electrogram Circuit
Fig 03: Einthoven connection
Fig 04: Block Diagram of Implemented Circuit Fig 05: ECG circuit diagram
5.0 Experimental Graph of ECG
Output wave shape of ECG is shown below
Fig 08: ECG Output
6.0 Conclusion
The project was essentially three fold. Three separate channels were constructed to read real time data through the DAQ card. However, due to dearth of necessary IC in the market, it was not possible to acquire the necessary components. Hence, alternative circuits were used where ever necessary.
Out of the three channels, two were successfully implemented. The entire channel of Temperature was implemented which successfully reads output through the DAQ card and displays it in soft real time. The purpose of the project was to enhance the real time properties of the display of human physiological variables and that has been successfully implemented and recorded. The ECG curve has been recorded using digital oscilloscope, which digitizes the input and enables analysis. It will be possible to use the same channel and feed the input into the DAQ card which in turn will provide the digitized input to the Linux computer. Real time Linux can be used in this project without any further modification.
References
[1] Body Temperature, Bets Davis, http://health.yahoo.com/infectiousdisease-symptoms/body-temperature/healthwise.
[2]Md. Mazlan Abdul Jabar, http://www.geocities.com/nazlen_2000/web July 1999, National Semiconductor Applications for Pico Products, Pico Technology Limited, St. Neots, Cambridgeshire, UK, “Electrocardiogram (ECG) project for DrDaq,” 2005 [3] http://www.picotech.com/applications/ecg.html.
[4] http://focus.ti.com/docs/solution/folders/print/330.html [5]http://www.vision.net.au/~apaterson/science/hypoxia.htm
[6]http://www.faqs.org/docs/Linux-HOWTO/RTLinux-HOWTO.html#s3 [7]http://focus.ti.com/docs/solution/folders/print/330.html