AUTOMATED FABRIC DEFECT DETECTION USING
MATLAB
Utkarsha Singh
1, Teesta Moitra
2, Neha Dubey
3, Mrs M.V.Patil
41,2,3,4
Electronics, Bharati Vidyapeeth University College of Engineering , Maharashtra,(India)
ABSTRACT
Quality control at each stage of production in textile industry has become a key factor to retaining the existence
in the highly competitive global market. Problems of manual fabric defect inspection are lack of accuracy and
high time consumption, where early and accurate fabric defect detection is a significant phase of quality
control. Vision based inspection of industrial products offers low-cost, high-speed, and high-quality detection of
defects. Some of the most challenging industrial inspection problems deal with the textured materials such as
textile web, paper, and wood. The inspection problem encountered in textured materials become texture analysis
problems at microscopic levels. Textured materials take many forms and while there is a remarkable similarity
in overall automation requirements for visual inspection, the cost-effective solutions are application specific
and generally require extensive research and development efforts. The fabric has a regular pattern and texture
properties. The regions that deform the regular pattern and cause the change on the appearance and physical
properties of the fabric are called as ‘defect’. The defects may be evaluated as ‘major’ and ‘minor’ types. Some
of them are encountered commonly and some of them are seen rarely. There is a growing need for automated
fabric defect inspection system in the textile industry. Many attempts are made to replace the traditional human
inspection by automated visual systems; An image of woven fabric sample can be regarded as a typical textured
image. The detection of local fabric defects is one of the most intriguing problems in computer vision. This
project aims at developing a system to automatically detect the defects in Fabric Texture.
Keywords: Fabric Defect, Computer Vision, Defect Classification, Performance Metrics, MATLAB
I. INTRODUCTION
The primary requirments of such a system will be greater accuracy, minimum time and minimum cost. The
fabric image could be captured through a camera and from the image obtained the defect could be identified.
The fabric image could be considered as a regular textured image. Once the fabric is identified as defective, the
location and the area of defects needs to be identified. Advanced loom machines are able to detect some faults
by themselves , however, there is still significant amount of defects, that need to be inspected later, after the
weaving stage. Defects like broken pick or coarse yarn are sorts of defects that can be detected directly on the
loom. In contrast, those defects like appearance fault, a stain, a hole or a weft kinks, belong to class of defects
that remain unnoticed by any other systems than the visual. It should be noted that the inspection problems
encountered in uniforms webs become texture analysis problems at microscopic levels. Differences in the mean
gray level or in color in small Neighbourhoods alone are not always sufficient for defect detection. Rather, one
has to rely on differences in the spatial arrangement of gray level values in the neighbouring pixels. Defect
texture are needed in order to decide whether a given region has uniform texture. A region in an image has a
constant texture if a set of local statistics or other local properties of texture are constant, slowly varying, or
approximately periodic .Gabor filters are used to identify different textures. The texture with high intensity will
get smoothened and also the texture with low intensity will get isolated. After this method a simple
Thresholding is applied to segregate the defective area in the image and further the image is converted into
binary image .Morphological operations are done on the thresholded image in order to remove the errors like
holes.
II. LITERATURE REVIEW
Various approaches for fabric defect detection have been proposed in the past two decades. The texture analysis
techniques for fabric defect detection are intuitively appealing, because they allow us to capture texture features,
which are statistically used to segment fabric defects. Gray-level texture features extracted from co-occurrence
matrix , mean and standard deviations of sub-blocks, autocorrelation of sub-images, and Karhunen–Loève (KL)
transform have been used for the segmentation of local fabric defects. Cohen et al. have characterized the
fabric texture using the Gauss Markov random field (GMRF) model and the textile web inspection process is
treated as a hypothesis-testing problem on the statistics derived from this model. Campbell et al. use model
based clustering to segment defects from the denim fabric. The fabric texture exhibits a high degree of
periodicity and, hence, Fourier-domain features have been used for the detection of fabric defects, Since the
Fourier bases are of infinite length, the contribution from each of the spectral components is difficult to
quantify. Therefore, Fourier analysis is not suitable for detection of local defects. Instead, detection of local
fabric defects requires multi-resolution decomposition of fabric images across several scales. A feature vector
composed of significant features at each scales is used for the identification of defects. Such a multi-resolution
analysis of fabric using Discrete wavelet transform (DWT) has been detailed in – . Jasper et al. use
texture-adapted wavelet bases whose response is close to zero for normal fabric texture and significantly different for
fabric defect, thereby enabling detection. Escofet et al. use multi-scale Gabor filters for textile web defect
detection. Ajay and Pang have demonstrated fabric defect detection using only real Gabor functions. Also, in
paper, Ajay and Pang investigate various approaches for automated inspection of textured materials using Gabor
wavelet features. A new supervised defect detection approach to detect a class of defects in textile webs is
proposed. Unsupervised web inspection using multichannel filtering scheme is investigated.
III. MATERIALS USED AND METHODS
3.1 Description
The image of the fabric under test is taken as input. The image frame is converted to 8 bit gray level format. The
noises are occurred because of illumination change, fabric structure and impurities in the fabric. They are
removed by using Wiener low-pass filter and mean filter.The noise removed image is convolved with Gabor
filter. Thus, the defective area is accentuated and the regular fabric texture is attenuated. In order to make the
image smooth, the image is then convolved with Gaussian operator. The filtered image is converted into the
binary form. Thus, the defective area is identified and clarified. The binarization process is achieved by using
double thresholding method. Two thresholding values; upper and lower thresholds are determined by using the
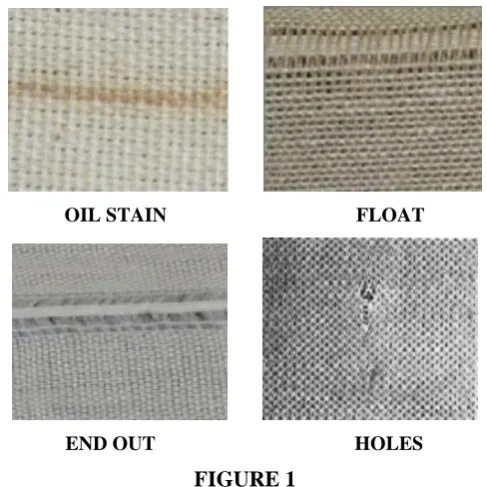
OIL STAIN FLOAT
END OUT HOLES
FIGURE 1
3.2 Texture Boundary Detection
• Edge extraction using 2-D Gabor filters smears the edge information
• The magnitude of the 1-D Gabor filter output is used as a feature to detect boundaries for texture-like images • Advantage of 1-D processing: Feature extraction and edge extraction are applied along orthogonal directions.
The Gaussian function (1-D) of the Gabor filter will not effect the edge information in the orthogonal direction
• The edge evidence obtained from a set of Gabor filters are combined using a constraint satisfaction neural
network to obtain the final output
3.3 Fourier Transform
Although the Fourier transform of the entire time series does contain information about the spectral components
in time series, it cannot detect the time distribution of different frequency, so for a large class of practical
applications, the Fourier transform is unsuitable. So the time-frequency analysis is proposed and applied in some
special situations. The STFT is most often used.
3.4 Gabor Filters
Gabor filters are used to identify different textures. In the process of filtering, the texture with high intensity will
get smoothened and also the texture with low intensity will get isolated. The parameters of the Gabor filter
needs to be chosen appropriately to isolate the defective region in the fabric image. After tuning the parameters
a simple thresholding method is applied to segregate the defective area in the image. Gabor filters can
decompose the image into components corresponding to different scales and orientations. Gabor filters achieve
optimal joint localization in spatial and spatial frequency domain and, therefore, have been used extensively for
texture analysis – and document analysis , and object detection .
3.4.1 Gabor Filter Parameters
Wavelength (λ )
This parameter represents the cosine factor of the Gabor filter kernel. Its values are specified in pixels which
hold the real number value greater than or equal to 2. The value =2 should not be used in combination with
order to avoid the undesired effects at the image borders and to get the better result, the wavelength value should
be smaller than or equal to one fifth of the input image size. The images shown in Figure 3.1a,b,c, shows the
Gabor filter kernels with values of the wavelength parameter of 5, 10 and 15 respectively. The values of the
other parameters are orientation 0, phase offset 0, aspect ratio 0.5, and bandwidth 1.
Orientation (θ)
This parameter specifies the orientation of the normal to the parallel stripes of a Gabor function. Its value is
specified in degrees and it can fall between 0 and 360. This orientation value depends upon the orientation of the
edges in the image. Only for that particular theta value, the results will hold perfect. The images in Figure 3.2
shows the Gabor filter kernels with orientation 90, 45 and 0 respectively. The values of the other parameters are:
wavelength 10, phase offset 0, aspect ratio 0.5, and bandwidth 1.
Bandwidth (b)
The parameter, b depends on the ratio, where is the standard deviation of the Gaussian factor of the Gabor
function and is the preferred wavelength The value of cannot be specified directly. It can only be changed
through the bandwidth b. The bandwidth value must be specified as a real positive number. Default is 1, in
which case and are connected as: = 0.56 . The smaller bandwidth results in larger , larger support of the Gabor
function and larger number of visible parallel excitatory and inhibitory stripe zones. The images in Figure 3.5
shows Gabor filter kernels with bandwidth parameter 0.5, 1, and 2, from left to right, respectively. The values of
the other parameters are wavelength 10, orientation 0, phase offset 0, and aspect ratio 0.5.
3.5 Thresholding
In the process the filtered image will have the texture regions as low energy points and the defected region as
high energy points. A hard threshold is applied on the response of the filter bank, to identify the defective area.
This process results in a binary image where black pixels correspond to defect free area and white pixels
correspond to defective area. The algorithm is experimented on fabric images with 16 different defects that
occur in the fabric industry. The defective images are taken from different fabric materials. The defect free
portion is used for identifying the parameters. Among the parameters wavelength and bandwidth affect the
response of the filter depending on the scale of the image (ie) when the thread is small and the defective area is
Aspect ratio and phase offset has minimal effect in identifying the defective area. Hence these parameters are
kept constant. The orientation parameter affects the response of the filter depending on the orientation of the
threads and the defective thread orientation. Hence the parameters and are identified from the un-defective
image .These parameters are then used for the filter bank to identify the defective area. The average response is
taken and thresholded, which result in a binary image showing the defective area in white color. To calculate the
accuracy of the algorithm the defective area is manually selected by the user. The difference between the
location selected by the user and the location given by algorithm is calculated.
3.5 Specifications
Domain - Image processing
Software - MATLAB
System Requirements - 1. Minimum 1 GB RAM
2 Dual core processor
IV. RESULTS
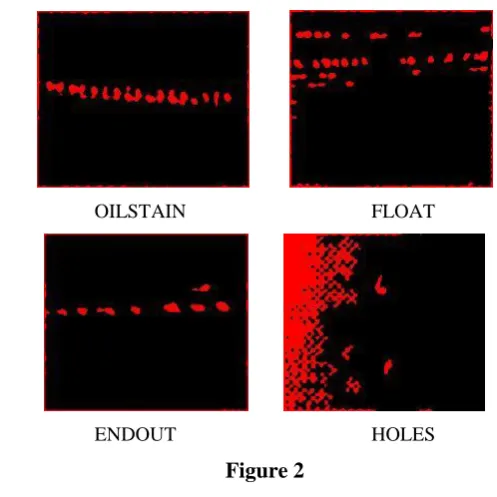
After putting the image under test, then converting it into RGB making it noise free, then smoothening the
defect free region and isolating the defected region, then highlighting the low intensity and high intensity points
,then applying Gabor filter technique which is designed in MATLAB using commands from help, the detection
of defects can be accurately done. Fig 1 represents the image under test through various sections. we can
accurately detect the defected region.
OILSTAIN FLOAT
ENDOUT HOLES
Figure 2
V. CONCLUSION
In this paper, a supervised defect detection approach to detect a class of fabric defects has been demonstrated.
The experimental results conducted on various defective images shows that locating the defects in a fabric
image can be achieved with the parameters of Gabor filter. The Gabor filter followed by Thresholding helps to
VI. ACKNOWLEDGEMENTS
We are highly grateful to our guide Mrs. M.V PATIL (Electronic Engineering Department BVCOE) for
allowing us to pursue this project at the college workshop and for her continuous intellectual support in the form
of her valuable ideas, guidelines and constructive criticism. We are also thankful to our H.O.D Prof. SHINDE
for allowing us to go ahead with this project. We are indebted to members of Electronic Engineering
Department for showing trust in our ideas about the project. For all those who helped us directly or indirectly in
completing this project, we would like to put across our sincere thanks.
REFERENCES
[1]. Ajay Kumar, Grantham K. H. Pang, "Defect Detection in Textured Materials Using Gabor Filters" IEEE
TRANSACTIONS ON INDUSTRY APPLICATIONS, VOL. 38, NO. 2, MARCH/APRIL 2002
[2]. Padmavathi S, Prem P, Praveenn D "Locating Fabric Defects Using Gabor Filters" International Journal of
Scientific Research Engineering & Technology (IJSRET) Volume 2 Issue 8 pp 472-478 November 2013.
[3]. C.H.Chan, H.Liu, T.Kwan, G. Pang, “Automated technology for fabric inspection system,” Conference on
applications of automation science and technology, City University of Hong Kong, Nov.24-26, 1998.
[4]. H.S. Liu, C.H.Chan, T. Kwan, G.Pang, “Neural-Computing in fabrics inspection system,” Int. Symp. on