Blood Pressure Percentiles by Age and Height From
Nonoverweight Children and Adolescents in Germany
WHAT’S KNOWN ON THIS SUBJECT: Current pediatric US blood pressure references are widely used internationally because of scarce international data and rare percentile derivation by age and height simultaneously. However, the US references may not fit other populations, and improved statistical methods have become available.
WHAT THIS STUDY ADDS: The German blood pressure references by age and height from nonoverweight children and adolescents aged 3 to 17 years use a national sample,
oscillometric measurements validated in children, and improved statistical methods. These references were not influenced by the increasing prevalence of overweight children in the sample.
abstract
OBJECTIVES:To present oscillometric blood pressure (BP) references from German nonoverweight children and compare them with US references.
METHODS:From children and adolescents, aged 3 to 17 years, from the German Health Interview and Examination Survey for Children and Adolescents (KiGGS 2003–2006), we obtained standardized BP mea-surements by using an oscillometric device validated in children. Gender-specific systolic (SBP) and diastolic (DBP) BP percentiles, which simultaneously accounted for age and height by use of advanced statistical methods, were derived from nonoverweight children to avoid overweight prevalence in the reference population influencing BP references.
RESULTS:The age- and gender-specific 95th percentiles from nonover-weight children (n⫽12 199) were lower by up to 3 mm Hg for SBP and up to 2 mm Hg for DBP compared with the total sample (N⫽14 349). KiGGS percentiles from nonoverweight children accounting simultane-ously for age and height were mostly lower than in the US reference sample but higher for SBP in boys aged 14 years or older. At median height, the age-specific differences in 95th percentiles of SBP ranged from⫺4 to 4 mm Hg in boys and⫺2 to 1 mm Hg in girls and, for DBP, from⫺6 to 2 mm Hg in boys and⫺5 to 2 mm Hg in girls.
CONCLUSIONS:Compared with current US references, the proposed German BP reference values are not influenced by the prevalence of overweight children in the reference population, they are based on a validated oscillometric device, and they take advantage of improved statistical methods.Pediatrics2011;127:e978–e988
AUTHORS:Hannelore K. Neuhauser, MD, MPH,aMichael
Thamm, MD,aUte Ellert, PhD,aHans Werner Hense, MD,
PhD,band Angelika Schaffrath Rosario, MSca
aDepartment of Epidemiology and Health Reporting, Robert Koch
Institute, Berlin, Germany; andbInstitute for Epidemiology and
Social Medicine, University Muenster, Muenster, Germany
KEY WORDS
blood pressure, hypertension, population, population-based study, percentiles
ABBREVIATIONS
BP—blood pressure
KiGGS—German Health Interview and Examination Survey for Children and Adolescents
CDC—Centers for Disease Control and Prevention SBP—systolic blood pressure
DBP—diastolic blood pressure
GAMLLS—generalized additive models for location scale and shape
www.pediatrics.org/cgi/doi/10.1542/peds.2010-1290
doi:10.1542/peds.2010-1290
Accepted for publication Dec 10, 2010
Address correspondence to Hannelore K. Neuhauser, MD, MPH, Robert Koch Institute, Department of Epidemiology and Health Reporting, General-Pape-Strasse 62-66, 12101 Berlin, Germany. E-mail: neuhauserh@rki.de
PEDIATRICS (ISSN Numbers: Print, 0031-4005; Online, 1098-4275).
Copyright © 2011 by the American Academy of Pediatrics
Elevated blood pressure (BP) in child-hood and adolescence is increasingly gaining attention because of its asso-ciation with subclinical organ dam-age1–5 and to its tracking into
adult-hood hypertension.6 By widespread
convention, the 95th BP percentile of a reference population defines hyper-tension and the 90th BP percentile de-fines prehypertension in children.
Older European reference values7 are
based on heterogeneous pooled data from 6 regional European studies and were dismissed in the 2009 Guidelines for Management of High Blood Pressure in Children and Adolescents: Recommen-dations of the European Society of Hyper-tension (2009 European guidelines)8for
not accounting for age and height simul-taneously. None of the few more recent European reference values9–11fulfill the
desirable criteria, foremost standard-ized BP measurement either using the auscultatory method or an oscillomet-ric method with good validation re-sults (preferably in children), popula-tion sampling, a sufficiently large age range, and reference value presenta-tion by age and height percentile si-multaneously. Therefore, the 2009 Eu-ropean guidelines recommend use of the US reference values presented in the “Fourth Report on the Diagnosis, Evaluation, and Treatment of High Blood Pressure in Children and Adoles-cents” (Fourth Report).12
The aim of this study was to present BP reference values by age and height from children and adolescents aged 3 to 17 years on the basis of a nationally representative sample of 12 199 non-overweight children and adolescents who participated in the German Health Interview and Examination Survey on Children and Adolescents (KiGGS) 2003–2006 and had standardized BP measurements with an oscillometric device (Datascope Accutorr Plus [Da-tascope Corporation, Mahwah, NJ]) validated in children. We compared
these reference values with the Fourth-Report references. In addition, our goal was to illustrate how exclud-ing overweight children affects BP percentiles.
METHODS
Study Population
The KiGGS 2003–2006 study is a population-based cross-sectional study used to collect representative informa-tion on the health of children and adoles-cents aged 0 to 17 years living in Ger-many. The 2-stage sampling procedure involved the selection of 167 study loca-tions from strata formed according to federal state, community type, and pop-ulation size.13In a second step, an equal
number of children per birth year from each location were identified through lo-cal population registries and invited to participate in the study. The response rate was 66.6%, and 17 641 children and adolescents aged 0 to 17 years partici-pated in the study (8656 girls and 8985 boys). The study was approved by the ethical committee of Charité–University Medicine, Berlin, and by the Federal Com-missioner for Data Protection and Free-dom of Information. Informed written consent and assent were obtained from all parents and from adolescents aged 14 years or older. The KiGGS includes 17% of children with a 2-sided migration background; migrants from Turkey and the former Soviet Union were the 2 larg-est groups.13 A computer-assisted
per-sonal interview by a study physician covered current and past medical condi-tions and medication within the 7 days preceding the interview. The girls’ me-dian age at menarche was 12.8 years, and the boys’ voices started breaking/ reached full adult pitch at a median of 13.5/15.1 years.14
Measurements
In children aged 3 to 17 years, 2 read-ings of systolic blood pressure (SBP), diastolic blood pressure (DBP), and
mean arterial BP and heart rate were obtained by using an automated oscil-lometric device (Datascope Accutorr Plus) at 2-minute intervals after a non-strenuous part of the examination and an additional 5-minute rest.15The
mea-surements were taken using the right arm, in the sitting position with the el-bow at the level of the right atrium, using 1 of 4 cuff sizes (6⫻12, 9⫻18, 12⫻23, or 17⫻38.6 cm), which had to cover at least two-thirds of the upper arm length (from the axilla to the ante-cubital fossa). The mean of the 2 mea-surements was used for analysis.
Body height was measured by trained staff according to a standardized pro-tocol to the nearest 0.1 cm by using portable devices (Harpenden Stadiom-eter; Holtain Ltd, Crymych, United King-dom). Body weight was measured with the child wearing only underwear to the nearest 0.1 kg with a calibrated scale (Seca, Birmingham, United King-dom).13BMI was calculated as the ratio
of weight (in kg) by height2(in m2) and
rounded to 3 digits. A BMI at ⬎90th percentile for gender and age was cat-egorized as overweight according to the current German reference system by Kromeyer-Hauschild et al.16 KiGGS
BMI percentiles were published re-cently, but for individual diagnosis of overweight, the references of Kromeyer-Hauschild et al17 are still
recommended.
Inclusion and Exclusion Criteria for the Sample on Which the Percentiles Are Based
Of 14 836 KiGGS participants aged 3 to 17 years, we excluded 149 children with missing or invalid BP or height data, participants with chronic condi-tions possibly influencing growth (n⫽ 302)18or BP (n⫽30 [ie, chronic renal
[Ana-tomical Therapeutic Chemical Classifi-cation System codes C01-03 and C07-09 or any medication given with the indi-cation hypertension]). Seventeen chil-dren had⬎1 exclusion criterion, leav-ing 7038 girls and 7311 boys for analysis. For the BP percentiles by age and height from nonoverweight chil-dren, an additional 2150 overweight children were excluded (Table 1).
Statistical Analysis
BP percentiles as a function of either age or height were modeled using the LMS method19 with the program
LMSChartMaker Pro 2.2 (Medical
Re-search Council, London, United King-dom). The reference curves from non-overweight children by age and height simultaneously were fitted by using an extension of the LMS method for 2 co-variates, namely the generalized addi-tive models for location scale and shape (GAMLLS) with the Box-Cox-Cole-Green distribution family,20–22 fitted
with gamlss 1.9-4 in the free statistical software R 2.8.0 (www.cran.r-project. org). Both models require neither the assumption of a normal distribution nor of a constant variance of BP values with age and/or height. The skewness parameter L, the median M, and the
coefficient of variation S have been modeled as a function of age and/or height either as polynomials or non-parametrically by cubic splines. Height was entered in centimeters or as z scores (based on the KiGGS popula-tion18), and the version with the better
fit was used. Goodness of fit was exam-ined via the generalized Akaike infor-mation criterion with k ⫽ 8,20 Q
tests,23,24 and wurmplots25and by
ex-amining the percentage of data out-side the smoothed percentiles.
Models were fit for boys and girls sep-arately. DBP was normally distributed but with a coefficient of variation S that varied with age. Median DBP was given by a function quadratic in age and linear in heightzscore. SBP was log-normally distributed in girls; in boys, the distribution was even more skewed. The model for the median in-cluded a linear and quadratic term in age, a linear term for height and the interaction terms height ⫻ age and height⫻age.2In boys, Svaried with
age, whereas it was constant in girls. Only selected percentiles were tabu-lated in this study, but any (100␣) per-centileP␣can be calculated as
P␣⫽M(1⫹LSz␣)1⁄LforL⫽0
or
P␣⫽M⫻exp(Sz␣) forL⫽0,
withz␣ the␣ quantile of a standard normal distribution. For example, the 10th SBP percentile for a boy at 10 years and 140 cm is given by
103(1⫹
[⫺0.4685]0.0734[⫺1.282])⫺1⁄0.4685⫽
103⫻1.044⫺2.1345
and for a girl at this age and height by
104⫻exp(0.0763[⫺1.282]),
both of which equal 94 mm Hg. Age in years was used as a continuous vari-able and calculated to 3 decimal places. Fourth-Report values were cal-culated from the published formula12 TABLE 1 Baseline Characteristics of the Reference Population of Nonoverweight Children and
Adolescents (5989 Girls and 6210 Boys Aged 3–17 Years)
Age, y
3–6 7–10 11–13 14–17
Excluded only because of overweight,n
(weighted % of 7038 girls/7311 boys)
Boys 169 (8.9) 340 (15.8) 276 (18.2) 316 (16.9)
Girls 184 (9.4) 300 (14.7) 277 (18.6) 288 (16.5)
Children included,n
Boys 1719 1716 1240 1535
Girls 1652 1676 1177 1484
Weight, mean (SD), kg
Boys 19.3 (3.4) 30.3 (5.7) 44.5 (8.7) 63.1 (9.5)
Girls 19.0 (3.5) 29.8 (6.1) 45.5 (8.3) 56.3 (7.1)
Height, mean (SD), cm
Boys 111.3 (8.7) 135.3 (8.3) 155.3 (9.6) 175.3 (8.2)
Girls 110.7 (8.9) 134.4 (8.9) 156.1 (8.3) 164.9 (6.4)
BMI, mean (SD)
Boys 15.5 (1.0) 16.4 (1.6) 18.3 (2.1) 20.5 (2.2)
Girls 15.4 (1.1) 16.3 (1.8) 18.5 (2.2) 20.7 (2.1)
First SBP, mean (SD), mm Hg
Boys 98.9 (8.4) 102.8 (8.3) 109.7 (9.7) 120.9 (11.7)
Girls 99.0 (8.3) 103.4 (8.7) 110.4 (9.3) 114.4 (10.0)
Second SBP, mean (SD), mm Hg
Boys 96.7 (8.1) 101.3 (8.2) 107.8 (9.7) 118.5 (10.8)
Girls 96.9 (8.2) 101.7 (8.3) 108.6 (8.8) 112.4 (9.3)
Mean of first and second SBP, mean (SD), mm Hg
Boys 97.8 (7.6) 102.0 (7.7) 108.8 (9.2) 119.7 (10.6)
Girls 98.0 (7.6) 102.5 (8.0) 109.5 (8.4) 113.4 (9.1)
First DBP, mean (SD), mm Hg
Boys 60.6 (8.2) 63.4 (7.9) 66.5 (8.5) 70.9 (8.6)
Girls 61.3 (8.2) 63.7 (7.6) 66.8 (7.8) 70.2 (8.1)
Second DBP, mean (SD), mm Hg
Boys 58.3 (7.5) 61.5 (7.6) 64.5 (8.1) 68.7 (8.5)
Girls 58.9 (7.5) 61.9 (7.6) 64.6 (7.5) 67.7 (7.7)
Mean of first and second DBP, mean (SD), mm Hg
Boys 59.5 (6.8) 62.4 (6.7) 65.5 (7.3) 69.8 (7.6)
by using age as 3.5, 4.5, 5.5 and so in years. Calculations apart from the fitting of the percentile curves were conducted using SAS 9.2 (SAS Institute Inc, Cary, NC).
Sampling weights were used to ac-count for unequal sampling probabili-ties and to reflect the distribution of the population in Germany.13
RESULTS
The reference population of nonover-weight children and adolescents aged 3 to 17 years consisted of 6210 boys and 5989 girls. Baseline characteris-tics of the nonoverweight reference population are shown in Table 1. Smoothed BP percentiles from non-overweight children by age and height are shown in Tables 2 and 3. These BP references do not require consultation of additional height reference tables because the height percentiles are given in cm.
BP increased in children and adoles-cents aged 3 to 17 years by both age and height percentile. SBP and DBP were very similar in boys and girls un-til age 13 years. The pubertal rise was more pronounced in boys than in girls, resulting in BP differences between boys and girls up to 17 mm Hg for SBP 95th percentile and 2 mm Hg for DBP 95th percentile (at age 17.99 years, both for the 90th height percentile). At a given age and gender, BP percentiles vary by height. Figure 1 illustrates how the 95th BP percentile, which is com-monly taken for the definition of hyper-tension in children and adolescents, differs between the 5th and the 95th height percentile: SBP in boys by 2 to 8 mm Hg and in girls by 2 to 6 mm Hg and DBP by 2 mm Hg in both boys and girls.
To illustrate the impact of excluding overweight children from the refer-ence population, we compared BP per-centiles from nonoverweight children with those calculated without exclud-ing overweight children (all other ex-clusion criteria being the same). The
exclusion of overweight children re-sulted in slightly lower SBP and DBP for all percentiles both by age (Fig 2) and by height (data not shown but similar). This difference was more pronounced with increasing age and height and was generally more pronounced for the higher percentiles and in boys. For example, the difference between age-specific 95th percentiles for SBP from the samples with and without over-weight children in boys aged 14 to 17 years was 2.6 to 2.7 mm Hg and in girls it was 1.3 to 1.6 mm Hg. For DBP, the difference between age-specific 95th percentiles from the samples with and without overweight children aged 14 to 17 years was 1.1 to 1.7 mm Hg in boys and 0.1 to 0.6 mm Hg in girls.
We compared KiGGS and Fourth-Report BP percentiles, both modeled by age and height simultaneously. Of note, KiGGS references are based on a nonoverweight reference population whereas overweight children were not excluded from the Fourth-Report data set. Fig 3 shows KiGGS and Fourth-Report BP percentiles by age, both for median height according to Centers for Disease Control and Prevention (CDC) growth charts (www.cdc.gov/ growthcharts). Fourth-Report percen-tiles, which are based on a model that differs statistically from the KiGGS model, show a higher spread between the median and the outer percentiles. The 90th and 95th percentiles were mostly lower in the KiGGS, but they were higher for SBP in boys aged⬎14 years. At median CDC height, the differ-ence for the 95th percentile (KiGGS mi-nus Fourth-Report values) ranged by age for SBP from⫺4 to 4 mm Hg in boys and⫺2 to 1 mm Hg in girls; and for DBP from⫺6 to 2 mm Hg in boys and⫺5 to 2 mm Hg in girls.
DISCUSSION
This study presents BP references by age and height simultaneously for
chil-dren and adolescents aged 3 to 17 years. These findings are based on standardized BP measurements using a validated oscillometric device (Data-scope Accutorr Plus) on a nationally representative sample of 12 199 non-overweight children from the KiGGS 2003–2006 study in Germany. These references use both a database with high validity as a normative population and improved statistical methods for percentile derivation. However, KiGGS BP data are influenced by the BP epi-demic, which has touched Germany.17
Because of the strong relationship be-tween BP and overweight and obe-sity,26the inclusion of this high
propor-tion of overweight subjects would raise the threshold for normal BP (be-cause it would include those with obesity-induced BP elevations in the normative population). As a result, obesity-related BP elevations would be more difficult to detect (ie, the refer-ences would be less sensitive to obesity-related hypertension than ref-erences based on older data). To avoid this, we excluded overweight children from the reference population.
The widely used Fourth-Report BP ref-erences12 did not exclude overweight
children, but we compared them with the KiGGS references because they are both screening and detection tools for the same problem— elevated BP in children. As expected, we found mostly lower 90th and 95th percentiles in the KiGGS compared with the Fourth Re-port (by 2– 6 mm Hg). In a reanalysis of the Fourth-Report sample excluding overweight children,27
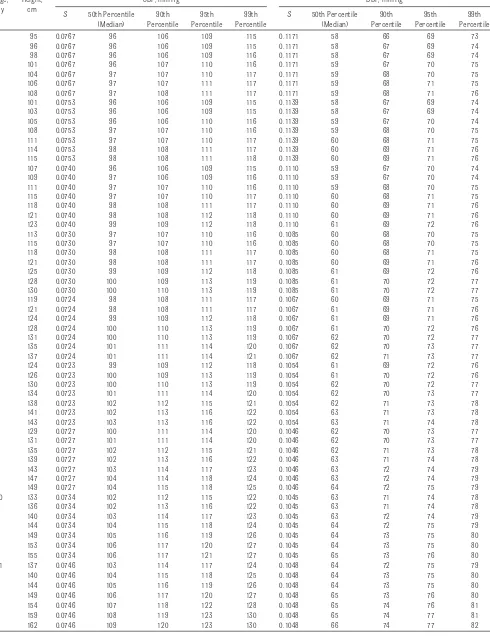
intra-TABLE 2 BP Levels from Nonoverweight Boys According to Age and Height (KiGGS Survey 2003–2006)
Age, y
Height, cm
SBP, mm Hg DBP, mm Hg
S 50th Percentile (Median)
90th Percentile
95th Percentile
99th Percentile
S 50th Percentile (Median)
90th Percentile
95th Percentile
99th Percentile
3 95 0.0767 96 106 109 115 0.1171 58 66 69 73
96 0.0767 96 106 109 115 0.1171 58 67 69 74
98 0.0767 96 106 109 116 0.1171 58 67 69 74
101 0.0767 96 107 110 116 0.1171 59 67 70 75
104 0.0767 97 107 110 117 0.1171 59 68 70 75
106 0.0767 97 107 111 117 0.1171 59 68 71 75
108 0.0767 97 108 111 117 0.1171 59 68 71 76
4 101 0.0753 96 106 109 115 0.1139 58 67 69 74
103 0.0753 96 106 109 115 0.1139 58 67 69 74
105 0.0753 96 106 110 116 0.1139 59 67 70 74
108 0.0753 97 107 110 116 0.1139 59 68 70 75
111 0.0753 97 107 110 117 0.1139 60 68 71 75
114 0.0753 98 108 111 117 0.1139 60 69 71 76
115 0.0753 98 108 111 118 0.1139 60 69 71 76
5 107 0.0740 96 106 109 115 0.1110 59 67 70 74
109 0.0740 97 106 109 116 0.1110 59 67 70 74
111 0.0740 97 107 110 116 0.1110 59 68 70 75
115 0.0740 97 107 110 117 0.1110 60 68 71 75
118 0.0740 98 108 111 117 0.1110 60 69 71 76
121 0.0740 98 108 112 118 0.1110 60 69 71 76
123 0.0740 99 109 112 118 0.1110 61 69 72 76
6 113 0.0730 97 107 110 116 0.1085 60 68 70 75
115 0.0730 97 107 110 116 0.1085 60 68 70 75
118 0.0730 98 108 111 117 0.1085 60 68 71 75
121 0.0730 98 108 111 117 0.1085 60 69 71 76
125 0.0730 99 109 112 118 0.1085 61 69 72 76
128 0.0730 100 109 113 119 0.1085 61 70 72 77
130 0.0730 100 110 113 119 0.1085 61 70 72 77
7 119 0.0724 98 108 111 117 0.1067 60 69 71 75
121 0.0724 98 108 111 117 0.1067 61 69 71 76
124 0.0724 99 109 112 118 0.1067 61 69 71 76
128 0.0724 100 110 113 119 0.1067 61 70 72 76
131 0.0724 100 110 113 119 0.1067 62 70 72 77
135 0.0724 101 111 114 120 0.1067 62 70 73 77
137 0.0724 101 111 114 121 0.1067 62 71 73 77
8 124 0.0723 99 109 112 118 0.1054 61 69 72 76
126 0.0723 100 109 113 119 0.1054 61 70 72 76
130 0.0723 100 110 113 119 0.1054 62 70 72 77
134 0.0723 101 111 114 120 0.1054 62 70 73 77
138 0.0723 102 112 115 121 0.1054 62 71 73 78
141 0.0723 102 113 116 122 0.1054 63 71 73 78
143 0.0723 103 113 116 122 0.1054 63 71 74 78
9 129 0.0727 100 111 114 120 0.1046 62 70 73 77
131 0.0727 101 111 114 120 0.1046 62 70 73 77
135 0.0727 102 112 115 121 0.1046 62 71 73 78
139 0.0727 102 113 116 122 0.1046 63 71 74 78
143 0.0727 103 114 117 123 0.1046 63 72 74 79
147 0.0727 104 114 118 124 0.1046 63 72 74 79
149 0.0727 104 115 118 125 0.1046 64 72 75 79
10 133 0.0734 102 112 115 122 0.1045 63 71 74 78
136 0.0734 102 113 116 122 0.1045 63 71 74 78
140 0.0734 103 114 117 123 0.1045 63 72 74 79
144 0.0734 104 115 118 124 0.1045 64 72 75 79
149 0.0734 105 116 119 126 0.1045 64 73 75 80
153 0.0734 106 117 120 127 0.1045 64 73 75 80
155 0.0734 106 117 121 127 0.1045 65 73 76 80
11 137 0.0746 103 114 117 124 0.1048 64 72 75 79
140 0.0746 104 115 118 125 0.1048 64 73 75 80
144 0.0746 105 116 119 126 0.1048 64 73 75 80
149 0.0746 106 117 120 127 0.1048 65 73 76 80
154 0.0746 107 118 122 128 0.1048 65 74 76 81
159 0.0746 108 119 123 130 0.1048 65 74 77 81
individual variation and inaccuracy of the BP device may be larger. However, for population monitoring of BP levels over time and for international com-parisons, a shift of the whole BP distri-bution of a few mm Hg is rather large because it has a substantial effect on the prevalence of hypertension28and
on hypertension-related outcomes. In adults, for example, a 4 –mm Hg
differ-ence in mean blood pressure level may lead to a 20% difference in stroke death.29
Additional reasons that may contrib-ute to the lower KiGGS nonoverweight BP percentiles compared with the Fourth-Report percentiles are the os-cillometric BP measurement in the KiGGS, which according to the Data-scope Accutorr validation study in
chil-dren30may lead to readings⬃1 mm Hg
(mean) less than auscultatory SBP and DBP, and the use of the mean of 2 read-ings in the KiGGS. However, not all KiGGS percentiles are lower, and it is not possible to merely modify the Fourth-Report percentile cutoff for a definition of prehypertension or hyper-tension. For example, thresholds for hypertensive SBP in boys aged ⬎14
TABLE 2 Continued
Age, y
Height, cm
SBP, mm Hg DBP, mm Hg
S 50th Percentile (Median)
90th Percentile
95th Percentile
99th Percentile
S 50th Percentile (Median)
90th Percentile
95th Percentile
99th Percentile
12 142 0.0762 105 117 120 127 0.1053 65 74 76 81
145 0.0762 106 117 121 128 0.1053 65 74 76 81
150 0.0762 107 119 122 129 0.1053 65 74 77 81
155 0.0762 109 120 123 131 0.1053 66 75 77 82
161 0.0762 110 121 125 132 0.1053 66 75 77 82
166 0.0762 111 123 126 133 0.1053 66 75 78 83
169 0.0762 112 123 127 134 0.1053 67 76 78 83
13 149 0.0780 108 120 123 131 0.1060 66 75 77 82
152 0.0780 109 121 124 132 0.1060 66 75 78 82
157 0.0780 110 122 126 133 0.1060 66 75 78 83
163 0.0780 112 124 127 135 0.1060 67 76 78 83
169 0.0780 113 125 129 137 0.1060 67 76 79 84
174 0.0780 114 127 130 138 0.1060 67 77 79 84
177 0.0780 115 127 131 139 0.1060 68 77 79 84
14 157 0.0799 111 124 128 135 0.1065 67 76 79 84
160 0.0799 112 125 128 136 0.1065 67 76 79 84
165 0.0799 113 126 130 138 0.1065 68 77 79 84
170 0.0799 115 128 132 140 0.1065 68 77 80 85
176 0.0799 116 129 133 141 0.1065 68 78 80 85
181 0.0799 118 131 135 143 0.1065 69 78 81 86
184 0.0799 118 131 135 144 0.1065 69 78 81 86
15 163 0.0819 115 128 132 140 0.1069 68 78 80 85
165 0.0819 115 128 132 141 0.1069 68 78 80 85
170 0.0819 117 130 134 142 0.1069 69 78 81 86
175 0.0819 118 131 135 144 0.1069 69 79 81 86
180 0.0819 119 133 137 146 0.1069 69 79 82 87
185 0.0819 120 134 138 147 0.1069 70 79 82 87
187 0.0819 121 135 139 148 0.1069 70 80 82 87
16 166 0.0839 117 131 135 144 0.1072 69 79 82 87
169 0.0839 118 132 136 145 0.1072 70 79 82 87
173 0.0839 119 133 137 146 0.1072 70 80 82 87
178 0.0839 120 134 139 148 0.1072 70 80 83 88
182 0.0839 122 136 140 149 0.1072 71 80 83 88
186 0.0839 123 137 142 151 0.1072 71 81 84 89
189 0.0839 124 138 142 152 0.1072 71 81 84 89
17 167 0.0860 119 134 138 147 0.1074 71 80 83 88
170 0.0860 120 135 139 148 0.1074 71 81 83 89
174 0.0860 121 136 141 150 0.1074 71 81 84 89
179 0.0860 123 137 142 151 0.1074 72 81 84 90
183 0.0860 124 139 144 153 0.1074 72 82 85 90
187 0.0860 125 140 145 154 0.1074 72 82 85 90
189 0.0860 126 141 146 155 0.1074 72 82 85 91
Height in centimeters for each age represents the 5th, 10th, 25th, 50th, 75th, 90th, and 95th percentile. The height percentiles are derived from the overall KiGGS population18and are
representative for Germany 2003–2006.
TABLE 3 BP Levels from Nonoverweight Girls According to Age and Height (KiGGS Survey 2003–2006)
Age, y
Height, cm
SBP, mm Hg DBP, mm Hg
S 50th Percentile (Median)
90th Percentile
95th Percentile
99th Percentile
S 50th Percentile (Median)
90th Percentile
95th Percentile
99th Percentile
3 94 0.0763 95 105 108 114 0.1173 58 67 70 74
95 0.0763 96 105 108 114 0.1173 59 67 70 75
97 0.0763 96 106 109 115 0.1173 59 68 70 75
100 0.0763 97 106 109 115 0.1173 59 68 71 75
102 0.0763 97 107 110 116 0.1173 60 69 71 76
105 0.0763 98 108 111 116 0.1173 60 69 71 76
106 0.0763 98 108 111 117 0.1173 60 69 72 77
4 100 0.0763 95 105 108 114 0.1137 59 68 70 75
102 0.0763 96 106 109 114 0.1137 59 68 70 75
104 0.0763 96 106 109 115 0.1137 59 68 71 75
107 0.0763 97 107 110 116 0.1137 60 69 71 76
110 0.0763 98 108 111 117 0.1137 60 69 71 76
113 0.0763 98 108 111 117 0.1137 60 69 72 76
114 0.0763 99 109 112 118 0.1137 61 69 72 77
5 107 0.0763 96 106 109 115 0.1106 60 68 70 75
108 0.0763 96 106 109 115 0.1106 60 68 71 75
111 0.0763 97 107 110 116 0.1106 60 69 71 76
114 0.0763 98 108 111 117 0.1106 60 69 71 76
117 0.0763 99 109 112 118 0.1106 61 69 72 76
120 0.0763 99 109 113 119 0.1106 61 70 72 77
122 0.0763 100 110 113 119 0.1106 61 70 72 77
6 112 0.0763 97 107 110 116 0.1079 60 69 71 75
114 0.0763 97 107 110 116 0.1079 60 69 71 76
117 0.0763 98 108 111 117 0.1079 61 69 71 76
121 0.0763 99 109 112 118 0.1079 61 69 72 76
124 0.0763 100 110 113 119 0.1079 61 70 72 77
127 0.0763 101 111 114 120 0.1079 62 70 73 77
129 0.0763 101 111 114 121 0.1079 62 70 73 77
7 118 0.0763 98 108 111 117 0.1056 61 69 71 76
120 0.0763 98 109 112 118 0.1056 61 69 72 76
123 0.0763 99 109 113 119 0.1056 61 70 72 76
127 0.0763 100 110 114 120 0.1056 62 70 72 77
130 0.0763 101 112 115 121 0.1056 62 70 73 77
133 0.0763 102 112 116 122 0.1056 62 71 73 78
135 0.0763 102 113 116 122 0.1056 63 71 73 78
8 123 0.0763 99 109 113 119 0.1037 62 70 72 76
125 0.0763 100 110 113 119 0.1037 62 70 72 77
128 0.0763 101 111 114 120 0.1037 62 70 73 77
132 0.0763 102 112 115 121 0.1037 62 71 73 77
136 0.0763 103 113 116 123 0.1037 63 71 73 78
140 0.0763 104 114 117 124 0.1037 63 71 74 78
142 0.0763 104 115 118 124 0.1037 63 72 74 79
9 128 0.0763 101 111 114 120 0.1022 62 70 73 77
130 0.0763 101 112 115 121 0.1022 63 71 73 77
134 0.0763 102 113 116 122 0.1022 63 71 73 78
138 0.0763 103 114 117 123 0.1022 63 71 74 78
142 0.0763 104 115 118 125 0.1022 64 72 74 79
146 0.0763 105 116 120 126 0.1022 64 72 75 79
149 0.0763 106 117 120 127 0.1022 64 72 75 79
10 133 0.0763 103 113 116 122 0.1011 63 71 74 78
136 0.0763 103 114 117 123 0.1011 63 72 74 78
140 0.0763 104 115 118 124 0.1011 64 72 74 79
144 0.0763 105 116 119 126 0.1011 64 72 75 79
149 0.0763 106 117 121 127 0.1011 64 73 75 79
153 0.0763 107 118 122 128 0.1011 65 73 75 80
155 0.0763 108 119 123 129 0.1011 65 73 76 80
11 140 0.0763 105 115 119 125 0.1003 64 72 74 79
142 0.0763 105 116 119 126 0.1003 64 72 75 79
146 0.0763 106 117 120 127 0.1003 64 73 75 79
151 0.0763 107 118 122 128 0.1003 65 73 75 80
156 0.0763 109 120 123 130 0.1003 65 73 76 80
160 0.0763 110 121 124 131 0.1003 65 74 76 81
years are higher than Fourth-Report thresholds (eg, for median CDC height 4 mm Hg higher SBP 95th percentile in boys aged 17 years). Of note, some of the KiGGS differences compared with the Fourth-Report findings, in particu-lar the lower Fourth-Report SBP 95th percentile in adolescent boys, may be a statistical effect because of different statistical models. We applied the
Fourth-Report model to KiGGS data and found, for example, for a boy 17.5 years old and 176 cm tall, a SBP 95th percen-tile of 137 mm Hg, whereas the GAMLSS method yielded 141 mm Hg. It has been shown recently that the Fourth-Report model assumptions do not hold true and that methods which do not require normal distribution of BP or constant variance at all ages (eg, the GAMLSS
method we have used) provide a better fit.27,31Thus, Fourth-Report BP
percen-tiles seem less appropriate for
Ger-many, not only because of geographic, ethnic, and time-related differences in the reference populations, but also for statistical reasons.
The old European references7 are
based on heterogeneous pooled data
TABLE 3 Continued
Age, y
Height, cm
SBP, mm Hg DBP, mm Hg
S 50th Percentile (Median)
90th Percentile
95th Percentile
99th Percentile
S 50th Percentile (Median)
90th Percentile
95th Percentile
99th Percentile
12 146 0.0763 107 118 121 128 0.0998 65 73 75 80
149 0.0763 107 118 122 128 0.0998 65 73 76 80
153 0.0763 108 119 123 129 0.0998 65 74 76 80
157 0.0763 109 121 124 131 0.0998 66 74 76 81
162 0.0763 110 122 125 132 0.0998 66 74 77 81
166 0.0763 111 123 126 133 0.0998 66 75 77 82
168 0.0763 112 123 127 134 0.0998 66 75 77 82
13 150 0.0763 108 120 123 130 0.0997 66 74 76 81
153 0.0763 109 120 124 130 0.0997 66 74 77 81
157 0.0763 110 121 125 131 0.0997 66 75 77 82
161 0.0763 111 122 126 132 0.0997 67 75 77 82
166 0.0763 112 123 127 133 0.0997 67 75 78 82
170 0.0763 113 124 128 135 0.0997 67 76 78 83
172 0.0763 113 125 128 135 0.0997 67 76 78 83
14 153 0.0763 110 121 125 131 0.0999 67 75 78 82
156 0.0763 110 122 125 132 0.0999 67 75 78 82
159 0.0763 111 122 126 133 0.0999 67 76 78 83
164 0.0763 112 123 127 134 0.0999 67 76 79 83
168 0.0763 113 124 128 135 0.0999 68 77 79 84
172 0.0763 113 125 129 136 0.0999 68 77 79 84
174 0.0763 114 126 129 136 0.0999 68 77 80 84
15 155 0.0763 111 122 126 133 0.1005 68 76 79 83
157 0.0763 111 123 126 133 0.1005 68 77 79 84
161 0.0763 112 123 127 134 0.1005 68 77 79 84
165 0.0763 113 124 128 135 0.1005 68 77 80 84
169 0.0763 113 125 129 135 0.1005 69 78 80 85
173 0.0763 114 126 129 136 0.1005 69 78 81 85
176 0.0763 114 126 130 137 0.1005 69 78 81 86
16 155 0.0763 112 124 127 134 0.1013 69 78 80 85
157 0.0763 112 124 127 134 0.1013 69 78 80 85
161 0.0763 113 124 128 135 0.1013 69 78 81 85
165 0.0763 113 125 129 135 0.1013 70 79 81 86
170 0.0763 114 126 129 136 0.1013 70 79 81 86
174 0.0763 115 126 130 137 0.1013 70 79 82 87
176 0.0763 115 127 130 137 0.1013 70 79 82 87
17 155 0.0763 113 125 128 135 0.1026 70 79 81 86
157 0.0763 113 125 129 135 0.1026 70 79 82 87
161 0.0763 114 125 129 136 0.1026 70 79 82 87
166 0.0763 114 126 129 136 0.1026 71 80 82 87
170 0.0763 115 126 130 137 0.1026 71 80 83 88
174 0.0763 115 127 130 137 0.1026 71 81 83 88
176 0.0763 115 127 131 138 0.1026 71 81 83 88
Height in centimeters for each age represents the 5th, 10th, 25th, 50th, 75th, 90th, and 95th percentile. The height percentiles are derived from the overall KiGGS population18and are
representative for Germany 2003–2006.
from 1975 to 1984 and are stratified according to age or height alone. How-ever, our data show that at the same height (rounded to 5 cm), boys may dif-fer in age by up to 5 years (5th–95th
percentile of age) and girls by up to 7 years, with resulting SBP 95th percen-tile differences of 12 and 6.5 mm Hg. Conversely, at the same age, height dif-ferences in boys and girls of up to 28
and 23 cm are possible (height 95th– 5th percentile) with maximum SBP 95th percentile differences of 8 and 6 mm Hg. The old European references represented the best data available at the time but have various limitations such as selection bias and heteroge-neous measurement methods. This may explain the rather large differ-ences in systolic BP distribution com-pared with the KiGGS (Fig 2). These dif-ferences are best seen by comparing the older European references with the KiGGS percentiles by age including overweight children: KiGGS SBP 95th percentile by age including overweight children are 6 to 7 mm Hg lower in most age groups in boys and 3 to 7 mm Hg lower in girls compared with the old European references. A secular trend in BP cannot be excluded but should not be affirmed on the basis of a comparison of KiGGS data with old European data, which have too many methodologic caveats.
BP references that include age, gen-der, and height together are scarce. In addition to the Fourth-Report re-search12and the separate analysis of
these data after exclusion of over-weight children,27 Norwegian
oscillo-metric (Criticare 507N [Criticare Sys-tems Inc., Waukesha, Wisconsin, USA]) BP percentiles by age and height have been reported from nonoverweight ad-olescents aged 13 to 18 years.11
How-ever, they are considerably higher not only than the KiGGS percentiles from nonoverweight children but also the British and US references that did not exclude overweight children.10,12
Re-cently, Hong Kong Chinese BP refer-ences by age and height based on the same oscillometric BP-measuring de-vice as used in the KiGGS have been published.32They included overweight
children and are mostly higher than KiGGS references from nonoverweight children but are quite similar to the KiGGS overall sample distribution. FIGURE 1
95th percentile of BP according to age and height percentile among nonoverweight children aged 3 to 17 years. A, Boys; B, girls. Pnindicatesnth percentile.
FIGURE 2
Comparison of KiGGS BP percentiles according to age based on the nonoverweight KiGGS popu-lation, KiGGS BP percentiles according to age based on the overall KiGGS population including overweight children, and old European references according to age. A, Boys; B, girls. Pnindicates
Major strengths of the KiGGS BP refer-ences are the large and nationally repre-sentative sample, coverage of a wide age range, standardized measurements of BP and height, use of a BP device vali-dated in children, averaging of 2 BP mea-surements per participant, and the mod-eling by age and height simultaneously with flexible statistical techniques that do not impose normality or constant variance assumptions on the data.
A possible limitation of the KiGGS is the use of an oscillometric BP-measuring device, whereas current guidelines still recommend the auscultatory method as a first choice.8,12However,
these guidelines acknowledge that some oscillometric devices have been successfully validated using estab-lished protocols and that because of the banning of mercury devices, oscil-lometric reference data will be in-creasingly needed. In addition,
oscillo-metric BP measurements have the advantage of largely eliminating ob-server error. The Datascope Accutorr Plus device has passed the standards of the Association for the Advancement of Medical Instrumentation33and of the
British Hypertension Society34in adults
and has been also validated in children aged 5 to 15 years against mercury sphygmomanometric measurements according to the international protocol of the European Society of Hyperten-sion.35 In the validation study in
children,30 Datascope Accutorr Plus
closely matched sphygmomanometric measurements: the mean (SD) of the differences for SBP readings (oscillo-metric minus auscultatory) was⫺0.9 (4.3) mm Hg and for DBP it was⫺1.2 (6.5) mm Hg. Although this is a closer match than previously reported for other oscillometric BP measurement de-vices, validation protocols often differ.
Another possible limitation of the KiGGS is selection bias. However, the response rate was good (67%), and two-thirds of nonresponders an-swered a short questionnaire includ-ing self-reported height and weight. Self-reported BMI of responders and nonresponders by age and gender was not significantly different,36indicating
that an adverse impact of nonre-sponder bias is unlikely.
CONCLUSIONS
The references presented here are, to our knowledge, the first European BP ref-erences by age and height simultane-ously based on oscillometric measure-ments with a device validated in children. Compared with current US BP references, the proposed KiGGS BP refer-ence values are not influrefer-enced by the prevalence of overweight children in the reference population and take advan-tage of improved statistical methods.
Follow-up BP measurements in KiGGS participants will be forthcoming and will allow an analysis of the predictive value of the presented thresholds for reaching adolescent and early adult hypertension thresholds as well as tracking of specific BP percentiles.
ACKNOWLEDGMENTS
The KiGGS was funded by the German Ministry of Health, the Ministry of Edu-cation and Research, and the Robert Koch Institute.
We thank Professor Wolfgang Ra-scher for valuable advice on BP mea-surement issues, Professor Jo-hannes Peter Haas for discussions on BP plausibility checks, and Dr Karen Atzpodien for advice on exclu-sion criteria.
REFERENCES
1. Daniels SR, Loggie JM, Khoury P, Kimball TR.
Left ventricular geometry and severe left
ventricular hypertrophy in children and ad-olescents with essential hypertension. Cir-culation. 1998;97(19):1907–1911
2. Brady TM, Fivush B, Flynn JT, Parekh R. Ability of blood pressure to predict left ventricular hypertrophy in children with primary hyper-tension.J Pediatr. 2008;152(1):73–78, 78.e71 3. Litwin M, Niemirska A, Sladowska J, et al.
Left ventricular hypertrophy and arterial wall thickening in children with essential hypertension.Pediatr Nephrol. 2006;21(6): 811– 819
4. Reinehr T, Kiess W, de Sousa G,
Stoffel-FIGURE 3
Comparison of KiGGS BP references from nonoverweight children and Fourth-Report BP references12
Wagner B, Wunsch R. Intima media thick-ness in childhood obesity: relations to in-flammatory marker, glucose metabolism, and blood pressure.Metabolism. 2006; 55(1):113–118
5. Páll D, Settakis G, Katona E, et al. Increased common carotid artery intima media thick-ness in adolescent hypertension: results from the Debrecen hypertension study.
Cerebrovasc Dis. 2003;15(3):167–172 6. Chen X, Wang Y. Tracking of blood pressure
from childhood to adulthood: a systematic review and meta-regression analysis. Cir-culation. 2008;117(25):3171–3180 7. de Man SA, André JL, Bachmann H, et al.
Blood pressure in childhood: pooled find-ings of six European studies.J Hypertens. 1991;9(2):109 –114
8. Lurbe E, Cifkova R, Cruickshank JK, et al. Management of high blood pressure in chil-dren and adolescents: recommendations of the European Society of Hypertension.J Hy-pertens. 2009;27(9):1719 –1742
9. Menghetti E, Virdis R, Strambi M, et al. Blood pressure in childhood and adolescence: the Italian normal standards. Study Group on Hypertension of the Italian Society of Pedi-atrics.J Hypertens. 1999;17(10):1363–1372 10. Jackson LV, Thalange NK, Cole TJ. Blood pres-sure centiles for Great Britain [published cor-rection appears inArch Dis Child. 2007;92(6): 563].Arch Dis Child. 2007;92(4):298 –303 11. Munkhaugen J, Lydersen S, Widerøe TE,
Hal-lan S. Blood pressure reference values in adolescents: methodological aspects and suggestions for Northern Europe tables based on the Nord-Trøndelag Health Study II.J Hypertens. 2008;26(10):1912–1918 12. National High Blood Pressure Education
Program Working Group on High Blood Pressure in Children and Adolescents. The fourth report on the diagnosis, evaluation, and treatment of high blood pressure in children and adolescents.Pediatrics. 2004; 114(2 Suppl 4th report):555–576
13. Kurth BM, Kamtsiuris P, Hölling H, et al. The challenge of comprehensively mapping chil-dren’s health in a nation-wide health survey: design of the German KiGGS-Study.
BMC Public Health. 2008;8:196
14. Kahl H, Schaffrath Rosario A, Schlaud M. Sexual maturation of children and adoles-cents in Germany: results of the German Health Interview and Examination Survey
for Children and Adolescents (KiGGS) [in German].Bundesgesundheitsblatt Gesund-heitsforschung Gesundheitsschutz. 2007; 50(5– 6):677– 685
15. Neuhauser H, Thamm M. Blood pressure measurement in the German Health Inter-view and Examination Survey for Children and Adolescents (KiGGS): methodology and initial results [in German]. Bundesgesund-heitsblatt Gesundheitsforschung Gesund-heitsschutz. 2007;50(5– 6):728 –735 16. Kromeyer-Hauschild K, Wabitsch M, Kunze D,
et al. Percentiles of body mass index in chil-dren and adolescents evaluated from dif-ferent regional German studies [in Ger-man].Monatsschrift Kinderheilkunde. 2001; 149(8):807– 818
17. Rosario AS, Kurth BM, Stolzenberg H, Ellert U, Neuhauser H. Body mass index percen-tiles for children and adolescents in Ger-many based on a nationally representative sample (KiGGS 2003–2006).Eur J Clin Nutr. 2010;64(4):341–349
18. Schaffrath Rosario A, Schienkiewitz A, Neu-hauser H. German height references for children aged 0 to under 18 years com-pared to WHO and CDC growth charts.Ann Hum Biol. 2011;38(2):121–130
19. Cole TJ, Green PJ. Smoothing reference cen-tile curves: the LMS method and penalized likelihood.Stat Med. 1992;11(10):1305–1319 20. Rigby RA, Stasinopoulos D. Generalized ad-ditive models for location, scale and shape.
Appl Statist. 2005;53(pt 3):507–554 21. Cole TJ, Stanojevic S, Stocks J, Coates AL,
Hankinson JL, Wade AM. Age- and size-related reference ranges: a case study of spirometry through childhood and adult-hood [pubished correction appears inStat Med. 2009;28(11):1644].Stat Med. 2009; 28(5):880 – 898
22. Stanojevic S, Wade A, Stocks J, et al. Refer-ence ranges for spirometry across all ages: a new approach.Am J Respir Crit Care Med. 2008;177(3):253–260
23. Royston P, Wright EM. Goodness-of-fit statis-tics for age-specific reference intervals.
Stat Med. 2000;19(21):2943–2962 24. Pan H, Cole TJ. A comparison of goodness of
fit tests for age-related reference ranges.
Stat Med. 2004;23(11):1749 –1765 25. van Buuren S, Fredriks M. Worm plot: a simple
diagnostic device for modelling growth refer-ence curves.Stat Med. 2001;20(8):1259 –1277
26. Sorof J, Daniels S. Obesity hypertension in children: a problem of epidemic
propor-tions.Hypertension. 2002;40(4):441– 447 27. Rosner B, Cook N, Portman R, Daniels S,
Falkner B. Determination of blood pressure
percentiles in normal-weight children: some methodological issues.Am J Epide-miol. 2008;167(6):653– 666
28. Rose G, Day S. The population mean predicts
the number of deviant individuals. BMJ. 1990;301(6759):1031–1034
29. Marmot MG, Elliott P. Public health
mea-sures for blood pressure control in the whole community.Clin Exp Hypertens A. 1989;11(5– 6):1171–1186
30. Wong SN, Tz Sung RY, Leung LC. Validation of
three oscillometric blood pressure devices against auscultatory mercury sphygmoma-nometer in children. Blood Press Monit. 2006;11(5):281–291
31. Wei Y, Pere A, Koenker R, He X. Quantile
re-gression methods for reference growth charts.Stat Med. 2006;25(8):1369 –1382 32. Sung RY, Choi KC, So HK, et al.
Oscillometri-cally measured blood pressure in Hong Kong Chinese children and associations
with anthropometric parameters.J Hyper-tens. 2008;26(4):678 – 684
33. Anwar YA, Tendler BE, McCabe EJ, Mansoor GA, White WB. Evaluation of the Datascope
Accutorr Plus according to the recommen-dations of the Association for the Advance-ment of Medical InstruAdvance-mentation.Blood Press Monit. 1997;2(2):105–110
34. White WB, Herbst T, Thavarajah S, Giacco S.
Clinical evaluation of the Trimline blood pressure cuffs with the Accutorr Plus
Mon-itor.Blood Press Monit. 2003;8(3):137–140 35. O’Brien E, Pickering T, Asmar R, et al.
Work-ing Group on Blood Pressure MonitorWork-ing of
the European Society of Hypertension Inter-national Protocol for validation of blood
pressure measuring devices in adults.
Blood Press Monit. 2002;7(1):3–17 36. Kurth BM, Schaffrath Rosario A. The
preva-lence of overweight and obese children and adolescents living in Germany. Results of
the German Health Interview and Examina-tion Survey for Children and Adolescents
DOI: 10.1542/peds.2010-1290 originally published online March 7, 2011;
2011;127;e978
Pediatrics
Angelika Schaffrath Rosario
Hannelore K. Neuhauser, Michael Thamm, Ute Ellert, Hans Werner Hense and
Services
Updated Information &
http://pediatrics.aappublications.org/content/127/4/e978 including high resolution figures, can be found at:
References
http://pediatrics.aappublications.org/content/127/4/e978#BIBL This article cites 36 articles, 5 of which you can access for free at:
Subspecialty Collections
http://www.aappublications.org/cgi/collection/cardiology_sub
Cardiology
following collection(s):
This article, along with others on similar topics, appears in the
Permissions & Licensing
http://www.aappublications.org/site/misc/Permissions.xhtml in its entirety can be found online at:
Information about reproducing this article in parts (figures, tables) or
Reprints
DOI: 10.1542/peds.2010-1290 originally published online March 7, 2011;
2011;127;e978
Pediatrics
Angelika Schaffrath Rosario
Hannelore K. Neuhauser, Michael Thamm, Ute Ellert, Hans Werner Hense and
and Adolescents in Germany
Blood Pressure Percentiles by Age and Height From Nonoverweight Children
http://pediatrics.aappublications.org/content/127/4/e978
located on the World Wide Web at:
The online version of this article, along with updated information and services, is
by the American Academy of Pediatrics. All rights reserved. Print ISSN: 1073-0397.