A Computer Based Method For Determining Defects Of Colour Vision By Measuring Colour Contrast Thresholds In Peripheral Retina: Application To Screening And Management Of Populations At Risk Of Developing Glaucoma
Vincent Tak Cheong Yu Thesis For The Degree Of
Doctor Of Philosophy
Institute Of Ophthalmology
British Postgraduate Medical Federation University Of London
ProQuest Number: 10609165
All rights reserved INFORMATION TO ALL USERS
The qu ality of this repro d u ctio n is d e p e n d e n t upon the q u ality of the copy subm itted. In the unlikely e v e n t that the a u th o r did not send a c o m p le te m anuscript and there are missing pages, these will be note d . Also, if m aterial had to be rem oved,
a n o te will in d ica te the deletion.
uest
ProQuest 10609165
Published by ProQuest LLC(2017). C op yrig ht of the Dissertation is held by the Author.
All rights reserved.
This work is protected against unauthorized copying under Title 17, United States C o d e M icroform Edition © ProQuest LLC.
ProQuest LLC.
789 East Eisenhower Parkway P.O. Box 1346
D edication:
To My Dear Parents
Yu Sai Shu and
Summary:
This thesis describes the details of the research and development of a new computer based technique for deter mining colour vision defects by measuring colour contrast thresholds in the peripheral region of the retina. The study shows that application of this new method to screening and management of populations at risk of d e veloping glaucoma has great potential.
Equiluminance was achieved for each subject by obtaining a luminance match between the red and green guns and blue and green guns of the TV monitor, using heterochro-matic flicker photometry. The annulus subtended 25 d e grees at the eye, and 45 degrees of the annulus was removed randomly in one of the four quadrants. The colour contrast between the annulus and the background could be varied along protan, deuteran or tritan colour confusion lines, and the test consisted of establishing the minimum colour-contrast between annulus and background which allowed patients to identify the position of the gap while regarding a central fixation spot. Thus, the test was a "4-way forced choice" psychophysical method. A modified binary search method was used to ensure that the stimuli converged rapidly toward colour contrast thresh old. Tests were done monocularly. The eye not being tested was occluded.
None of the glaucoma results overlapped those of the controls: all glaucoma thresholds were higher than 3.4 SDs above the normal mean. Over 50 % of the high risk thresholds were higher than 3 SDs above normal mean; some medium risk and a few low risk thresholds had high threshold values as well. The spread of thresholds b e tween normal and glaucomatous patients is considerable, so many intermediate graduations could be recognised. Thus, for screening purposes, criteria can be set such that a desired proportion of each class of patients may be separated from the general population. The high reli ability and sensitivity of discriminating between glauco ma patients and normals suggests that this test can be proved of great value in screening glaucoma and early detection of persons in the population at risk of de veloping glaucoma.
Acknowledgements:
I would like to express my special thanks to Professor Geoffrey Arden, Director of the Electrodiagnostic Depart ment of Moorfields Eye Hospital, and Professor of Neuro physiology and Head of Department of Neurophysiology and Psychophysics of the Institute of Ophthalmology, for his constant advice and encouragement during the work.
I would like to thank Dr. Janet Wolf from the Department of Optometry and Visual Science of the City University who introduced me to Professor Arden that started my study in the field of vision research. I also very appre ciate her kindness of accommodating me in her Visual Perception and Visual Optics Laboratory at the City U n iversity.
reading p a tients’ medical records; Mrs. Shyana Gunewar-dena, Mr. David Perry and Mr. Jim Oluwale, Technicians of the Electrodiagnostic Department, for their kind coopera tion during the course of this study; and Mr. Chris Hogg, Chief Technician of the Electrodiagnostic Department, for other technical help.
I would also like to thank all friends and colleagues who volunteered to act as subjects, and all patients who volunteered to participate in this clinical trial. Their kindness and contribution to this .study are deeply appre
Contents: Page No.
Thesis Title 1
Dedication 2
Summary 3
Acknowledgements 6
Contents 8
The Eye 12
1.0 Introduction 12
1.1 Optical Components of The Eye 1A
1.1.0 Cornea 16
1.1.1 Aqueous Humour 16
1.1.2 Iris 17
1.1.3 Lens 18
1.1.A Vitreous Humour 19
1.2 Absorption Properties of Cornea,
Lens, Vitreous and Macular Pigments 20
1.3 Intraocular Pressure 2 A
1. A Retinal Cells 2 A
1.A.0 Retinal Pigment Epithelium 28
l.A.l Photoreceptors 28
1.A.2 Horizontal Cells A2
1.A.3 Bipolar Cells A3
l.A.A Amacrine Cells A6
1.A.5 Interplexiform Cells A8
1.A.6 Ganglion Cells A8
1.5 Optic Nerves 53
Colour Vision 59
2.0 Introduction 59
2.1 Trichromacy 59
2.2 Colour Opponent Theory 67
2.3 Normal Colour Vision 70
2. A Basic Colorimetric Equations 72 2.5 Colorimetric Transformations 78
2.6 Wright Colorimeter 83
2.7 CIE Colorimetry 8 A
2.8 MacAdam Ellipses 89
2.9 Congenital Colour Vision Deficiencies 91
2.10 Colour Confusion Lines. 93
Detection of Colour Vision Defects 98 2.12.0 Tests Using Coloured Plates 98
2.12.1 Arrangement Tests 100
2.12.2 Colour Matching Tests 105 2.12.3 Heterochromatic Flicker
Photometry 108
2.12.4 Colour Perimetry 109
2.12.5 Computer Based Colour Vision
System 110
Chapter 3: Glaucoma 112
3.0 Introduction to History of Glaucoma 112 3.1 Introduction to Clinical Observations 115 3.2 Pathophysiology and Anatomy of POAG 117 3.3 Natural History of Glaucoma 121 3.A Diagnostic Methods in Glaucoma 127 3.4.0 Testing Visual Field 127
3.4.0.0 Static and Kinetic
Techniques 127
3.4.0.1 Manual Perimeters 129 3.4.0.2 Automated Perimeters 131 3.4.1 Measurement of Intraocular
Pressure 134
3.4.2 Monitoring the Condition of
Optic Nerve Head 13 6
3.5 Clinical Classification of Glaucoma
and Glaucoma Suspects 138
3.5.0 Patients with Glaucoma 138 3.5.1 High Risk Patients 139 3.5.2 Medium Risk Patients 139 3.5.3 Low Risk Patients 139
3.6 Treatment 140
3.7 Early Functional Disturbances 141 3.7.0 Colour Contrast Sensitivity 141 3.7.1 Motion Displacement 142 3.7.2 Peripheral Luminance Contrast
Sensitivity 143
3.7.3 Colour Perimetry 143
3.7.4 Pattern Electroretinogram 144 3.8 Possible Benefits of Early Diagnosis 145
Chapter 4: The New Colour Vision Testing Method 147
4.0 Introduction 147
4.1 Cathode Ray Tube (CRT) Colour Monitor 149 4.2 Radiation Emission From a Multicolour
CRT 165
4.6 Calibrating Equiluminous Colours
For The Observer 174
4.7 The Test Stimuli For Glaucoma 176 4.8 Psychophysical Methods of Threshold
Determination 178
4.9 4-way Forced Choice Technique 184 4.10 Modified Binary Search Technique 185
4. 11 System Calibration 190
4.12 Positioning and Monitoring subjects 191
4.13 Test Sequence 192
Control Experiments 196
5.0 Introduction 196
5.1 Test-Retest Reliability 197
5.2 Variation of ’’R ing” Test Results
With Age 201
5.3 Effect of Refractive Error 207
5.4 Effect of Eccentricity 210
5.5 Effect of Reduced Pupil Size 213 5.6 Effect of Illumination Level 215 5.7 Comparison With Black/White Stimuli 218 5.8 Effect of Disturbance From
Equiluminance 224
5.9 Validation of Methods 229
5.10 Acceptance 230
Chapter 6 Results 231
6.0 Introduction 231
6.1 Recruitment 231
6.1.0 General Considerations 231
6.1.1 Control Group 233
6.1.2 Patients With Glaucoma 234 6.1.3 High Risk Ocular Hypertensives 234 6.1.4 Medium Risk Ocular
Hypertensives 234
6.1.5 Low Risk Ocular Hypertensives 235 6.2 Results and Data Analysis 237
6.2.0 Peripheral Colour Contrast
Thresholds of Normals 237 6.2.1 Peripheral Colour Contrast
Thresholds of Glaucoma 246 6.2.2 Peripheral Colour Contrast
Thresholds of Ocular
Hypertensives 252
6.2.3 Summary of Results 264 6.2.4 Combining Results of All Three
6.2.7 Correlation With the
Pattern ERG (PERG) 277 6.2.8 Correlation With Motion
Detection Test (MDT) 282
Chapter 7: Discussion 285
7.0 Introduction 285
7.1 Practical Aspects of The New Test 285 7.2 Thoretical aspects of The Results 288 7.2.0 Cell Size Selectivity 288 7.2.1 Short Wavelength Cones Might
Use Large Ganglion Cells 290 7.2.2 Relative Sensitivity of Colour
Contrast and Magnocellular
Functions 291
7.2.3 Short Wavelength Cones and Short Wavelength Colour Coded Ganglion Cells Are Relatively
Uncommon 292
7.2.A Shot Wavelength Sensitive Ganglion C e l l s ’ Receptive
Fields Have Little Overlap 293 7.3 Epidemiological Consequences 29A
7.A Conclusion 300
Chapter 8: Further Work 303
References: 305
Appendix A: Calculation for Equiluminant Colours 325
Appendix B: List of Figures 335
Appendix C: List of Tables 337
Chapter 1: The Eye
1.0 Introduction:
The aim of this thesis is to discuss the details of the development of a new computer based method for measuring peripheral colour contrast thresholds; the results of applying this new method to patients with glaucoma or suspected glaucoma; and the implication of the findings for management and screening of the very large number of patients who either suffer from glaucoma or in whom the disease process is beginning. The work done depends upon detailed understanding of concepts underlying visual physiology and anatomy of the eye, and in this section these are reviewed.
pathway. For these reasons, most of the information has come from the studies of lower animals. It has been found that the characteristics of eyes are closely linked with the daily activities and survival techniques of the species, and certain features of the eye are common to all vertebrates. Several primates, notably rhesus monkey, have eye structures virtually identical to man. There fore, we are reasonably certain that findings in animals are also applicable to man.
depends on whether they depolarise or hyperpolarise the membrane potential of the postsynaptic retinal cells. The details of retinal neurotransmission are beyond the scope of this thesis (for details, see Dowling, 1987). Retinal cells process optical information in a parallel fashion. For example, information like form, depth, motion, and colour can be processed simultaneously. Therefore, the visual system is what is known in computing as a parallel p r o c e s s o r .
1.1 Optical Components of The Eye:
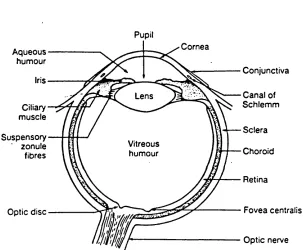
The eye has three anatomical coats: the outer layer which includes the sclera and cornea; the uvea which includes the choroid, ciliary body plus iris; and the neuro epithelial layer which consists of the retina, ciliary epithelium, iris pigment epithelium and retinal pigment epithelium. Inside these three layers there is the aque ous humour, the crystalline lens, and the vitreous h u mour. The optical system basically includes all elements of the eye on the pathway of the light before it reaches the retina, cornea, aqueous humour, iris and pupil, crystalline lens, and vitreous humour (for details, see Walls, 1942). Figure 1.0 shows the schematic diagram of
Pupil
Cornea Aqueous
humour
Conjunctiva Iris
Canal of Schlemm Lens
Ciliary muscle
Sclera Suspensory
' zonule fibres
Vitreous
humour Choroid
Retina
Fovea centralis Optic disc
Optic nerve
1.1.0 Cornea:
The cornea is the transparent window of the outer coat of eyeball. Its refractive index is 1.376. The radius of curvature of the outer surface of human cornea in its central region is about 7.86 mm. The optical power of the front surface of cornea is about +48.83 dioptres and the back surface gives -5.88 dioptres. Thus the approximate total power of the cornea is about +43 dioptres which is about 2/3 of the total power of a .normal eye. It approxi mates to a spherical surface only in the small central region and is flattened towards the corneal margin. The flattened peripheral region has less refractive power which helps to reduce spherical aberration which occurs in simple spherical lenses.
1.1.1 Aqueous H u m o u r :
Complete understanding of the mechanism of secretion has not been achieved so far, but it is clear that the forma tion of an ultrafiltration is not by itself adequate to explain the formation of aqueous humour. It seems to be
+
that Na ions are actively transported by a sodium pump. The chemical energy necessary for this process is usually
+
provided by oxidative metabolism. The transfer of Na leads to the establishment of osmotic gradients that cause flow of water. Other ions and solutes may follow passively with osmotic gradients or they may be actively transported. It is estimated that about 70-80% of the aqueous humour formation is due to active transport (for more details, see Cole, 1984).
The aqueous fills the space between the cornea and the lens. The average depth of this space along the optical axis is 3 mm. Its refractive index is 1.336. It provides a media for the movement of the iris, the biochemical maintenance for this region of the eye and, it also
regulates the intraocular pressure of the eye.
1.1.2 Iris:
involuntary muscles that act together to achieve the control function: the sphincter and the dilator. They control the contraction and dilation of the pupil respec tively. In normal situations, pupil size can vary from 2 mm to 8 mm in diameter which corresponds to a sixteen fold change in pupil area. Psychological and aging fac tors also change the pupil size: mental excitation in creases pupil size and older people usually have rela tively smaller pupil size. Pupil size can also be altered by applying certain autonomic drugs: miotic drugs such as pilocarpine reduce the pupil size by inhibiting the dilator and exciting the sphincter; and drugs such as atropine, cyclopentolate and tropicamide act in just the opposite way, dilating the pupil.
1.1.3 L e n s :
near point for a young person is about 15 cm in front of the cornea. This accommodative power reduces as the person gets older, thus the near point of an older person is much further away from the cornea. The ability of accommodation allows the lens to act as a fine tuning focusing device of the eye.
1.1.4 Vitreous Humour:
The vitreous humour is transparent, and fills the space between the lens and the retina. This vitreous space increases in volume to almost double between birth and adulthood. The average refractive index of vitreous humour is about 1.336. Since its refractive index is higher than that of air, the vitreous humour is part of the refractive power of the optical system. If the axial length of the eye is larger than normal the image will be focused in front of the retina instead of on the retina. This is the principal cause of myopia.
space. This percentage increases to 40% for a 60 year old p e r s o n .
The gel tissues are insoluble in water and they form a totally random network. The size of the network can be easily decreased or increased without changing the total amount of the gel tissues. The flexibility of the gel vitreous in volume creates its viscoelastic properties that form a mechanical buffer from the bordering tissues: it helps to maintain the anatomical integrity of the lens and the retina, and strengthens the eye against any mechanical impact.
1.2 Absorptive Properties of Cornea, Lens, Vitreous and Macular Pigments:
those of the younger persons. The spectral density curves of the human crystalline lens for ages 21 and 63 years are shown in Figure 1.1.
0.5
>s
|
0.3<b ■ O
a 0.2
u
CX
o
500 600 700
X( nm)
Fig. 1.1 The spectral density curves of the human crys talline lens for ages 21 and 63 years. (Adapted from Said and Weale, 1959)
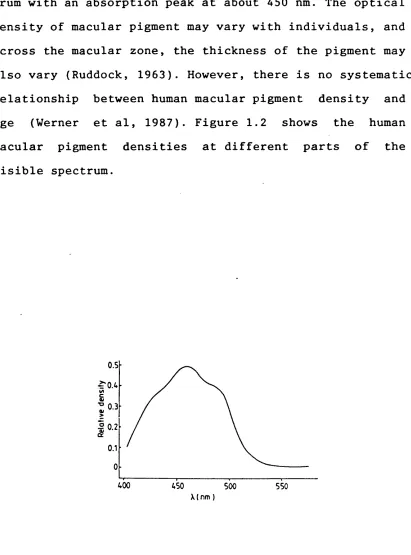
trum with an absorption peak at about 450 nm. The optical density of macular pigment may vary with individuals, and across the macular zone, the thickness of the pigment may also vary (Ruddock, 1963). However, there is no systematic relationship between human macular pigment density and age (Werner et al, 1987). Figure 1.2 shows the human macular pigment densities at different parts of the visible spectrum.
0.5
0.3
-2 0.2
500 550
X(nm )
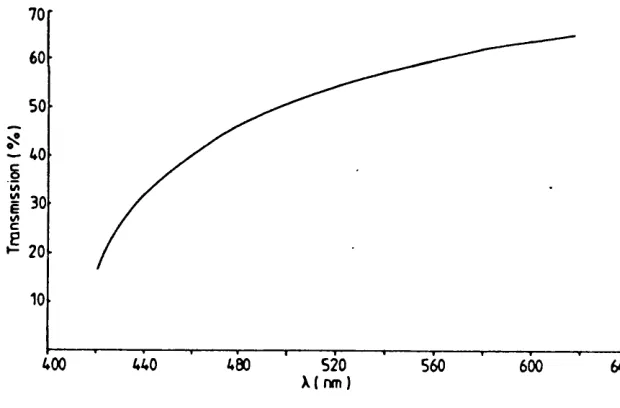
Long wavelength stimuli are absorbed by the water con tents of the ocular media: most of the electromagnetic energy above 1400 nm is absorbed and converted into heat. The total transmission curve of the ocular media is shown in Figure 1.3.
* - 20
400 440 560 600
X( nm)
1.3 Intraocular Pressure:
In healthy eyes, the intraocular pressure (IOP) is in the range 10.5 to 20.5 mmHg. This pressure does not change significantly between the age of 10 to 70 in healthy eyes, and there is little difference between the sexes. Because the eye is a spherical shell with little plastic ity, the pressure within it is related to the difference between the rate of fluid flowing in and the rate of fluid flowing out. Thus the pressure is maintained by an equilibrium between retinal blood circulation, the rates of secretion of the choroid and the ciliary body, and the out-flow rate of the intraocular fluid. Any change in the factors described above will upset such equilibrium and could cause the change of IOP.
1.4 Retinal Cells:
(about 5.8 mm in diameter or 18.5 degrees), and the peripheral retina can be subdivided into near periphery, far periphery and ora serrata (Polyak, 1957; Duke-Elder and Wybar, 1961). The thickness of the human retina varies with eccentricity, being greatest near the optic disc, and gradually thinning towards the periphery (Polyak, 1941; van Buren 1963), with the exception that it is the thinnest at the foveal pit. There is a lower concentration of retinal neurons in the peripheral re gion. Neurons in the periphery have bigger size and they normally possess bigger receptive fields than those neurons nearer to the fovea.
pigment epithelium
-outer segments of rods and cones
inner segments of rods and cones - outer limiting m e m b ra n e
OUTER NUCLEAR LAYER
-rod and cone terminals OUTER PLEXIFORM LAYER
INNER NUCLEAR LAYER
INNER PLEXIFORM LAYER
-GANGLION CELL LAYER
optic nerve fiber layer
inner limiting membrane
m
I
m
£
1.4.0 Retinal Pigment Epithelium:
When light has passed through all retinal neurons and cells, it reaches the retinal pigment epithelium (RPE). This is the innermost layer of the retina. The pigmented cells of the RPE contain nonphotosensitive melanin which absorbs light with wavelengths between 400-800 nm, and reduces reflection and scattering of light inside the eye (for a detailed discussion, see Spalton et al, 1986). The RPE is separated from the choroidal capillaries by a membrane called B r u c h ’s membrane. The choroid is the major source of nutrients for the outer retina. There are numerous basal infoldings of the RPE cells’ plasma m e m branes which facilitate nutrient and waste product e x change (for more details, see Hageman & Johnson, 1991). Thus the main functions of RPE can be regarded as trans portation of metabolites and regeneration of photorecep tor pigments.
1.4.1 Photoreceptors:
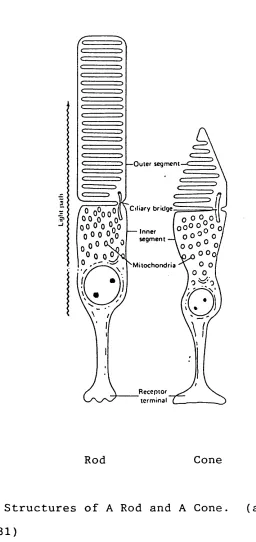
synaptic zone. Figure 1.5 shows the basic structure of a rod and a cone.
/
— Outer segment
Inner segm ent
00
M itochondria
Rod Cone
Light sensitive pigments are located in the outer seg ments of the stacked membraneous discs that interdigitate with the retinal pigment epithelium (for more details, see Attwell, 1986). Because rhodopsin is insoluble, to maximise the absorption it has to be in a folded m e m brane. A quantum passing radially through a photoreceptor outer limb, has very low probability of being absorbed in a single membrane: but the cumulative probability is relatively high, about 30%. The probability is maximised by the elongated structures of rods and cones. The outer segment is connected to the inner segment by a thin cytoplasmic bridge containing a modified cilium (Smelser, 1961). The inner segment consists of the nucleus, numer ous mitochondria and the synaptic terminal (for details,
see Attwell, 1986). There are gap junctions between photoreceptors which mediate electrical coupling between
them (Custer, 1973; Gold & Dowling, 1979).
Wavelength (nm)
*♦00
USQ
500 550 6C0 650CD
c o
J D
O to _o
<
0, 0.
>
a (LI
cr
25,000 22,500 20,000 17,500 15,000
Wavenumber (cm-1)
F i g . 1.6 Absorption Spectra of Human Visual Pigments, (adapted from Mollon, 1982)
The phototransduction events of rods have been observed in single cells, mostly in the large rods of toads and the mechanisms are in general understood. In the dark the
+
membrane of the outer segment is highly permeable to Na
2 +
+
The depolarisation also causes the leakage of K from the inner segment and synaptic ending. The circulation of
+
ions forms the "dark current” . Low internal Na and high
+ + +
internal K concentration is maintained by the Na /K exchange pump, which pumps the ions against their elec trochemical gradients. The opening of ion channels in the dark is maintained directly by an internal messenger, cyclic guanosine monophosphate (cGMP) (Fesenko et al., 1985; Haynes and Yau, 1985). When the concentration of cGMP falls, which happens in the light, the membrane ion
+
channels close. When the ion channels are closed Na and
2 +
Ca ions are stopped from entering the cell. Thus the
+ 2 +
-40
m V
-50
-60
L_
I
1
1
I
1
I
0
200
400
600
msec
Fig.1.7 Voltage Changes in turtle Rod Associated With Brief Flashes of Varying Intensity, (adapted from Falk,
1991) .
dopsin II interacts rapidly with a protein called trans-ducin or G-protein. Transtrans-ducin is a trimer, and when it interacts with the metarhodopsin II, it exchanges a molecule of guanosine diphosphate (GDP) for a molecule of guanosine triphosphate (GTP). About 20,000 transducin molecules sequentially undergo the GTP-GDP exchange. This interaction leads to the release of the gamma portion of the trimer and the transducin becomes a dimer.
The transducin dimer molecule is an enzyme which a cti vates a tetramer called phosphodiesterase (PDE). After activating the PDE, the dimer molecule of the transducin hydrolyses its GTP molecule to GDP. It then recombines its gamma portion back to its original trimer form. Activation of PDE involves splitting of the tetramer. The trimer is an extremely rapidly acting enzyme which splits cGMP into 5 TGMP. One quantum can thus cause the hydroly sis of about 100,000 cGMP molecules. This is the process which reduces the level of the cGMP. Figure 1.8 shows
R
hv
PDE:
T-GDP
FT-T-GDP PDEj-T-GDP
GTP
2 P.
GD P
FT-T-GTP PDE*-T-GTP
T-GTP
PDEj
Fig.1.8 Biochemical Cycle of Phototransduction. (adapted from Falk, 1991).
to reform the visual pigments spontaneously, or it can be reduced to vitamin A and stored in the retinal pigment epithelium until the regeneration process of visual pigments takes place during dark adaptation. This cGMP cascade also operates in cones but kinetically at a higher speed and operates at lower gain than in rods (for more details, see Falk, 1991).
A negative feedback mechanism in both rods and cones
2 +
leads to light adaptation. Thus Ca is an inhibitory regulator of the synthesising enzyme, guanylate cyclase (GC),that catalyses the synthesis of c G M P . In the light,
2 +
the free Ca concentration inside the cell is low as compared with the level in darkness. As a result the GC becomes more active and this increases the synthesis of
2 +
c G M P . The decrease of intracellular Ca ion level also inhibits PDE, hence increasing cGMP level. The increase
2 +
Rods are scotopic sensors which are used at night or in dim light. Electrical responses can be recorded from isolated rods, even when the stimulus is only a single quantum of light. The response of rods reaches saturation very quickly: the response is almost half saturated when each rod has absorbed only about 30 photons. In bright light or natural daylight rods are insensitive to light before the visual pigments of the rods are totally bleached. Cones are photopic sensors which are active in daylight or bright light. The response of cones has a much faster time course and is less sensitive to light than rods. For example (see Fig. 1.9), after a dim flash, primate cone response rises to its peak in about 50 msec, but the primate rod requires about 200 msec to reach its peak; about 30 photoisomerizations give a rod response of half-saturating amplitude, while the corresponding re sponse in a cone requires about 3000 photoisomerizations
Current (pA ) 0
- 1 0
-20
- 3 0
rod
o
r~- 1 0
-20
cone
1 _L JL
0 .2 0 .4
Time (s e c )
RODS £ 120
fc 100
ROOS
CONES CONES
TEMPORAL EXCENTRJQTY (d *g ) NASAL
F ig.1.10 Distribution of Photoreceptors as A Function of Retinal Eccentricity, (adapted from 0>sterberg, 1935).
1.4.2 Horizontal Cells:
Horizontal cells are located at the outer part of the inner nuclear layer with their axons and dendrites lying in the inner part of the outer plexiform layer. In human retina, three types of horizontal cells have been distin guished (Linberg et al., 1987). The first type of h o r i zontal cell (HI) is very similar to the primate horizon tal cell described by Polyak (Polyak, 1941). It is a small field cell: it has 15 jum diameter dendritic tree in the fovea and about 80 to 100 jum in the periphery. The HI cell has thick and straight axons about 1 mm long. The second type of horizontal cell (HII) has a very short and curled axon, about 200 to 400 jum long. The third type (HIII) is very similar to HI but has a much larger d e n dritic field, about two third larger, and more irregular in shape.
In the dark, the release of transmitter by photoreceptors keeps horizontal cells depolarised, partly by opening the
+ +
ion channels permeable to Na and K , and partly by
+
closing K channels (Tachibana, 1985). When the retina is illuminated, the release of the transmitter from the photoreceptors decreases, horizontal cells hyperpolarise which in turn generates sustained graded potentials.
The electrical coupling between adjacent horizontal cells increases their receptive field size (Naka & Rushton, 1966; Lamb, 1976; Lasansky, 1980). There is evidence indicating that retinal horizontal cells serve as a feedback system for the photoreceptors in lower animal (Baylor, Fuortes & O ’Bryan, 1971), such horizontal cell feedback systems have not yet been seen in the human retina.
1.4.3 Bipolar Cells:
The synaptic inputs of bipolar cells come from photorecep tors and horizontal cells. Flat midget bipolar and dif fuse flat bipolar cells have their axons terminals in the inner layer (sublamina a) of the IPL. The bipolar cells of S cones, rods and invaginating midget bipolar cells have their axon terminals in the outer layer (sublamina b) of the IPL. The postsynaptic cells of bipolar cells are the amacrine cells and ganglion cells.
In the human retina, rod bipolar cells do not send their output directly to ganglion cells, instead, they synapse upon various amacrine cells. This allows for both diver gence of the rod signal onto many ganglion cells and convergence of signals from many rod bipolar cells onto single ganglion cell. Some of the cone bipolar cells send axons to sublamina a and others to sublamina b of the IPL. The cone bipolar cells with axons in sublamina a are assumed to connect the OFF-centre ganglion cells and those with axons in sublamina b are assumed to connect the ON-centre ganglion cells. Cone bipolar cells make direct synapses with the ganglion cells, thus intermedi ate amacrine cells are not required. Fewer cones converge onto cone bipolar cells than do rods to rod bipolar cells, consequently, only a relatively small number of cone bipolar cells converge onto their ganglion cells.
terminals have been found to be are very similar to those of midget ganglion cells: they overlap and synapse with no more than one bipolar axon per ganglion cell (Kolb & DeKorver, 1988).
At the fovea, midget bipolar receptive field centres are connected to a single colour cone type, either L cone or M cone. Beyond the fovea, the midget pathway connects with two or three cones, which may be of more than one chromatic type. Unlike the fovea M and L cones, S cones do not use the midget pathway. Instead, a special S cone bipolar cell connects to two or three S cones and carries this information to the sublamina b in the IPL (Mariani, 1984) . The S cone bipolar has an extremely widespread axon terminal that contrasts with the midget bipolars of M and L cones.
1.4.4 Amacrine Cells:
Responses of the fish amacrine cells can be classified into two basic types: transient and sustained (Kaneko, 1971). Transient cells usually give ON and OFF responses to illumination in their receptive fields, with depola rising potentials. Sustained amacrine cell responses can be depolarising as well as hyperpolarising (Hosokawa and Naka, 1985). Sustained amacrine cells may be colour coded (Kaneko, 1971; Toyoda et a l ., 1973), and some cells have centre-surround antagonism (Toyoda et al., 1973).
glion cells. It is very likely that amacrine cells are responsible for feedback mechanisms for bipolar cells
(for more details, see Kolb, 1991).
1.4.5. Interplexiform Cells:
Interplexiform cells are located at the innermost border of the inner nuclear layer, but their processes extend into both inner and outer plexiform layers (for details, see Dowling, 1987). The input to interplexiform cells is exclusively from amacrine cells and the output occurs in both plexiform layers particular in the outer plexiform layer with synapses onto horizontal cells and some bipo lar cell dendrites (Ryan and Hendrickson, 1987). Berson suggested that the interplexiform cells regulate centre-surround antagonism in the outer plexiform layer (Berson, 1987).
1.4.6 Ganglion Cells
Ganglion cells discharge continuously, even in the dark. The firing rate increases in the presence of light. At the ganglion cell axons (also known as optic fibres), information is already frequency modulated for transmis sion. The firing rate is determined not only by the level of illumination, but also by the type of stimuli, chro matic attributes and the centre surround characteristics of the ganglion cells.
Studies in macaque monkey have shown that there are two major types of ganglion cells. They have been called tonic and phasic cells according to their temporal char acteristics (Gouras, 1968), but now they are more widely known as P-cells and M-cells because of their different projections to the parvocellular (P) and magnocellular (M) laminae of the LGN. These two types of ganglion cell have also been found in human retina (Rodieck, Binmoeller & Dineen, 1985 ) .
By assuming triangular lattices, the limits of spatial resolution of P-cells and M-cells have been estimated (Lennie et a l ., 1990): the mosaic of P-cells in the fovea has a spatial resolution limit of 50-60 cycles/degree; and the spatial resolution limit for the M-cells is approximately 20 cycles/degree. Therefore the mosaic of P-cells is assumed to provide a higher spatial visual acuity. The temporal characteristics of P-cells and M-cells have also been studied (Derrington & Lennie, 1984): M-cells respond better than P-cells at higher temporal frequencies, but they have relatively greater loss of responses as temporal frequencies fall below 10 Hz.
M-cells also have centre-surround arrangement of the receptive field. The receptive field of M-cell is 2 to 3 times larger in diameter than that of P-cell and it has much weaker chromatic opponency. Instead of behaving like the Y-cell of cat, as many may expect in term of nonlin earities of spatial summation, M-cell behaves like the X-cells (Derrington & Lennie, 1984), it exhibits linear spatial summation property. M-cell is more sensitive to achromatic contrast, especially at higher temporal fre quencies .
1.5 Optic Nerves:
Axons of all types of ganglion cells form the optic fibres which gather together at the optic nerve head on the retina (Davson, 1980). The optic nerve head consists of over 1.2 million optic nerve fibres grouped into about 1000 optic nerve bundles. Axons near the centre of the optic nerve head are thinner and they are thought to be connected to the central region of the retina. Those bigger optic nerve fibre from the peripheral region of the retina gather around the peripheral part of the optic nerve head.
Most of the retinal nerve fibres extend from the ganglion cells to the optic nerve head by direct routes, except those temporal to the macular which arch above or below the fovea and thereby creating a median raphe (Vrabec, 1966). Axons extending from the optic disc are myelinat ed. Optic nerves with larger diameter, faster transmis sion speed and higher temporal responses are associated with M-cells; optic fibres with smaller diameter, slower transmission speed and lower temporal responses are mainly related to P-cells.
optic radiation optic nerve lateral geniculate
nucleus optic chiasm LEFT
visuai cortex Visual fields
\ RIGHT
Fig. 1.11 Visual Field Mapping, (adapted from Bailey, 1981)
The optic tracts run from the chiasm and terminate at the LGN, which are located in the posterior aspect of the thalamus (for details, see Hubei and Wiesel, 1972). Retinal ganglion cells project onto the nucleus of LGN according to their positions in the retina. A larger proportion of LGN nucleus is used to map the central r e t i n a .
In the LGN, parvocellular and magnocellular pathways start to be segregated physically (for details, see Livingstone & Hubei, 1984, 1987a).
Parvocellular neurons associate with colour. About 80% of parvocellular neurons show colour-opponency: they receive input from a single cone type at the centre and antago nistic input from another type at the surround of their visual field.
Magnocellular neurons are not usually considered to be colour coded (Schiller and Logothetis, 1990). In terms of luminance contrast sensitivity, magnocellular neurons are more sensitive than parvocellular neurons (Kaplan and Shapley, 1986).
In the visual cortex, there are three known pathways: the magno pathway; the parvo-interblob pathway; and the blob path w a y .
direction selectivity (Livingston and Hubei, 1984); stereoscopic selectivity and tuned for binocular dispari ty (Zeki, 1973; Livingston and Hubei, 1987a); and motion detection ability (MT is often described as movement a r e a ).
For the parvo-interblob pathway, cells in the 4Cb layer of visual area 1 receive inputs from the parvocellular cells of the LGN. Signals of the 4Cb layer are passed to the interblobs of layers 2 and 3 of visual area 1. From the interblobs, signals are then passed to the pale stripes of visual area 2. This pathway is tuned for stimulus orientation, moving stimuli and end-stops, but unselective for stimulus colour (Livingstone and Hubei, 1 987a).
Understanding of the blob pathway starts from the blob cells of layers 2 and 3 of visual area 1. Their inputs are uncertain: they may receive inputs from both m a g n o cellular and parvocellular cells of LGN. Signals of the blobs are passed to the thin stripes of visual area 2, from which signals are then passed to the visual area 4
Chapter 2: Colour Vision
2.0 Introduction:
This chapter reviews the characteristics of the visual system which subserve the perception of colour, the development of theories of colour vision, the normal variations of colour vision, congenital and acquired disturbances of colour vision and the methods used to detect colour deficiencies.
2.1 Trichromacy:
Thus any light X, can be matched by a combination of R, G and B:
X = rR + gG + bB
Where r, g, and b are the amounts of R, G, and B required to match X.
Young realised that his findings suggested there were 3 resonators in the eye which responded to light in a selective manner.
Hermann von Helmholtz (1821-1894) later confirmed and extended Y o u n g ’s ideas: there were 3 fundamental colour mechanisms in the eye which had broad and overlapping spectral sensitivities.
Further colour matching experiments successfully estab lished the colour matching functions, i.e. the amount of red, green and blue required to match any given spectral wavelength, using normal observers (Wright, 1928-1929 ; Guild, 1931), and these results were used to define the colour matching functions of the CIE 1931 standard ob server (details of CIE 1931 will be discussed later). Thomson and Wright published the R, G, B curves repre senting the fundamental spectral responses of the three colour mechanisms (Thomson & Wright, 1953).
The ideas and the techniques established in these last experiments enabled the quantitative examination of the 3 colour mechanisms: long wavelength sensitive (L), medium wavelength sensitive (M) and short wavelength sensitive
(S), now known to be formed from the 3 cone systems.
bleached and unbleached cones, and found three types of cones which absorb light in different regions of the spectrum (Marks, Dobelle & MacNicol, 1964; Brown & Wald, 1964). Since then, many techniques have been developed or improved by many groups of scientists to investigate the three types of cone.
The interpretation of the results had become much simpler and more certain after Rushton had proved the loss of a pigment for protanopes and deuteranopes (Rushton, 1964,
1970). Protanopes are people who have total loss of long wavelength sensitivity, and deuteranopes are people who have total loss of medium wavelength sensitivity (the details of colour deficiencies will be discussed later in this chapter).
The method of silent substitution has also been used (Rushton, 1975). This is based on the principle of uni variance of the cones. This principle is a theoretical assumption which states that the electrical polarisation of a cone depends only on the rate of absorption of photons by individual cone, i.e. the cone is colour blind (for more discussions, see Mollon, 1982). Two light sources with different wavelengths were adjusted to give the same rate of quantum catch to one type of cone, the detection of the transition between the two lights was due to the other class of cone. Then the spectral sensi tivities of one type of cone can be measured over a range of wavelengths.
Stiles had also carried out a series of independent researches which characterised colour vision mechanisms, known as i t mechanisms (Stiles, 1949). In his experiments,
a different spectral mechanism began to mediate the threshold. The intensity of the test at this point varied with the wavelength of the background, and from this data Stiles was able to measure the spectral responsiveness of the mechanism (for more details, see Stiles, 1980).
There are five tt spectral mechanisms, all measured in terms of light flux at the cornea. The tt5 mechanism corresponds to the long wavelength cones, it is long wavelength sensitive and has peak sensitivity at 570 nm. The green sensitive mechanism is called tt4, and its
Microspectrophotometry (for review of this technique, see Liebman & Entine, 1964; Liebman, 1972; Knowles & Dart-nall, 1977; Bowmaker, 1984) has been used to determine the absorbance of photopigments of individual photorecep tors. A small beam about 2 p m wide is passed through the outer segment of a cone, and the photon absorption at different wavelengths is then recorded. Measurements on cones of human beings and primates have confirmed that there are three types of cones, with their peak sensitiv ities at 419, 531 and 559 nm wavelengths (Bowmaker & Dartnall, 1980; Bowmaker & Mollon, 1980).
By using techniques of molecular genetics, Nathans and his colleagues have proved that trichromacy is determined in the human genome (Nathans et al, 1986a,b). These results strongly support Young's trichromatic theory.
The wavelengths of peak spectral sensitivity found by psychophysical techniques are slightly different from those obtained from microspectrophotometry. The differ ences can be partly explained if the conditions of m e a s urements are taken into account.
in the anterior part will screen the photopigment in the posterior part (Knowles & Dartnall, 1977).
The spectral sensitivity functions measured by psy c h o physics refer to measurements made at the cornea: retinal
illumination which determines the excitation of recep tors is different, because light passes through the ocular media,and correction must be made for absorptions and reflections, in particular absorption by the macular pigment and the lens pigment of the eye. Individual variations in density and distribution of macular pigment may also contribute to the differences of results o b tained from different techniques.
2.2 Colour Opponent Theory:
The opponent theory of colour vision was first formulated by Ewald Hering (1834 - 1918). It was noticed that the sensation of red was suppressed at the presence of green, and vice versa. This kind of cancellation of sensation was also found for blue and yellow colour pairs. There fore, there is no perception of reddish green, nor bluish yellow. He proposed that red and green, and blue and yellow colours operate in two antagonistic pairs: red-green and blue-yellow. Later on, he added one more antag onistic pair, black-white. He therefore suggested that there were corresponding physiological correlates which mediated these opponent processes. This theory can be generalised in such a way that any colour C we sense is the combinational results, i.e. a function, of the three individual channels:
C = f ((B - Y ) + (R-G) + (BK-W))
As a result, opponent hue cancellation functions of red-green and blue-yellow were obtained which were consistent with the idea of the existence of opponent channels. King-Smith and his colleagues successfully isolated the chromatic opponent channels by using incremental targets of low spatial and temporal frequency image on an achro matic adapting field (King-Smith & Carden, 1976; King-Smith & Kranda, 1981).
A linear model was proposed, which suggested that oppo nent channels receive inputs combined linearly from the combination of the three types of cones (Jameson & Hur-vich, 1968). This model was tested by different groups of researchers. They confirmed that the red-green opponent process did obey the assumption of linearity with respect to their cone inputs, but the blue-yellow opponent p roc ess appeared to receive nonlinear inputs (Larimer et a l ., 1975; Werner & Wooten, 1979; Elzinga & de Weert, 1984; Ejima & Takahashi, 1985; Ayama & Ikeda, 1986; Akita et al.,1987). The nonlinear property of the blue-yellow mechanism on hue cancellation had been explained in such a way that the S cones receives sensitizing signals from the L cones but desensitizing signals from the M cones
(Ejima & Takahashi, 1985).
2.3 Normal Colour Vision:
As described above, persons with normal colour vision have two types of photoreceptors: rods and cones. The visible spectrum lies between 380 to 780 nm. The absorp tion peak of the rod pigments is about 496 nm, and for the L, M, S cone pigments the absorption spectrum peak at 559, 531 and 419 nm respectively (Bowmaker & Dartnall, 1980). In the normal person, these 3 pigments are provide the physical basis for three independent primaries (the image on the retina must be larger than the central fovea where blue cones are absent).
The colour vision performance of normal subjects is very stable. However, degradation of colour performance has been found in old subjects (Lakowski, 1958, 1962; Verri-est et al, 1962; VerriVerri-est 1963; Ohta & Kato, 1976). The reason for such degradation of colour vision performance with age is due to the progressive yellowing of the nucleus of the crystalline lens and the decrease of the transmittance of the lens (Said and Weale, 1959; Wright, 1946; Lakowski, 1962; Ruddock, 1965a, 1965b; Verriest & Uvijls, 1977).
2.4 Basic Colorimetric Equations:
There is always a need for colour measurement. The principle of all colour measurement is based on the trichromatic theory of normal colour vision, since if three suitable primaries are defined, most colours can be matched by the addition the primaries (but see below). If the quantity of each primary colour used to produce the match is measured, these values can then be used to
represent a measure of this particular colour stimulus.
The fundamental law of colour matching is the trichro matic generalization, which states that over a wide range
of conditions of observation, most colours can be matched by addition of three fixed primaries. In a bipartite field, with one side containing an unknown X, and the other a mixture of the 3 primaries, R, G, B, the match is always of the following form:
X = rR + gG + bB
negative value. The colour match can be expressed in the following form, if r is negative:
X + rR = gG + bB
Equations such as those above are commonly used by colour theorists. Within quite wide limits, these equations are found to have good predictive power. The main limitations are that the stimulus must not change rapidly with time, and be of a fixed size so inhomogeneities in the retina do not affect the matches. The use of such simple equa tions implies Grassmans laws of colour matching, which are: symmetry, transitivity, proportionality and addi tivity .
The equation for a colour match of monochromatic light E at a spectral frequency using R, G, B lights can be expressed similarly as follows:
E = rR + gG + bB
0.4
r ( X )
J 0.2
h-0.0
400 500 f 600 700
t Wavelength (X ), n m r ( X )
oo
F i g . 2.0 Typical Spectral Tristimulus Values (adapted from Wyszecki & Stiles, 1982).
The colour matching equations can be simplified when a two dimensional representation in normalised Cartesian coordinates is used, so that:
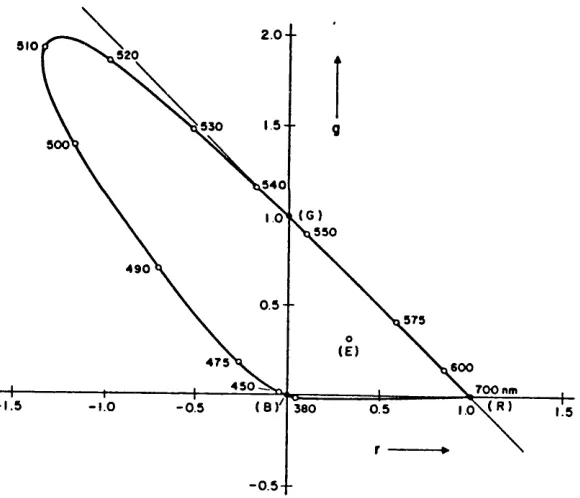
It is therefore possible to express all colour matching information on the (r,g)-chromaticity diagram. The locus of chromaticity points on the (r,g)-chromaticity diagram for colour matching of spectral monochromatic lights is called the spectral locus. Figure 2.1 shows the example of a typical (r ,g)-chromaticity diagram with spectral locus of colour matching of monochromatic stimuli of wavelength from 380 to 700 nm, and the equal energy point
(E) is at the point where r = g = 0.333.
2.0
-910
920
15-930 9 00 '
>940
990
4 9 0
0 . 5
-979
4 79 600
7 00 nm
-1.0 - 0 .5 380 0 .5
0 5
For a complex colour stimulus, Q, the colour is defined by its absolute spectral radiant power distribution over the range of the visible spectrum which is not restricted to narrow bands of wavelengths. The corresponding tristi mulus values r,g,b of the colour Q are also defined as
the integration of the radiant power distribution over the same range of the spectrum. Thus for a colour match of two coloursCQ and Q ), the integrations of spectral
1 2
radiant power distribution of r ,g ,b must equal to 1 1 1
those of r ,g ,b , but at a particular spectral frequen-2 2 2
cy, the spectral radiant power distribution of r ,g ,b 1 1 1 can be different from that of r ,g ,b . Such colours Q
2 2 2 1