www.atmos-meas-tech.net/7/4445/2014/ doi:10.5194/amt-7-4445-2014
© Author(s) 2014. CC Attribution 3.0 License.
Development and field testing of a rapid and ultra-stable
atmospheric carbon dioxide spectrometer
B. Xiang1, D. D. Nelson2, J. B. McManus2, M. S. Zahniser2, R. A. Wehr3, and S. C. Wofsy1
1School of Engineering and Applied Sciences and Department of Earth and Planetary Sciences, Harvard University,
Cambridge, MA 02138, USA
2Aerodyne Research, Inc., 45 Manning Road, Billerica, MA 01821-3976, USA
3Department of Ecology and Evolutionary Biology, University of Arizona, Tucson, AZ 85721, USA
Correspondence to: B. Xiang ([email protected])
Received: 10 July 2014 – Published in Atmos. Meas. Tech. Discuss.: 5 August 2014
Revised: 14 November 2014 – Accepted: 20 November 2014 – Published: 15 December 2014
Abstract. We present field test results for a new spectro-scopic instrument to measure atmospheric carbon dioxide (CO2)with high precision (0.02 µmol mol−1, or ppm at 1 Hz)
and demonstrate high stability (within 0.1 ppm over more than 8 months), without the need for hourly, daily, or even monthly calibration against high-pressure gas cylinders. The technical novelty of this instrument (ABsolute Carbon diox-ide, ABC) is the spectral null method using an internal quartz reference cell with known CO2column density. Compared
to a previously described prototype, the field instrument has better stability and benefits from more precise thermal control of the optics and more accurate pressure measure-ments in the sample cell (at the mTorr level). The instru-ment has been deployed at a long-term ecological research site (the Harvard Forest, USA), where it has measured for 8 months without on-site calibration and with minimal main-tenance, showing drift bounds of less than 0.1 ppm. Field measurements agree well with those of a commercially avail-able cavity ring-down CO2instrument (Picarro G2301) run
with a standard calibration protocol. This field test demon-strates that ABC is capable of performing high-accuracy, unattended, continuous field measurements with minimal use of reference gas cylinders.
1 Introduction
Accurate and precise measurement of atmospheric carbon dioxide (CO2)is key to monitoring and understanding
an-thropogenic impacts on atmospheric radiative forcing and
climate. To that end, various CO2instruments have been
de-veloped, using techniques such as tunable infrared laser di-rect absorption spectroscopy (TILDAS), non-dispersive in-frared absorption (NDIR) spectroscopy, integrated cavity output spectroscopy (ICOS), cavity ring-down spectroscopy (CRDS), Fourier transform infrared spectroscopy (FTIR), and photoacoustic detection (Andersen et al., 2010; Baer et al., 2002; Engeln et al., 1998; Esler et al., 2000). Particu-lar designs have targeted specific deployment purposes, such as long-term monitoring at remote sites, fast response eddy covariance measurement, mobile platform (i.e., car, ship, bal-loon, aircraft) in situ sampling, and atmospheric column con-centration measurements. One limitation common to all the CO2 instruments (and other stable gas instruments as well)
is instrument response drift at various timescales (e.g., hours to days) and the associated need for use of calibration gases to maintain traceability to world standards. The logistics of tank operations – including filling, shipping, housing, pres-sure regulating, sampling, calibrating, and inter-comparing – are cost- and labor-intensive, especially so for instruments deployed in situ, and variations in the composition of gas delivered to the sensors may limit the accuracy of the mea-surement.
To address the problems presented by the need for peri-odic calibrations with gas standards, we developed an in-strument called ABsolute Carbon dioxide, or ABC (Xiang et al., 2013). ABC relies on what we call the spectral null method, whereby the sample gas spectrum is divided by the spectrum in an internal, sealed quartz cell with a known CO2
improves measurement precision and accuracy by reducing the influence of spectral variations associated with laser op-erating parameters (e.g., tuning rate, laser line width varia-tion and mode purity), absorpvaria-tion line strength changes (e.g., with temperature), optics temperature variations, and spectral fitting. Previous tests showed the prototype instrument had a 1-second precision of 0.02 µmol mol−1(ppm) and was sta-ble to within 0.1 ppm over a month of unattended operation without calibration (Xiang et al., 2013).
Here we describe the field tests of a next-generation ABC instrument with improved performance demonstrated over many months of operation. The new instrument uses a dif-ferent instrument platform equipped with better thermal and vibration control and integrated electronics. The instrument has been deployed to a research forest site to measure above-canopy CO2 mixing ratios continuously for 8 months.
Re-sults from periodic surveillance tank measurements and from ambient sampling comparisons to a calibrated CO2
instru-ment using CRDS (Picarro G2301) show stability within 0.1 ppm for the entire period. This performance puts the ABC instrument among the best CO2instruments currently
avail-able. It has great potential to be applied to long-term, re-mote monitoring networks for continuous unattended mea-surements, with a much simpler quality assurance process. The quartz reference cells could be calibrated at a central lab and delivered to remote sites to ensure consistent measure-ment standards. The new platform also has the potential to be adopted for other stable gas measurements and eddy co-variance flux sampling.
2 Experimental details
We employ a variant of Tunable Infrared Laser Direct Ab-sorption Spectroscopy (TILDAS) that incorporates a spectral null technique, comparing the sample spectra to spectra ob-tained from a permanently sealed quartz reference cell with known CO2column density. This facilitates high-accuracy,
low-drift measurements of ambient CO2mixing ratios. Basic
details of the instrument design, null method, sealed quartz reference cells, data acquisition, and spectral analysis are de-scribed by Xiang et al. (2013). Here we discuss in detail the major improvements of the next-generation ABC instru-ment, including a new instrument platform with improved thermal control, accurate sample cell pressure measurement, and better-integrated electronics.
2.1 Optics platform
ABC now uses an instrument platform originally developed for simultaneous detection of multiple species using dual lasers (McManus et al., 2010, 2011; Tuzson et al., 2013). A typical Aerodyne Dual (laser) system has dimensions of 53 cm×66 cm×71 cm (W×D×H), weight of 72 kg, and draws electrical power of 500 W, 120/240 V, and 50/60 Hz.
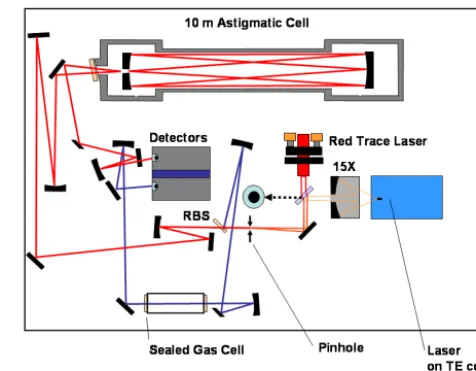
Figure 1. Diagram of the optical module for the ABC platform.
Figure 1 shows the optical module of the current ABC plat-form. The design is based on a 43 cm×64 cm breadboard.
Here we discuss in detail the special optical features of the current ABC instrument and contrast them with those of the prior ABC prototype. We used the same 2.7 µm dis-tributed feedback (DFB) diode laser (Nanoplus, Germany), one quartz reference cell, and the AMAC-36 sample cell as in the first prototype instrument and installed two new 5-micron HgCdTe detectors. We selected a different12C16O2
absorption line (3733.4684 cm−1)than the one used in the first prototype (3735.8480 cm−1). The new line is near
an-other, weaker CO2absorption line that facilitates laser
tun-ing rate characterization. The diode laser is positioned in a customized thermoelectric cooling (TEC) laser housing (blue in Fig. 1). Its output first gets collected and re-focused by a 15×reflecting objective mounted on a three-axis translation stage allowing for fine focus adjustments. A pinhole between the first reflecting mirror (black) and the wedged beam split-ter (RBS, yellow) serves as a reference point for alignment, with the help from a visible trace laser. The main beam is separated by the RBS into two parts: the transmitted beam (red) goes into the sample multi-pass cell and gets detected by a 5-micron HgCdTe detector (Teledyne Judson Technolo-gies, USA; J19TE4:5-3CN-R01M); the front reflected beam (blue) is directed into the quartz reference cell and collected by another detector of the same type as used in the sam-ple beam. We adjusted the samsam-ple multi-pass cell absorp-tion path length to 10.20±0.01 m (19.4 cm mirror separa-tion, 52 passes; McManus et al., 2011) to nearly match the column absorptions in the sample and the reference cells.
The traceable accuracy and the long-term measurement stability performance of ABC are assured by the permanently sealed quartz reference cell containing known column den-sity of CO2in dry air. Column density is the product of the
cell (10 cm). Detailed quartz cell descriptions can be found in Xiang et al. (2013). We fill the quartz cell with 4 % CO2
(in volume, from a pure CO2tank source) in a total of 5 Torr
(0.7 kPa) dry, CO2-free air, in order to obtain the equivalent
CO2mixing ratio in the quartz cell close to the ambient level
(the ABC sample cell has an optical path length about 100 times that of the quartz cell). The cell has been pumped be-fore the filling to avoid internal water desorption and sealed by a glass-blower after the filling. The equivalent CO2
mix-ing ratio in the sealed quartz cell (or the “null point”), at the fixed position inside the current ABC platform, has been cali-brated to be 385.20±0.02 ppm using reference gas cylinders traceable to the WMO standards (Tans et al., 2009) in the laboratory. Repeated quartz cell reposition tests under labo-ratory and field transport conditions were performed, and no CO2measurement shift outside 0.1 ppm range was observed.
2.2 Pressure measurement
For ABC to obtain 0.1 ppm long-term measurement stability, the pressure sensor measurement must be stable to within 1 part in 4000 (0.25 ‰), which is about 1 mTorr (∼0.1 Pa) at the sample cell pressure of about 5 Torr (∼660 Pa). We tested the long-term zero- and span- drift of three commercial sen-sors: MKS 626B, MKS 627D and MKS 722A (MKS Instru-ments Inc., USA). These sensors all operate up to 10 Torr with similar specified accuracies (0.15, 0.12, and 0.5 % of the reading, respectively), but they differ in size, settings, and price. During the test, all three sensors were connected to the ABC sample cell with switch valve controls. The MKS 627D is temperature self-controlled (the temperature depen-dence of its zero reading after control is 20 ppm full span (F.S.) K−1according to the specification) and was therefore
placed outside the temperature-controlled ABC optics box. The other two sensors have greater zero-reading tempera-ture dependencies (50 ppm F.S. K−1for the 626B and 80 ppm F.S. K−1for the 722A according to the specification) and so were placed inside the optics box. The ABC sample cell was also connected to a HOVAC DRI-2 pump system with valve control to serve as the “true” zero pressure. This system com-bined a molecular drag pump and a diaphragm pump and was capable of pumping the system down to 10−5Torr (10−3Pa), which is 2 orders of magnitude smaller than our pressure ac-curacy requirement. The sample cell was switched to HO-VAC pumping periodically for the pressure sensor zero test.
We examined the pressure sensor zero drift periodically over 3 months (Fig. 2). Intensive zero pressure measurements (hourly) were made in the beginning, and the frequency was gradually reduced (from every 3 h to twice every day) to-wards the end of the test period. Data gaps in Fig. 2 are due to other ABC stability tests, but the vacuum system setup was not changed during those periods. Results show that the MKS 626B had the least zero-reading drift, less than 1 mTorr over the 3-month period (excluding the initial sensor stabiliz-ing and vacuum system out-gassstabiliz-ing period). The MKS 722A
Figure 2. Measurements of the zero drift for three commercial pres-sure sensors over 3 months. Meapres-surement frequency changes from hourly in the beginning to 3 hourly and twice daily at later times. Data gaps are due to other stability tests and the vacuum connection remains the same throughout this period.
had the worst performance, with drifts and sporadic changes up to 10 mTorr. These big changes did not appear in the mea-surements of the other two sensors and were likely associated with the turning on of the 722A sensor. This test was repeated on the MKS 626B later for an even longer time (6 months) and again its zero-drift was no more than 1 mTorr.
In addition to zero drift, we examined the span drift of all three commercial pressure sensors around the working pres-sure of the sample cell. The cell prespres-sure was controlled by a flow controller (500 sccm range, MKS 0248A-00500SV) and varied within 0.1 Torr around 5 Torr during normal op-eration. Due to the lack of absolute pressure references in this range, we chose to check for span drift by comparing these three MKS sensors in pairs. Over a 1-month test period (15 February–17 March 2013), the most stable pressure read-ing comparison was between the MKS 627D and the MKS 626B. The ratio of their pressure readings (P627D/P626B,
zero-drift corrected) was 1.0023±0.0001 (1 standard devia-tion), suggesting very small span drift (0.01 percent) between the two sensors around the cell pressure. Based on these zero-and span-drift tests, we choose to install the MKS 626B in the ABC system, to measure the sample cell pressure with mTorr (0.25 ‰) accuracy.
2.3 Temperature control
Temperature influences the instrument’s stability through a variety of mechanisms including the phase motion of opti-cal fringes, changes in laser tuning, and temperature depen-dence of the CO2 absorption line strength combined with
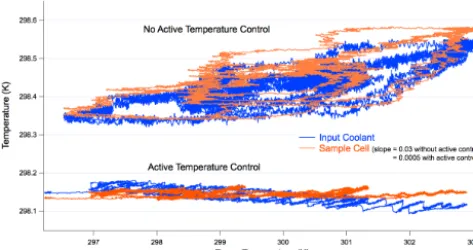
Figure 3. Temperature control effects on the ABC optics with and without a newly developed active control loop.
(Oasis 3, Solid State Cooling Inc, USA). We have been able to couple ABC and the Oasis 3 to realize active temperature control of a selected point in the optics enclosure, further im-proving instrument stability.
Usually, re-circulating chillers regulate temperature by at-tempting to maintain the fluid in the chiller at a fixed, manu-ally selected set point. There are two problems with this ap-proach: (1) some thermal loss/gain from/to the fluid en route to/from ABC is inevitable, so that if the fluid temperature in the chiller is stable, then the fluid temperature inside ABC will vary with the room temperature, and (2) the temperature of the fluid output by the chiller is potentially dependent on the room temperature as well. To help relieve these problems, we built a temperature control feedback loop between ABC and the Oasis 3 whereby the Oasis 3 set point is adjusted (via USB with 1 mK resolution) in order to maintain a stable temperature at a fixed location inside the optics box.
The benefit of the water temperature feedback control loop is illustrated in Fig. 3. Without the active control loop (top panel), the measured temperatures of the sample cell inside the optics box (orange) and of the coolant input to the op-tics box (blue) have a 1-part-in-30 dependence on the am-bient temperature variation. With the active control loop us-ing the sample cell as the sensus-ing point (bottom panel), the coolant temperature is continuously adjusted by TDLWin-tel (the ABC control software), via the Oasis 3, such that the sample cell temperature stayed constant to within about 30 mK around 298.15 over 7 K changes in the ambient tem-perature (i.e., temtem-perature of the control point varies by less than 1 part in 200 of the ambient temperature changes). We also improved the thermal stability of the separate electron-ics box through insulation and closed-loop ventilation with a heat exchanger and a separate chiller.
3 Instrument field performance 3.1 Harvard Forest deployment
We field-tested the ABC instrument at the Harvard Forest En-vironmental Measurements Site (HF-EMS) from June 2013 until February 2014 – a test period of 8 months. HF-EMS is a long-term ecological research site located in Petersham, Massachusetts, USA. The site is heavily forested, dominated by red oak and red maple. It has been described in detail else-where (Wofsy et al., 1993; Goulden et al., 1996; Urbanski et al., 2007). ABC measures from the eddy flux tower (30 m tall), along with two other CO2 instruments: an Aerodyne
CO2-isotope spectrometer (Wehr et al., 2013) and a Picarro
G2301 (Picarro Inc., USA).
ABC was plumbed in parallel with the Aerodyne CO2
iso-tope spectrometer. Both instruments received gas from the same valve manifold, with ABC taking about 400 sccm of the total 3500 sccm flow via a tee inserted immediately be-fore the isotopic spectrometer. The manifold sampled the air at the top of the canopy for most of the time, with intermittent sampling of vertical canopy profiles and of the secondary ref-erence gas cylinders for the CO2-isotope spectrometer (also
called the working tank pairs: low span between 350 and 360 ppm and high span between 450 and 455 ppm). We stress that these working tanks were never used to calibrate ABC; indeed, ABC has not been calibrated once since its move-ment to the Harvard Forest in June 2013. It has been mea-suring continuously at 1 Hz without any maintenance, except for occasional site power, purge gas (i.e., CO2- and H2O-free
gas), and pump failures. The restored performance of ABC was not affected by power or pump failure. The instrument automatically restarts itself and continues requiring data after power failures. After a pump replacement, the sample flow rate should be checked and maintained the same as before to ensure measurement stability. All of the ABC CO2values
reported here, including the working tank gas values, come directly from the instrument’s real-time measurements.
3.2 Field performance – stability
Table 1. Surveillance tank CO2information and repeated ABC measurements at Harvard Forest in between June 2013 and February 2014.
Errors are 1 standard deviation from repeated measurements.
Licor COa2 δ13Cb δ18Ob Corrected CO2 ABC CO2
(ppm) (‰) (‰) (ppm)c (ppm) Measurement date
Aluminum gas cylinders
#1 346.728±0.011 −48.94±0.26 +35.57±0.23 346.6306 346.18±0.03 9 Sep 2013 346.33±0.01 30 Jan 2014 346.38±0.01 20 Feb 2014
#2 377.651±0.016 −37.12±0.19 +6.27±0.13 377.5929 377.54±0.03 9 Sep 2013 377.55±0.01 30 Jan 2014 377.56±0.02 20 Feb 2014
#3 402.937±0.006 −37.38±0.15 +6.10±0.09 402.8743 402.82±0.03 9 Sep 2013 402.79±0.02 30 Jan 2014 402.78±0.02 20 Feb 2014
#4 422.128±0.027 −37.52±0.17 +5.52±0.12 422.0622 422.01±0.03 9 Sep 2013 421.69±0.02 30 Jan 2014 421.66±0.01 20 Feb 2014
#5 457.196±0.004 −38.04±0.20 +4.97±0.13 457.1233 456.66±0.03 9 Sep 2013 456.45±0.04 30 Jan 2014 456.41±0.02 20 Feb 2014
Steel gas cylindersd
#1 332.693±0.016 −10.34 +34.31 332.6947 332.91±0.04 19 Jun 2013 332.91±0.04 11 Sep 2013 332.89±0.03 22 Oct 2013 332.87±0.05 20 Dec 2013 332.78±0.09 30 Jan 2014 332.91±0.02 20 Feb 2014
#2 431.150±0.051 −15.10 +30.80 431.1392 430.65±0.03 19 Jun 2013 430.55±0.03 11 Sept 2013 430.51±0.03 22 Oct 2013 430.29±0.04 20 Dec 2013 430.21±0.04 30 Jan 2014 430.35±0.02 20 Feb 2014
#3 496.444±0.060 −15.13 +30.93 496.4314 495.06±0.04 19 Jun 2013 495.07±0.07 11 Sep 2013 494.70±0.05 22 Oct 2013 494.17±0.07 20 Dec 2013 493.97±0.02 30 Jan 2014 494.10±0.04 20 Feb 2014
aThe raw values of CO
2mole fractions in tanks were measured by a modified Licor 6251 (Daube et al., 2002) and calibrated against tanks (filled with
natural air) traceable to the WMO total CO2standards. Measurements were repeated twice for each tank on two different days.
bIsotopic compositions of CO
2in the aluminum surveillance tanks were calibrated by the Aerodyne QCLS_CO2isotope instrument, referencing to a
standard tank characterized by IRMS at the Stable Isotope Ratio Facility for Environmental Research (SIRFER) at the University of Utah.δ13C values are on the VPDB scale (R13_VPDB=0.0111797);δ18O values are on the VSMOW scale (R18_VSMOW=0.0020052). Isotopic compositions of CO2
in the steel surveillance tanks were measured directly by IRMS at SIRFER, University of Utah.
cThe corrected CO
2values were calculated by correcting the tank CO2isotopic compositions for those in natural air (−10 ‰ forδ13C and 40 ‰ for δ18O), and by correcting the Licor responses using mean RMR values (1.00565, 0.33 and 1.345 for 626, 636 and 628) from the two Li-6252 instruments studied in Tohjima et al. (2009).
dRepeated ABC measurements of steel surveillance tanks show large variations associated with environment temperature. See discussion in Sect. 3.4 for
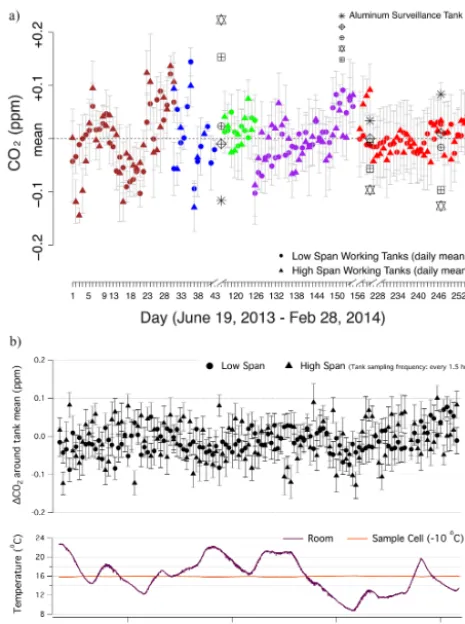
Figure 4. (a) Daily average of working tank pairs and individual surveillance tanks measured by ABC at Harvard Forest between 19 June 2013 and 14 February 2014. Working tank pair (low span in square, and high span in triangle) was measured twice every 3 h for 2 min each. Each pair (in different colors) lasts for about 1 month. Data are plotted around the mean of all measurements for each tank. Error bars show the 1 standard deviation of all working tank mea-surements on each day. Data gaps are due to power, purge gas or pump failure. (b) Week-long ABC working tank measurements at Harvard Forest, during which the room temperature varied 14 K. Each symbol represents one-time tank measurement (not the daily average as shown in a). Data points and error bars show the mean and the standard deviation in the last 30 s of each 2 min measure-ment period (sampling rate at 1 Hz). Concurrent temperature pro-files of the instrument room and the sample cell are also shown for reference (lower panel).
time coverage from the same individual tank. In general, ABC showed no systematic drifts and the day-to-day CO2
variation was below about±0.1 ppm, which meets the World Meteorological Organization Data Quality Objectives for the Northern Hemisphere (WMO, 1993).
Figure 4b shows ABC’s working tank measurements over a 1-week period which was chosen because the room tem-perature varied by 14 K. Despite this very large tempera-ture swing, all individual tank measurements (not merely the daily average) were stable within±0.1 ppm CO2, showing
no measurable temperature dependency even at this very high level of measurement precision.
These results demonstrate that ABC is capable of mea-suring at remote sites for almost a year (and probably longer) without maintenance or calibration. Its stability of <0.3 ppm peak to peak over 8 months surpasses or competes with that of any major brand CO2
spectrom-eter (Andrews et al., 2014; Richardson et al., 2012; Pi-carro G2301 Analyzer Data Sheet, http://www.piPi-carro.com/ products_solutions/trace_gas_analyzers/co_co2_ch4_h2o).
3.3 Field performance – ambient sampling
We compared ABC’s ambient air measurements to those of a Cavity Ring-Down Spectrometer (Picarro G2301) sampling at the same height through a different inlet on the same flux tower, and the results show relatively good agreement be-tween the two.
The Picarro instrument has been measuring at the HF-EMS since the summer of 2012. It was set up to measure CO2, CH4, and H2O at eight heights on the tower (0.3, 0.8,
4.5, 7.5, 12.7, 18.3, 24.1 and 29.0 m). The reported CO2from
the Picarro G2301 has been corrected for water interference (lab characterization following Rella et al., 2013, and Chen et al., 2010) and for the CO2response curve (on-site
calibra-tion). One reference tank is measured by Picarro every 6 h to monitor instrument drift. Both the Picarro calibration tanks and the ABC reference tanks were calibrated against WMO standards at Harvard University, but using different instru-ments (Picarro and Licor, respectively).
Figure 5 compares CO2 time series from ABC and the
Picarro G2301, for the same height on the tower (29.0 m, through different inlets) during a week in between 2 and 8 January 2014. The two instruments tracked each other very well. The signals display relatively small daily CO2
varia-tions above the canopy due to low biological activity in win-ter. The Picarro G2301 measurements have a∼3 s output in-terval while ABC measures at 1 Hz and can be set even faster (10 Hz with 0.09 ppm precision, compared to 0.15 ppm pre-cision at every 5 s for Picarro G2301). The mean CO2
dif-ference of the two measurements (ABC – Picarro G2301) is −0.04±0.22 ppm during this 1-week period. ABC currently measures Nafion (Perma Pure PD-200T-48) dried air sam-ples but does have the potential for water measurement and correction. Spectral regions with co-existing CO2and water
absorption lines with appropriate line separations and line strengths are available (Xiang, 2013).
3.4 Field performance – accuracy
We used two sets of surveillance gas cylinders to test the ac-curacy of ABC and characterize its response to the CO2
Figure 5. Ambient air measurements from ABC and Picarro above the canopy in Harvard Forest between 2 and 8 January 2014.
(Airgas Inc., USA) primarily serving as the reference gas cylinders for the CO2-isotope spectrometer. All surveillance
tanks were calibrated by a NDIR analyzer (a modified Licor 6251) at Harvard University and were traceable to the WMO Central Calibration Lab (CCL) CO2standards. We corrected
the Licor measured CO2values for all cylinders according to
their isotopic compositions and the Licor relative molar re-sponse (Tohjima et al., 2009; Xiang et al., 2013). The mixing ratio and isotopic composition of CO2 in each cylinder are
summarized in Table 1.
ABC responds very linearly to CO2 between 330 and
500 ppm, though there is detectible nonlinearity less than 0.2 ppm. Figure 6 shows the repeated ABC measurements of all surveillance tanks between June 2013 and February 2014 without any calibration or correction applied. Linear regres-sion of all aluminum tank measurements (340–460 ppm) has a slope of 0.997, 3 ‰ different from unity. The average fit residual for each tank is less than 0.2 ppm different from Licor calibrated values. At this 0.2 ppm CO2level, it is
diffi-cult to accurately attribute the bias sources to instrument un-certainties of ABC or Licor (e.g., instability, linear response, isotope effects, interferences) and tank drifts (e.g., due to fill gas sources, impurities, usage, leakage, position, tank mate-rial, regulator characteristics, ambient temperature, humidity, pressure, and personal operation; Keeling et al., 2007). How-ever, we do observe nonlinearity based on the fit residuals for aluminum tank measurements. According to the null spectral scheme, ABC’s accuracy and the stability both deteriorate as the sample CO2 value deviates away from its null point
(i.e., the effective CO2mixing ratio of ABC’s quartz
refer-ence cell) of 385.20±0.02 ppm. This can partly explain the observed nonlinearity.
We did not include steel surveillance tanks in the above discussion because of their observed instabilities with ambi-ent temperature. In a short-term temperature test, clear con-trast was observed as we alternately measured a steel (Airgas Inc., USA) and an aluminum CO2 tank (Scott-Marrin Inc.,
USA). Both experienced a rapid temperature increase from about 4◦C to room temperature in an hour. During this hour,
Figure 6. Repeated surveillance tank measurements at Harvard For-est field site between June 2013 and February 2014, showing the general linear response of ABC to CO2mixing ratios between 330
and 500 ppm. No calibration was performed during this 8-month period.
ABC measurements from the steel tank went up by 0.7 ppm; meanwhile those for the aluminum tank stayed constant. Over the 8-month field test, repeated ABC measurements of steel tanks (housed without temperature conditioning) also show tight and positive correlations with ambient tempera-ture: up to 0.13 ppm CO2variation (delta) and the
temper-ature correlation coefficient (R) is 0.73 for the 332.7 ppm tank; delta=0.44 ppm, R=0.91 for the 431.2 ppm tank; and delta=1.10 ppm,R=0.96 for the 496.4 ppm tank. On the other hand, we did not observe this temperature corre-lation for the aluminum surveillance tanks (housed in the same room with steel tanks). Surface reactions and gas im-purities are likely the causes for this temperature effect on steel tanks. Our results reinforce the recommendation from NOAA ESRL/CCGG (US National Oceanic and At-mospheric Administration Earth System Research Labora-tory/Carbon Cycle Greenhouse Gases Group) for the use of aluminum rather than steel gas cylinders as references for high-precision CO2measurements (Kitzis, 2009).
4 Summary
We have developed a spectrometer for measuring absolute CO2mixing ratios in ambient air and demonstrated its
long-term field deployment in this study. The major improve-ments compared to the lab-based prototype are improved temperature stabilization, and mTorr-level sample cell pres-sure meapres-surement accuracy. Field meapres-surements showed ex-ceptional instrument stability and accuracy: repeatability to within 0.1 ppm over 8 months without any on-site calibra-tion, and accuracy to within 0.2 ppm compared to Licor cali-brated values traceable to the WMO standards. Field compar-ison with a Picarro CO2instrument showed good agreement.
and accuracy without calibration gas consumption allow for simpler and less expensive operation without loss of reli-ability. The ABC instrument could also facilitate a global monitoring network with a central calibration lab for char-acterizing the quartz reference cells, which could be easily shipped to sites for inter-comparison or to serve as long-term stable references. This development work has moreover con-firmed the potential of spectroscopic measurements for ac-curate, long-term, remote monitoring of other stable atmo-spheric species (and their isotopologues) with minimal refer-ence gas consumption.
Acknowledgements. B. Xiang thanks Elaine Gottlieb and Jasna Vellovic Pittman from Harvard University for calibrating the CO2calibration tanks used in this study. B. Xiang also thanks
Steve Huchro and Lloyd Wright from Solid State Cooling for developing and updating their chiller products. We acknowledge the help from the technical staff at Aerodyne Research Inc. and the Harvard Forest field staff. This work is funded by the DOE SBIR program under grant number DE-5C0000905.
Edited by: F. Stroh
References
Andersen, P. C., Williford, C. J., David, D. E., and Birks, J. W.: Ultrasonic detector for high precision measurements of carbon dioxide, Anal. Chem., 82, 7929–7934, 2010.
Andrews, A. E., Kofler, J. D., Trudeau, M. E., Williams, J. C., Neff, D. H., Masarie, K. A., Chao, D. Y., Kitzis, D. R., Novelli, P. C., Zhao, C. L., Dlugokencky, E. J., Lang, P. M., Crotwell, M. J., Fischer, M. L., Parker, M. J., Lee, J. T., Baumann, D. D., Desai, A. R., Stanier, C. O., De Wekker, S. F. J., Wolfe, D. E., Munger, J. W., and Tans, P. P.: CO2, CO, and CH4
measure-ments from tall towers in the NOAA Earth System Research Laboratory’s Global Greenhouse Gas Reference Network: instru-mentation, uncertainty analysis, and recommendations for future high-accuracy greenhouse gas monitoring efforts, Atmos. Meas. Tech., 7, 647–687, doi:10.5194/amt-7-647-2014, 2014. Baer, D. S., Paul, J. B., Gupta, M., and O’Keefe, A.: Sensitive
ab-sorption measurements in the near-infrared region using off-axis integrated-cavity-output spectroscopy, Appl. Phys. B, 75, 261– 265, 2002.
Chen, H., Winderlich, J., Gerbig, C., Hoefer, A., Rella, C. W., Crosson, E. R., Van Pelt, A. D., Steinbach, J., Kolle, O., Beck, V., Daube, B. C., Gottlieb, E. W., Chow, V. Y., and Santoni, G. W.: High-accuracy continuous airborne measurements of greenhouse gases (CO2and CH4) using the cavity ring-down spectroscopy
(CRDS) technique, Atmos. Meas. Tech., 3, 375–386, 2010, http://www.atmos-meas-tech.net/3/375/2010/.
Daube, B. C., Boering, K. A., Andrews, A. E., and Wofsy, S. C.: A high-precision fast-response airborne CO2analyzer for in situ
sampling from the surface to the middle stratosphere, J. Atmos. Ocean. Tech., 19, 1532–1543, 2002.
Engeln, R., Berden, G., Peeters, R., and Meijer, G.: Cavity enhanced absorption and cavity enhanced magnetic rotation spectroscopy, Rev. Sci. Instrum., 69, 3763–3769, 1998.
Esler, M. B., Griffith, D. W. T., Wilson, S. R., and Steele, L. P.: Precision trace gas analysis by FT-IR spectroscopy. 1. Simulaa-neous analysis of CO2, CH4, N2O, and CO in air, Anal. Chem., 72, 206–215, 2000.
Goulden, M. L., Munger, J. W., Fan, S. M., Daube, B. C., and Wofsy, S. C.: Measurements of carbon sequestration by long-term eddy covariance: Methods and a critical evaluation of accuracy, Glob. Change Biol., 2, 169–182, 1996.
Keeling, R. F., Manning, A. C., Paplawsky, W. J., and Cox, A. C.: On the long-term stability of reference gases for atmospheric O2/N2and CO2measurements, Tellus B, 59, 3–14, 2007.
Kitzis, D.: Preparation and stability of standard reference air mix-tures, NOAA Earth System Research Laboratory Carbon Cycle Greenhouse Gases group and Cooperative Institute for Research in Environmental Sciences, University of Colorado at Boulder, available at: http://www.esrl.noaa.gov/gmd/ccl/airstandard.html (last access: 12 December 2014), 2009.
McManus, J. B., Zahniser, M. S., Nelson, D. D., Shorter, J. H., Herndon, S., Wood, E., and Wehr, R.: Application of quantum cascade lasers to high-precision atmospheric trace gas measure-ments, Opt. Eng., 49, 111–124, 2010.
McManus, J. B., Zahniser, M. S., and Nelson, D. D.: Dual quantum cascade laser trace gas instrument with astigmatic Herriott cell at high pass number, Appl. Optics, 50, 74–85, 2011.
Rella, C. W., Chen, H., Andrews, A. E., Filges, A., Gerbig, C., Hatakka, J., Karion, A., Miles, N. L., Richardson, S. J., Stein-bacher, M., Sweeney, C., Wastine, B., and Zellweger, C.: High accuracy measurements of dry mole fractions of carbon diox-ide and methane in humid air, Atmos. Meas. Tech., 6, 837–860, doi:10.5194/amt-6-837-2013, 2013.
Richardson, S. J., Miles, N. L., Davis, K. J., Crosson, E. R., Rella, C. W., and Andrews, A. E.: Field Testing of Cavity Ring-Down Spectroscopy Analyzers Measuring Carbon Diox-ide and Water Vapor, J. Atmos. Ocean. Tech., 29, 397–406, doi:10.1175/JTECH-D-11-00063.1, 2012.
Tans, P., Zhao, C., and Kitzis, D.: The WMO mole fraction scales for CO2and other greenhouse gases, and uncertainty of
the atmospheric measurements, a report prepared for the 15th WMO/IAEA Meeting of Experts on Carbon Dioxide, Other Greenhouse Gases, and Related Tracer Measurement Tech-niques, Jena, Germany, available at: http://www.esrl.noaa.gov/ gmd/ccl/co2report.html (last access: 12 December 2014), 2009. Tohjima, Y., Katsumata, K., Morino, I., Mukai, H., Machida, T.,
Akama, I., Amari, T., and Tsunogai, U.: Theoretical and experi-mental evaluation of the isotope effect of NDIR analyzer on at-mospheric CO2measurement, J. Geophys. Res., 114, D13302,
doi:10.1029/2009JD011734, 2009.
Tuzson, B., Zeyer, K., Steinbacher, M., McManus, J. B., Nelson, D. D., Zahniser, M. S., and Emmenegger, L.: Selective measure-ments of NO, NO2and NOyin the free troposphere using
quan-tum cascade laser spectroscopy, Atmos. Meas. Tech., 6, 927–936, doi:10.5194/amt-6-927-2013, 2013.
Urbanski, S., Barford, C., Wofsy, S., Kucharik, C., Pyle, E., Bud-ney, J., McKain, K., Fitzjarrald, D., Czikowsky, M., and Munger, J. W.: Factors controlling CO2 exchange on timescales from
hourly to decadal at Harvard Forest, J. Geophys. Res.-Biogeo., 112, G02020, doi:10.1029/2006JG000293, 2007.
covariance measurements of the isotopic composition of the ecosystem-atmosphere exchange of CO2in a temperate forest,
Agr. Forest Meteorol., 181, 69–84, 2013.
Wofsy, S. C., Goulden, M. L., Munger, J. W., Fan, S. M., Bakwin, P. S., Daube, B. C., Bassow, S. L., and Bazzaz, F. A.: Net exchange of CO2in a midlatitude forest, Science, 260, 1314–1317, 1993.
World Meteorological Organization (WMO): Global Atmosphere Watch, report of the Seventh WMO Meeting of Experts on Car-bon Dioxide Concentration and Isotopic Measurement Tech-niques, WMO/TD-No. 669, No. 88 Rome, Italy, 1993.