www.atmos-meas-tech.net/10/1299/2017/ doi:10.5194/amt-10-1299-2017
© Author(s) 2017. CC Attribution 3.0 License.
A European-wide
222
radon and
222
radon progeny comparison study
Dominik Schmithüsen1, Scott Chambers2, Bernd Fischer3, Stefan Gilge4, Juha Hatakka5, Victor Kazan6, Rolf Neubert7, Jussi Paatero5, Michel Ramonet6, Clemens Schlosser8, Sabine Schmid8, Alex Vermeulen9,a, and Ingeborg Levin1
1Institut für Umweltphysik (IUP), Heidelberg University, Heidelberg, Germany 2Institute for Environmental Research (ANSTO), Lucas Heights, Australia 3Umweltbundesamt (UBA), Meßstelle Schauinsland, Oberried, Germany 4Deutscher Wetterdienst, Hohenpeißenberg (HPB), Hohenpeißenberg Germany 5Finnish Meteorological Institution (FMI), Helsinki, Finland
6Laboratoire des Sciences du Climat et de l’Environnement, LSCE/IPSL, CEA-CNRS-UVSQ, Université Paris-Saclay, Gif-sur-Yvette, France
7Centrum voor IsotopenOnderzoek (CIO), ESRIG, University of Groningen, Groningen, the Netherlands 8Bundesamt für Strahlenschutz (BfS), Freiburg, Germany
9Energy research Centre of the Netherlands (ECN), Petten, the Netherlands anow at: ICOS ERIC – Carbon Portal, Lund, Sweden
Correspondence to:Ingeborg Levin (ingeborg.levin@iup.uni-heidelberg.de) Received: 1 April 2016 – Discussion started: 24 August 2016
Revised: 28 February 2017 – Accepted: 12 March 2017 – Published: 3 April 2017
Abstract. Although atmospheric 222radon (222Rn) activity concentration measurements are currently performed world-wide, they are being made by many different laborato-ries and with fundamentally different measurement prin-ciples, so compatibility issues can limit their utility for regional-to-global applications. Consequently, we conducted a European-wide 222Rn/222Rn progeny comparison study in order to evaluate the different measurement systems in use, determine potential systematic biases between them, and estimate correction factors that could be applied to har-monize data for their use as a tracer in atmospheric appli-cations. Two compact portable Heidelberg radon monitors (HRM) were moved around to run for at least 1 month at each of the nine European measurement stations included in this comparison. Linear regressions between parallel data sets were calculated, yielding correction factors relative to the HRM ranging from 0.68 to 1.45. A calibration bias be-tween ANSTO (Australian Nuclear Science and Technol-ogy Organisation) two-filter radon monitors and the HRM of ANSTO/HRM=1.11±0.05 was found. Moreover, for the continental stations using one-filter systems that de-rive atmospheric 222Rn activity concentrations from mea-sured atmospheric progeny activity concentrations,
prelim-inary 214Po/222Rn disequilibrium values were also esti-mated. Mean station-specific disequilibrium values between 0.8 at mountain sites (e.g. Schauinsland) and 0.9 at non-mountain sites for sampling heights around 20 to 30 m above ground level were determined. The respective corrections for calibration biases and disequilibrium derived in this study need to be applied to obtain a compatible European atmo-spheric 222Rn data set for use in quantitative applications, such as regional model intercomparison and validation or trace gas flux estimates with the radon tracer method.
1 Introduction
(e.g. Nazaroff, 1992; Karstens et al., 2015). The 222Rn flux from (ocean) water surfaces is negligible (Schery and Huang, 2004) compared to that from continental soils; therefore, the atmospheric222Rn activity concentration can serve as a (qualitative) tracer to distinguish continental from marine air masses (e.g. Dörr et al., 1983; Polian et al., 1996). If the con-tinental 222Rn exhalation rate and its spatial and temporal distribution are known,222Rn can also serve as a quantitative tracer for atmospheric boundary layer mixing and transport model validation (e.g. Jacob and Prather, 1990; Jacob et al., 1997; Taguchi et al., 2011; Williams et al., 2011).
Due to its increasing use as a quantitative tracer in atmo-spheric modelling or to estimate greenhouse gas fluxes with the radon tracer method (e.g. Levin et al., 1999), the number of atmospheric 222Rn measurements has greatly increased worldwide. Two fundamentally different analysis systems have been in operation across the European radon monitor-ing network in the last decade: (i) dual-flow-loop two-filter monitors (Whittlestone and Zahorowski, 1998; Chambers et al., 2011), which sample and measure radon directly, and (ii) one-filter monitors (e.g. Stockburger and Sittkus, 1966; Paatero et al., 1998; Levin et al., 2002), which sample and measure radon progeny. Of the one-filter monitors, there are different designs, which target α or β activity, with static, alternating, or moving filters. A third method for direct at-mospheric222Rn monitoring more recently applied at several sites in Spain (Grossi et al., 2012) as well as in the German Alps at Schneefernerhaus (Frank et al., 2016) monitors the activity of the radon progeny 218Po that is produced in situ by 222Rn decay in a detector chamber permanently flushed with sample air. In this chamber the positively charged218Po atoms are accelerated in a high-voltage (e.g. 30 kV) field that is maintained between the chamber surface and a surface barrier detector for α detection. As for the dual-flow-loop two-filter monitors, the sensitivity of this instrument type de-pends on the detector volume. If properly calibrated, moni-tors that sample222Rn directly are principally more accurate than those which sample aerosol-bound222Rn progeny, be-cause no correction for disequilibrium is needed to estimate atmospheric222Rn activity concentration.
Here we report on a recent extensive radon com-parison project, conducted mainly in the framework of the European Infrastructure Project InGOS (http://www. ingos-infrastructure.eu/), across nine European measurement sites (Pallas and Helsinki, FI; Mace Head, IR; Lutjewad and Cabauw, NL; Gif-sur-Yvette, F; and Schauinsland, Hohen-peißenberg (HPB), and Heidelberg, DE). At all sites, the rou-tine local 222Rn activity concentration measurements were compared to observations performed with the original (Levin et al., 2002) or a recently modernized (Rosenfeld, 2010) Heidelberg radon monitor (HRM). At stations where the two-filter technique is employed, i.e. Lutjewad (60 m a.g.l.), Cabauw (20 and 200 m a.g.l.), and Heidelberg (30 m a.g.l.), preliminary information about the mean height-dependent disequilibrium between222Rn and its progeny can also be
ob-tained from the comparisons. Disequilibrium between222Rn and its progeny in the atmosphere is generally largest close to the ground where soil-borne222Rn gas exhales into the atmosphere but the short-lived progeny have not yet had suf-ficient time to reach radioactive equilibrium with222Rn. The disequilibrium profile depends on the turbulent mixing con-ditions, particularly below 5–10 m a.g.l. (Jacobi and André, 1963). It may also occur through wet and dry deposition of the aerosol-bound progeny (Porstendörfer, 1994).222Rn progeny loss may also occur when air is sampled through long tubing. This effect on measurements with the HRM is quantitatively investigated in the accompanying paper by Levin et al. (2017).
2 Methods
2.1 Australian Nuclear Science and Technology Organisation (ANSTO) two-filter monitors
are large (3 m) and have a slow (45 min) response time, which prevents them from being multiplexed on tall towers. In rou-tine operation these monitors are calibrated monthly (which can be corrected for in post-processing; Griffiths et al., 2016) by injecting radon from a well-characterized (to ca. ±4 %) Pylon226Ra source at a flow rate of ca. 80 cc min−1. Instru-mental background (zero count) checks are performed quar-terly, from which a linear model of210Pb (T1/2=22.3 years) accumulation on the detector’s second filter is derived and removed from the raw counts. Net counts are subsequently calibrated to atmospheric radon activity concentration.
2.2 One-filterα- orβ-activity monitors
One-filter detectors measure the decay rates of aerosol-bound 222Rn progeny directly accumulated by air filtration. Their
α and/orβ activity is then measured in situ with dedicated detector systems. Since they normally consist of only a fil-ter head, counting electronics, and a pumping device, they are much more compact than two-filter radon monitors. A disadvantage of the one-filter method, however, is that atmo-spheric222Rn activity concentrations can only be determined by making assumptions about the radioactive disequilibrium between222Rn and its measured progeny in the atmosphere. This disequilibrium changes with height above ground and the atmospheric mixing state (Jacobi and André, 1963). Fur-thermore, aerosol removal processes, such as dry or wet de-position, may bias the measurement. Depending on the loca-tion of the staloca-tion and the meteorological condiloca-tions (atmo-spheric humidity and precipitation events), these latter effects may be as large as 30 % (e.g. Xia et al., 2010).
Also, one-filter detectors sample not only222Rn progeny but also the aerosol-bound decay products of 220Rn. Al-though the activity concentrations of220Rn itself are 1 to 2 orders of magnitude smaller than those of222Rn in the conti-nental atmosphere (Jacobi and André, 1963; Volpp, 1984), its long-lived progeny212Pb (T1/2=10.6 h) may accumulate on static filters. Theαactivity of its progeny212Po thus needs to be carefully separated, e.g. by spectroscopy, in such systems (see e.g. Levin et al., 2002, and Sect. 2.2.1.).
2.2.1 Heidelberg one-filterαmonitor (HRM)
The original HRM was designed in the 1990s and is de-scribed in detail by Levin et al. (2002). Briefly, the system consists of a homemade filter holder carrying a Whatman quartz filter (QMA Ø 47 mm), which continuously collects all aerosols from an ambient airflow of ca. 1 m3h−1, moni-tored with a mass flow meter (Bronkhorst, model F-112AC-AAD-22-V). The face velocity is approximately 0.15 m s−1 and the pressure drop over the filter about 5 kPa. Except for situations of very high ambient aerosol concentration, which could then block the filter, the filter is changed once per month. A surface barrier detector (Canberra CAM 900 mm2 active surface) with pre-amplifier is mounted in the filter
holder about 5 mm from the loaded filter’s surface to mea-sure the α particles from the decaying 222Rn and 220Rn progeny. Half-hourly integratedα-spectra are stored and al-low separation of the 222Rn-derived 214polonium (214Po) from the high energy 220Rn-derived 212polonium (212Po) counts. The methodology of separating218Po and212bismuth (212Bi) counts from the spectra, and calculating theα activ-ity of214Po on the filter, is explained in detail by Levin et al. (2002). From the flow rate through the filter the atmo-spheric214Po activity concentration can be calculated, tak-ing into account the filter efficiency and the solid angle of the detector (which depends on the distance of the detector from the filter).
In 2010 the original HRM design was modernized by im-plementing state-of-the-art electronics, data acquisition, and evaluation hardware and software (Rosenfeld, 2010). The fil-ter holder was also slightly modified to allow more direct air flow from the intake onto the filter (avoiding potential loss of aerosols at the surfaces of the filter holder). Other aspects, however, including the solid angle of the detector and all other parameters, were kept the same. Long-term compar-isons between a modernized HRM and our reference mon-itor that has been running at Heidelberg station since 1999 with regular checks of its measurement efficiency using a 241americium (241Am) α source showed no significant dif-ference between the first- and the second-generation moni-tors (see also Sect. 2.3).
The HRM is not calibrated as such. Except for a calcula-tion of the solid angle of the detector (solid angle=0.265; Cuntz, 1997), we assume that the detector efficiency forα
particles is 100 %. The filter efficiency has been determined to be 100 %, except for the first few hours after filter change, when the aerosol loading is still very low. The mass flow me-ter has been calibrated by the company to within±2 %. At-mospheric222Rn activity concentrations can then be derived from atmospheric214Po activity concentration, if the disequi-librium between222Rn and its progeny at the measurement site is known (see below).
2.2.2 Finnish Meteorological Institute (FMI) one-filter β-activity monitors
back-ground count rate.222Rn activity concentration is calculated assuming (i) equilibrium between222Rn and its short-lived progeny nuclides and (ii) there is no significant amount of long-lived beta activity (artificial or from 212Pb from the 220Rn series) present. Theβ-counting efficiencies are taken to be 0.96 % for214Pb and 4.3 % for214Bi, determined with an analyser utilizing an alpha–beta pseudo-coincidence tech-nique (Mattsson et al., 1996). These counting efficiencies are used for both FMI systems at Pallas (FMI-1) and in Helsinki (FMI-2), as the counting geometries and GM-tube models are identical. This type of monitor was originally designed and employed in the early 1960s for radiation monitoring purposes; it was not specifically designed for222Rn measure-ments.
2.2.3 LSCE active deposit moving filter progeny monitor
The LSCE monitor (Polian, 1986; Biraud, 2000) deter-mines 222Rn activity from measurements of its short-lived progeny 218Po and214Po and uses the so-called active de-posit method with a moving filter tape. The measurement is a two-stage process with a sampling period, where attached radon progeny are collected on the cellulose filter (Pöllman– Schneider), followed by a counting period, which begins af-ter the exposed portion of filaf-ter tape (13.8 cm2)has been ad-vanced under the detector. Ambient air is pumped through the filter (deposition velocity ca. 1 m s−1)for 2 h at a flow rate of about 12–14 m3h−1. Following this sampling period the filter tape advances under an α spectrometer (scintilla-tor from Harshaw Company and photomultiplier from EMI, Electronics Ltd) to measure the radioactive decay for 2 h. During this counting period, the radioactive decay of218Po, 214Po and212Po (to determine the220Rn activity) on the fil-ter is logged every 10 min. Knowing the temporal evolution of theαdecays on the filter during the 2 h counting, atmo-spheric222Rn (resp.222Rn progeny) activity when the sam-ple was being collected can be calculated (Biraud, 2000).
2.2.4 Bundesamt für Strahlenschutzα/βmonitor (P3)
The Federal Office for Radiation Protection (BfS) developed the α/β monitor (so-called P3) in the late 1950s to contin-uously monitor the natural (220Rn/212Po and 222Rn) and artificialβ-activity concentrations in ambient air. The tech-nique applied is based on a static one-filter detection system (see Stockburger, 1960, and Stockburger and Sittkus, 1966, for details). The electronics for counting and data record-ing as well as the pumprecord-ing system was modernized sev-eral times since 1966, but the detector system is still un-changed. Ambient air is drawn continuously with an airflow of ca. 50 m3h−1 through a cellulose nitrate membrane ter (pore size 1.2 µm, Sartorius Stedim Biotech). On this fil-ter, aerosols, including the progeny of222Rn and220Rn, are quantitatively collected and the activities are measured with
a (custom-made) sandwich counter, consisting of three inde-pendent proportional gas flow counters (counting gas: 100 % methane 2.5). The exposed effective filter size is 300 cm2 (0.23×0.13 m2), the face velocity 0.46 m s−1, and the pres-sure drop ca. 22 kPa. The high voltages of the counters as well as the thickness of the foils between them are adjusted in such a way that the lower energyαparticles are measured by the first counter above the filter, the high-energyα parti-cles by the middle counter, and only theβparticles are mea-sured by the third counter. Theαactivity of the short-lived 222Rn progeny 218Po (α
E=6.0 MeV, T1/2=3.05 min) and 214Po (α
E=7.69 MeV,T1/2=164 µs) collected on the filter is measured in situ, mainly by the counter positioned directly above the filter. Only the high-energyαparticles (8.78 MeV) from the decay of212Po from the220Rn decay chain could be measured in the middle proportional counters. Based on this count rate, corrections are made for activity contributions coming from the progeny of220Rn to the ones of222Rn mea-sured by the lower counter. From this corrected count rate, the atmospheric222Rn activity concentration is derived, as-suming an equilibrium of222Rn with the measured progeny. Finally, the artificialβactivity is calculated.
2.2.5 Tracerlab Working Level Monitor (WLM) one-filter system
The Tracerlab WLM is a one-filter instrument (using a quan-titatively collecting cellulose nitrate membrane filter, pore size 0.8 µm, effective diameter 25 mm) that measures the potential α-energy concentration (typically given in units of J m−3, however, here as “radon equivalent” in Bq m−3). The monitor usesαspectroscopy, so discrimination between 218Po,214Po, and also214Po and212Po is possible. The atmo-spheric222Rn activity concentration is estimated using the ratio of three222Rn progeny (218Po,214Po,214Pb) and the airflow (typical flow rate ca. 0.7 m3h−1, filter face velocity ca. 0.4 m s−1)recorded by means of a mass flow controller, assuming equilibrium between 222Rn and its progeny. The WLM uses a mathematical calibration method. There is no explicit mathematical formula available because an iterative method is applied. The sampling and the decay of the filter activities are described by differential equations:
dA(218Po)/dt=C(218Po)·V−λ(218Po)·A(218Po)
dA(214Pb)/dt=C(214Pb)·V−λ(214Po)
·(A(218Po)−A(214Pb))
dA(214Bi)/dt=C(214Bi)·V−λ(214Bi)
·(A(214Pb)−A(214Bi))
dN (218Po)/dt=η·A(218Po)
dN (214Po)/dt=η·A(214Po) with: A(214Po)=A(214Bi),
online measured volume air flow rate, λare the decay con-stants,N is the number of αcounts, andηis the counting efficiency of the detector-filter system.
The microcomputer of the WLM integrates in real time the differential equations for 20 different initial sets of the air ac-tivity concentrationsC(218Po),C(214Pb), andC(214Bi). That is, the collection and the decay of the filter activity is simu-lated during the measurement. The result of the 20 simulta-neous simulations are 20 pairs of calculated countsN (218Po) andN (214Pb).
The used sets of air activities are distributed over the range from C(218Po) :C(214Pb) :C(214Bi)=26.34 : 1.862 : 0.132 to C(218Po) :C(214Pb) :C(214Bi)=3.766 : 3.766 : 3.766. The calculatedαcounts of218Po and214Po for each of the 20 sets are compared with the real α counts seen by the detector. The ratio of the air activities, which fits best is taken to calculate the calibration factors for the potential
α energy and the Rn progeny. The activity concentration of 218Po and the concentration ratio 218Po and 214Bi are used to estimate the radon gas concentration at equilibrium according to
C(222Rn)=C(218Po)·(C(218Po)/C(214Bi))·kwithk=0.3.
Cycle time is 1 h, and the filter is changed every 24 h. The manufacturer describes the detection limit of this in-strument as 0.2 Bq m−3, the uncertainty of measured activity with±5 %, and the uncertainty of estimated222Rn assuming equilibrium with ±25 %. (Method description from the op-erating manual of “Tracerlab WLM ASF 200” by TRACER-LAB GmbH, Aachener Str. 1354, 50859 Cologne, Germany.)
2.3 Method of comparison between radon monitors
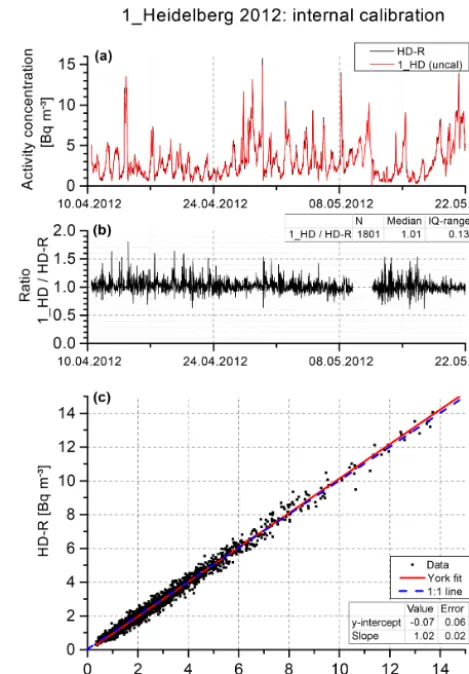
As an example of the comparison method used throughout this study, here we compare observations between an origi-nal HRM (i.e. our reference monitor, called HD-R (Heidel-berg reference), that is used as reference throughout the com-parison project to calibrate all other monitors that were sent to the various stations) and a modernized HRM in Heidel-berg. A typical comparison period is displayed in Fig. 1. The upper panel of Fig. 1 shows the atmospheric 214Po activity concentrations measured over 6 weeks in spring 2012 with two Heidelberg monitors (HD-R and the first prototype of the modernized version called “1_HD”). For a quantitative evaluation of the compatibility of measurements between the two monitors we first calculate the half-hourly activity ra-tios. The mean of these ratios (Fig. 1b) was 1.012±0.127 in the concentration range 1 to 15 Bq m−3, which is typi-cal for the Heidelberg measurement site, sampling air from about 30 m a.g.l. The half-hourly activity ratios show increas-ing scatter when ambient concentrations decrease. Linear re-gression of the half-hourly activity concentration data is dis-played in Fig. 1c. The slope of the York fit (York et al., 2004), taking into account errors in both thex andy components, is 1.021±0.016, i.e. not significantly different from unity
Figure 1.Comparison of214Po activity concentrations of two Hei-delberg radon monitors. HD-R is the monitor routinely running at the Heidelberg measurement site. 1_HD (uncal) is a monitor which had not been calibrated with HD-R before. All monitors that were used for the comparison campaigns were calibrated against HD-R.
and the intercept is very close to zero. The uncertainty of the slope is very small and may be used as an approximation of the mean compatibility of long-term measurements with different Heidelberg instruments. Likewise, the standard de-viation of the activity concentration ratios allows an estimate of the typical measurement repeatability in the concentration range at the observational site. The respective standard devi-ation of ca. 13 % for the half-hourly ratios of the two Heidel-berg data sets from Fig. 1b is at the upper end of our monitor comparability (generally between 7 and 14 %). From this we can estimate a typical uncertainty of half-hourly atmospheric 214Po data of about 10 %. This is in accordance with uncer-tainty estimates reported by Levin et al. (2002).
Table 1. Results from comparisons performed with the Heidelberg radon monitor (HRM) run at different European stations. The slopes (correction factors) are defined as (routine station monitor)/HRM (see Figs. S1 – S12).
ANSTO monitors Period Activity range Slope Offset
Cabauw: 200/180 m 10 July–26 August 2012 0–8 Bq m−3 1.11±0.04 0.11±0.06 Cabauw: 20 m 27 June 2012–10 January 2013 0–12 Bq m−3 1.30±0.01 0.21±0.03 Lutjewad: 60 m 1 January–1 October 2007 0–6 Bq m−3 1.11±0.02 0.11±0.02 Heidelberg: 35 m 25 April–31 July 2015 0–15 Bq m−3 1.22±0.01 0.42±0.04 Other monitors
Pallas: FMI-1 2014 14 June–15 September 2014 0–6 Bq m−3 1.45±0.05 0.18±0.06 Helsinki: FMI-2 May 2014 22 May–10 June 2014 0–6 Bq m−3 1.04±0.06 −0.03±0.11 Helsinki: FMI-2 October 2014 1–22 October 2014 0–10 Bq m−3 1.02±0.03 −0.03±0.09 Mace Head: LSCE 2013 4 March–20 May 2013 0–3.5 Bq m−3 0.95±0.07 −0.06±0.06 GIF: LSCE 2014 27 February–28 April 2014 0–9 Bq m−3 0.68±0.03 −0.18±0.09 SIL: BfS 2013 vs. 5_SIL2 24 September–10 December 2013 0–8 Bq m−3 1.12±0.02 0.24±0.04 SIL: BfS 2013 vs. 9_InGOS 24 September–10 December 2013 0–8 Bq m−3 1.12±0.02 0.24±0.04 HPB: Tracerlab 2014 1 January 2014–30 April 2014 0–12 Bq m−3 1.03±0.02 0.26±0.05
Pallas
Helsinki
Mace
Head
Lutjewad
Cabauw
Gif sur Yvette
Hohenpeißenberg
Schauinsland
Heidelberg
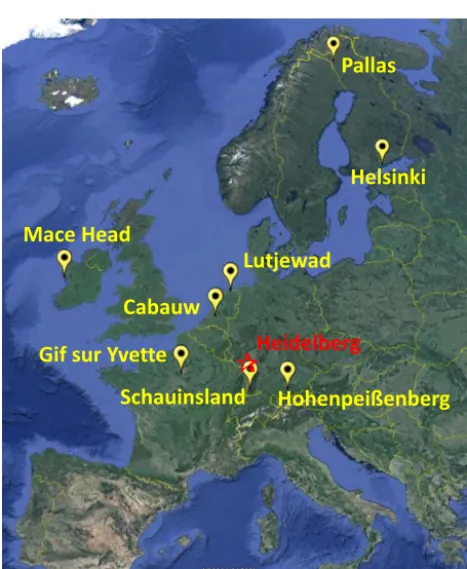
Figure 2. Map of European stations where222radon comparison campaigns were conducted. This map was created with Google Earth (http://earth.google.com).
al., 2017), we do not correct for disequilibrium but directly compare the214Po or other222Rn progeny activity concen-trations (in the case of one-filter systems) or to222Rn activ-ity concentrations (in the case of two-filter systems, i.e. from ANSTO).
2.4 Site descriptions and222Rn instrumentation at the comparison stations
Between 2007 and 2015, different HRMs were sent from Heidelberg to eight stations in Europe for comparison with the local radon measurement systems (for station locations, see map Fig. 2). In addition, comparison between the HRM and a newly installed ANSTO monitor in Heidelberg was made. Before and after each measurement campaign, the mo-bile HRM was calibrated against our original reference mon-itor HD-R in the Heidelberg laboratory. All comparison pe-riods at the remote stations covered at least 4 weeks, to ob-tain sufficient data and sample different meteorological con-ditions. The stations, campaign dates, concentration ranges covered, as well as slopes andyintercepts of the regression lines are summarized in Table 1. A brief description of the station characteristics and routine measurement systems used at these sites is given in the following sections.
2.4.1 Pallas (FI, 67◦580N, 24◦070E; 565 m a.s.l.)
at times of the year when local soils do emit220Rn to the at-mosphere it rarely influences observations since the station, due to its elevation, predominantly samples free tropospheric air. Therefore,220Rn progeny have a negligible contribution to the total beta count rate (Mattsson et al., 1996; Paatero et al., 1998). For the same reason 222Rn and its short-lived progeny at this site predominantly arise through long-range transport and are consequently close to equilibrium during most meteorological situations (see below).
Ambient air is collected via an inlet 5 m a.g.l. Due to its elevation, the station is in cloud from time to time, ca. 10 % of the time during summer and up to 40 % of the time during autumn (Hatakka et al., 2003). For this reason the sampling line inlet is warmed during the seasons when the tempera-ture can drop below freezing (ca. October–May). A rough estimation of the 1σ counting statistics of the Pallas mon-itor is ±20 %, assuming a stable 222Rn activity concentra-tion of 1 Bq m−3. The comparison campaign at Pallas was conducted during summer and autumn, i.e. from 14 June to 15 September 2014. The activity concentration range cov-ered during this campaign (as measured by the HRM) was between 0.05 and 6 Bq m−3.
As with all systems that measure aerosol-bound 222Rn progeny, there are uncertainties associated with estimating atmospheric 222Rn activity concentration due to potential disequilibrium between222Rn and its progeny. This is partic-ularly the case when the air is humidity saturated. According to Gründel and Porstendörfer (2004) over 80 % of the short-lived radon progeny are attached to accumulation-mode par-ticles. If the monitor is sampling in cloud or fog, these parti-cles can form cloud droplets. Komppula et al. (2005) have re-ported that at Pallas on the average 87 % of the accumulation-mode particles and 30 % of Aitken-accumulation-mode particles grow to cloud droplets. The system does not collect these droplets due to the sampling line design. However, the comparison at this station is between a pair of one-filter systems, and both instruments encounter this problem.
2.4.2 Helsinki (FI, 60◦120N, 24◦580E; 26 m a.s.l.)
The FMI’s head office is located on top of a small hill at Kumpula campus, Helsinki, about 4 km NNE of the city cen-tre. Routine radon measurements are conducted using a stan-dard FMI one-filter β-activity monitor. Ambient air is col-lected at 27 m a.g.l. The estimated counting uncertainty is ±20 %, assuming a stable 222Rn activity concentration of 1 Bq m−3. The comparisons were conducted in two periods, i.e. from 22 May to 10 June and from 1 to 22 October 2014. The activity concentrations covered ranges in the first cam-paign from almost zero to 6 Bq m−3and in the second cam-paign from almost 0 up to ca. 10 Bq m−3.
2.4.3 Mace Head (IR, 53◦200N, 9◦540W; 15 m a.s.l.)
The WMO/GAW and AGAGE station Mace Head is located at the west coast of Ireland, about 10 m away from the coast-line (Fig. 2).222Rn and220Rn progeny have been monitored at Mace Head since June 1995. Routine measurements at this site are conducted using an active deposit moving-filter mon-itor, built and run by LSCE (Polian, 1986; Biraud, 2000). The detection limit of the LSCE measurement system is 0.3 mBq m−3. The statistical error for a 2 h measurement pe-riod at ambient activity concentrations of about 1 mBq m−3 is close to 10 %, and the total error including uncertainties on flow rate and filtering efficiency is estimated to±20 %.
The comparison measurements at Mace Head were made at the occasion of a comparison campaign performed for greenhouse gases measurements in the framework of the InGOS project (Vardag et al., 2014) from 4 March to 20 May 2013. Ambient air for 222Rn progeny comparison measurements was collected here using 11 m of standard De-cabon tubing (10 mm inner diameter) with the air intake at ca. 5 m a.g.l., the same height and type of tubing as for the routine measurements.
2.4.4 Cabauw (NL, 51◦580N, 4◦560E;−0.7 m a.s.l.)
The instrument tower at Cabauw is 213 m high, built specif-ically for meteorological research to establish relations be-tween the states of the atmospheric boundary layer, land sur-face conditions, and the general weather situation for all sea-sons. The tower is located in the western part of the Nether-lands in a polder 0.7 m below average sea level. This site was chosen because it is representative for this part of the Nether-lands. The North Sea is more than 50 km away to the WNW. Routine radon measurements at this site are conducted us-ing two 1500 L ANSTO two-filter detectors operatus-ing at two heights: 20 and 200 m a.g.l. Air for each monitor is drawn at approximately 6 m3h−1through 7 cm outer diameter tery-lene fiber water pipes by a stack blower and pushed through the radon monitor.
Uncertainty of the calibrated hourly radon concentrations depends upon a combination of calibration source accu-racy (±4 % for both detectors), statistical counting error (which decreases with increasing radon activity concentra-tion: e.g. 30 % at∼0.03 Bq m−3, 13 % at 0.1 Bq m−3, 3 % at 1 Bq m−3), the coefficient of variability of valid monthly cal-ibration coefficients (2.1 % at 20 m and 2.4 % at 200 m), and the background count variability (σ≈7 mBq m−3). There-fore, at radon concentrations of around 100 mBq m−3, the uncertainty would be of order 26 %, but this reduces to ∼10 % at a concentration of 1 Bq m−3.
both levels. However, as there was no possibility to install the HRM filter head directly at the 200 m level close to the ANSTO intake, it was set up at the 180 m platform, i.e. 20 m below the intake of the ANSTO system. This platform is ac-cessible via stairs and/or an elevator, so that the HRM filter changes were easy to perform.
At Cabauw two tests could be conducted: (1) HRMa col-lected air directly at the 180 m level through a short (0.5 m) Teflon tubing (10 July–26 August 2012) and (2) HRMb col-lected air directly from the 20 m level also through a short (0.5 m) Teflon intake line (27 June 2012– 10 January 2013).
2.4.5 Lutjewad (NL, 53◦240N, 6◦210E; 1 m a.s.l.)
Lutjewad station is located directly on the sea dike at the Dutch North Sea coast in the so-called Julianapolder re-claimed in 1923. The location allows for the sampling of con-tinental air masses with southerly winds, as well as nearly undisturbed marine air masses with a long North Sea fetch from the north.
Routine radon measurements at Lutjewad have been con-ducted since August 2005, using a 1500 L ANSTO two-filter monitor located in the Lutjewad station building. Sample air is drawn at a flow rate of 4.8 m3h−1 from the top of a 60 m tower through 100 m of 100 mm internal diameter PVC pipe (van der Laan et al., 2010). As for the Cabauw monitors, the uncertainty of calibrated radon concentrations is a combination of source accuracy (±4 %), the detector’s counting error (which decreases with increasing radon con-centration, i.e. 30 % at 0.04 Bq m−3, 15 % at 0.1 Bq m−3, 3.5 % at 1 Bq m−3), the coefficient of variability of valid monthly calibration coefficients (2 %), and the background count variability (σ≈10 mBq m−3). Therefore, at concen-trations of around 100 mBq m−3, the uncertainty would be of order 31 %, but this reduces to around 11 % at a concen-tration of 1 Bq m−3.
For the comparison campaign at Lutjewad, the filter holder of the HRM was mounted also at the 60 m level of the tower with a 0.5 m Teflon inlet pipe and a funnel to prevent rainwa-ter intake. The comparison was conducted from 1 January to 1 October 2007.
2.4.6 Heidelberg (DE, 49◦250N, 8◦410E; 116 m a.s.l.)
Heidelberg is a medium size city located in the Upper Rhine valley in south-west Germany. Monitoring of air constituents such as greenhouse gases (Levin et al., 2011) is conducted from the roof of the institute’s building on the university campus.222Rn has been measured at this station since 1999 with an original HRM. Since April 2015 radon has also been monitored simultaneously with an ANSTO 1500 L two-filter radon monitor and a second HRM. Both detectors sample from a height of ca. 35 m a.g.l., through short co-located in-take lines. The ANSTO monitor samples at a flow rate of ca. 3 m3h−1.
As for the Cabauw detector, the two-filter monitor at Hei-delberg is calibrated at about monthly intervals by introduc-ing an air stream with222Rn from a226Ra calibration source of known emission rate (Pylon model 2000A passive radon source). Background measurements are performed about ev-ery 3 months. Uncertainty of the calibrated hourly radon concentrations depends upon a combination of calibration source accuracy (±4 %), statistical counting error (which de-creases with increasing radon concentration: e.g. 30 % at ∼0.034 Bq m−3, 13 % at 0.1 Bq m−3, 3.2 % at 1 Bq m−3), the coefficient of variability of valid monthly calibration co-efficients (3.5 %), and the background count variability (σ≈ 5 mBq m−3). Therefore, at radon concentrations of around 100 mBq m−3, the uncertainty would be of order 26 %, but this reduces to∼11 % at a concentration of 1 Bq m−3. The results from the HRM–ANSTO comparison in Heidelberg are presented for the period May–July 2015.
2.4.7 Gif-sur-Yvette (F, 48◦250N, 02◦050E; 167 m a.s.l.)
Gif-sur-Yvette station is located approximately 20 km south-west of Paris. Routine radon measurements have been per-formed at this station since 2002 using an LSCE active de-posit moving filter detector. However, unlike the LSCE mon-itor configuration at Mace Head, the sampling period at this site lasts only 1 h before the filter is placed under anα spec-trometer to measure the radioactive decay of the222Rn and 220Rn progeny. The inlet line at Gif-sur-Yvette station is lo-cated only 2 m a.g.l., where the short-lived222Rn progeny are not in equilibrium with the gaseous222Rn. However, as we compare only214Po activity concentrations, this is not rele-vant here. The comparison campaign at Gif-sur-Yvette was conducted from 27 February to 28 April 2014, with an activ-ity concentration range of about 0–9 Bq m−3.
2.4.8 Schauinsland (DE, 47◦550N, 07◦540E;
1205 m a.s.l.)
filter for an additional hour, and then the air flow is started again. The sensitivity for222Rn is 3.367 Bq cps−1(counts per second) or 0.0673 Bq m−3cps−1for an airflow rate of about 50 m3h−1. The background count rate used for data evalua-tion is 0.043 cps and was determined during a period of sev-eral days with no airflow. The temporal resolution of222Rn and progeny measurements is 10 min. Stockburger (1960) es-timated an uncertainty of 3–4 % for a typical 222Rn mea-surement at Schauinsland at activity concentrations of 1– 4 Bq m−3 (not taking into account uncertainties in the dis-equilibrium). More realistically, we assume an overall un-certainty (of214Po) to be comparable to that of the Heidel-berg system, i.e. around 5–10 % for the activity concentration range of 0–8 Bq m−3, as measured during the comparison of the two detection systems.
At Schauinsland, comparison with two HRMs was con-ducted in parallel from 24 September to 10 December 2013. An earlier comparison study with an ANSTO system had been performed in 2007–2008 by Xia et al. (2010). For this comparison the authors reported mean ratios between the ANSTO and the BfS system of BfS/ANSTO=0.74 to 0.87, depending on meteorological conditions. Still, during dry weather situations with potentially small aerosol loss pro-cesses being active, the ANSTO system was measuring at least 14 % higher activity concentrations than the BfS sys-tem. We will discuss the results from this study to evaluate possible calibration differences between the one-filter sys-tems and the ANSTO detectors, as well as for estimating 214Po/222Rn disequilibrium at the Schauinsland station.
2.4.9 Hohenpeißenberg (DE, 47◦480N, 11◦010E;
985 m a.s.l.)
The GAW station HPB is located on a small mountain ridge in the pre-Alps in southern Germany. It is run by the German Weather Service (DWD). Radon progeny measure-ments started here in 1999 with the data being available at WMO/GAW World Data Centre for Greenhouse Gases (WDCGG) (http://ds.data.jma.go.jp/gmd/wdcgg/cgi-bin/ wdcgg/accessdata.cgi?index=HPB647N00-DWD¶= 222Rn&select=inventory).
Routine radon measurements at this station are made us-ing a Tracerlab WML monitor. The inlet line for the HPB 222Rn monitor consists of a ca. 0.4 m, 6 cm inner diameter PVC tubing. For comparison measurements with the HRM its 0.4 m long PFA tubing was mounted inside the HPB PVC tubing, ensuring the same air is sucked into the respective in-struments. Both monitors were located at the HPB-GAW lab on the fourth floor of the building with the air intake directly at the window, ca. 10 m a.g.l. As no disequilibrium between atmospheric222Rn and214Po is taken into account in the data evaluation, we assume equal activity concentration of214Po and estimated222Rn of the Tracerlab WML detector in our comparison.
The last calibration of this instrument took place at the BfS, Berlin, Germany, with calibration mark 612/D-K-15063-01-00/2013-03 in March 2012 at activity con-centrations measured by the reference monitor with 10.1×10⁻⁶J m−3 with an extended uncertainty of 1.2× 10⁻⁶J m−3. The HPB Tracerlab WLM measured an ac-tivity of 9.2×10⁻⁶J m−3 with an extended uncertainty of 1.4×10⁻⁶J m−3, leading to a ratio between reference and ex-aminee analyser of 1.09±0.21 on the 95 % confidence level. The comparison campaign with the HRM at HPB observa-tory was conducted from 1 January to 30 April 2014.
3 Results
3.1 Comparison at stations using two-filter ANSTO systems
3.1.1 Results from 180 and 20 m at Cabauw
From 10 July to 26 August 2012 a HRM was installed on the Cabauw tower at 180 m, so that measurements could be conducted in parallel to the ANSTO system (collecting air from the 200 m level) without additional tubing. The results obtained from the available measurements are shown in Sup-plementary Fig. S1. The data cover a concentration range from close to zero up to 8 Bq m−3, which is typical for this site and elevation. A short period of observations from 3 Au-gust 2012, directly after a filter change of the HRM, has been flagged; all other data were used for a linear regression. The correlation of the two data sets in Fig. S1, lower panel, yielded a slope of ANSTO/HRM=1.11±0.04, i.e. on av-erage the Cabauw ANSTO monitor at 200 m measured 11 % higher222Rn activity concentrations than the214Po activity concentration measured with the HRM at 180 m.
3.1.2 Results from 60 m above ground at Lutjewad
An original HRM was installed and operated at Lutjewad from January to September 2007. For this comparison, the HRM filter head was mounted very close to the inlet of the ANSTO system on top of the tower at 60 m a.g.l., so that di-rect comparison of the data (without additional tubing) was possible. The comparison data are displayed in Fig. S3. The activity concentration range as measured with the ANSTO system was from close to 0 up to 6 Bq m−3. The slope of the regression of all data yielded a mean of ANSTO/HRM= 1.11±0.02, i.e. the same value as observed at the 180 m level at Cabauw. Jacobi and André (1963) do not estimate changes of the disequilibrium between214Po and222Rn of more than a few percent for altitudes above 50 m a.g.l. This may indi-cate that the differences between the ANSTO and the HRM systems at Cabauw (180 m) and Lutjewad (60 m) are rather due to calibration differences than due to disequilibrium ef-fects. We will discuss this point further in Sect. 4.1.
3.1.3 Results from 35 m above ground in Heidelberg
Comparison of results from the HRM and ANSTO systems run in Heidelberg since April 2015 is displayed in Fig. S4. Activity concentrations at this site and elevation ranged from almost 0 to about 15 Bq m−3. The slope of the regression line of all half-hourly values was ANSTO/HRM=1.22±0.01. As expected, the ANSTO/HRM ratio and thus the disequi-librium in Heidelberg for 35 m a.g.l. is slightly smaller than the one measured at Cabauw tower at the 20 m level.
3.2 Comparison at stations using one-filter systems
As described in Sect. 2.3, all other monitors compared in this study were essentially one-filter systems, i.e. they measured aerosol-bound222Rn progeny to estimate atmospheric222Rn activity concentration. For these stations, we either directly compare the 214Po activity concentrations or assume equi-librium between the estimated222Rn from the station instru-ment, which we call “equivalent radon” in Figs. S5–S9 and the214Po measurements of the HRM, as both systems suffer from similar aerosol loss processes. All comparison results are plotted in Supplementary Figs. S5–S12, while the slopes and offsets of the standard regression lines are listed in Ta-ble 1.
The range of regression slopes (routine station moni-tor/HRM) was between 0.68 and 1.45, while the offsets were generally small (−0.18. . .+0.42) Bq m−3. The huge range of slopes (i.e. differences in measurement principle or cali-bration of the different systems) underlines the importance of our radon comparison project. At some stations, a num-ber of earlier comparison campaigns had been conducted (i.e. Schauinsland and Gif-sur Yvette) which showed slightly dif-ferent slopes and offsets than listed in Table 1. However, we will not discuss these earlier comparison data here
be-cause the current study was conducted with HRM systems that were very well and consistently calibrated against the HD-R.
4 Discussion
4.1 Calibration differences
The comparison of one-filter monitors yields correction fac-tors that allow normalizing214Po or other 222Rn progeny-based222Rn activity concentration measurements from a net-work of stations (e.g. for modelling studies). These nor-malized222Rn data cannot be merged with true222Rn data from two-filter systems without correcting them for disequi-librium. However, separating observed differences between HRM and two-filter systems, as obtained in our study, into a calibration and a disequilibrium part is not straightforward. The difficulty mainly comes from the fact that there is no common calibration method available that would serve both measurement systems.
All ANSTO monitors are calibrated with 226Ra sources that are certified as accurate to about 4 %. There are addi-tional sources of error in the ANSTO222Rn measurements, i.e. in the characterization of the instrumental background, flow rate stability, counting error, and calibration factor vari-ability that, combined, result in an uncertainty for a 1 h con-centration measurement of order 10 % at activity concentra-tions of∼1 Bq m−3. This uncertainty reduces for longer av-eraging times. Levin et al. (2002) have estimated a typical measurement uncertainty of the HRM for atmospheric214Po activity concentrations for continental air to less than 10 %. This includes uncertainty of the flow rate, the counting statis-tics, and filter efficiency, solid angle of the detector, and un-certainty in the assumption of 100 % counting efficiency of the surface barrier detector forαparticles. The potential sys-tematic bias of the HRM is, however, most probably smaller than 10 %, so that the maximum calibration bias between the two measurement systems (at full equilibrium between214Po and222Rn) may be 12–15 %.
The only one-filter monitor included in our comparison study that had been externally calibrated was the Tracerlab WLM instrument running at HPB. Its calibration yielded a 9 % lower value compared to the reference at the calibra-tion institucalibra-tion (see Sect. 2.4.9). When conducting the com-parison campaign at HPB, the Tracerlab WLM system mea-sured 3 % higher values than the HRM. This indicates that the HRM may measure214Po activity concentrations too low by as much as 12 %, compared to the calibration unit at BfS in Berlin, Germany.
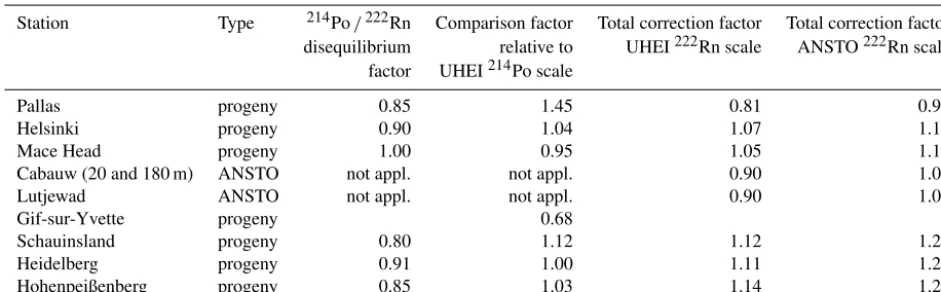
Table 2.Estimated disequilibrium of Rn progeny measurements at the European monitoring stations where one-filter measurement systems are used (column 3), intercomparison factor (column 4, same as slopes listed in Table 1), and total (multiplicative) correction factors for 222Rn or progeny-based222Rn measurements to bring them on the UHEI222Rn scale (column 5) or on the ANSTO222Rn scale (column 6).
Station Type 214Po/222Rn Comparison factor Total correction factor Total correction factor disequilibrium relative to UHEI222Rn scale ANSTO222Rn scale
factor UHEI214Po scale
Pallas progeny 0.85 1.45 0.81 0.90
Helsinki progeny 0.90 1.04 1.07 1.19
Mace Head progeny 1.00 0.95 1.05 1.17
Cabauw (20 and 180 m) ANSTO not appl. not appl. 0.90 1.00
Lutjewad ANSTO not appl. not appl. 0.90 1.00
Gif-sur-Yvette progeny 0.68
Schauinsland progeny 0.80 1.12 1.12 1.24
Heidelberg progeny 0.91 1.00 1.11 1.22
Hohenpeißenberg progeny 0.85 1.03 1.14 1.27
222Rn (as measured with the ANSTO systems) is negligible above about 50 m a.g.l., which is supported by the theoret-ical estimates of Jacobi and André (1963). If the measured difference between ANSTO and HRM at 180 m at Cabauw would still include a contribution from disequilibrium, we would expect significant differences of the ANSTO/HRM ratio during stable and unstable atmospheric situations, with a higher ratio at unstable well-mixed atmospheric situations (i.e. during day) and a lower ratio during stable conditions (i.e. during night). With this in mind we evaluated these two situations separately but found no significant difference in re-sults. Based on these independent findings, for the following discussion and estimate of disequilibrium factors, we thus do assume a calibration difference between ANSTO and HRM of 11 % (with an uncertainty of about 2–4 %).
4.2 Preliminary estimate of214Po/222Rn disequilibria for European sites with one-filter systems
Taking into account the calibration bias, ANSTO/HRM=1.11, we estimate a disequilibrium of 214Po/222Rn=1.11/1.3=0.85 for the 20 m level at Cabauw, where the measured slope ANSTO/HRM was 1.30 (Fig. S2). The uncertainty of this estimate is of order 10 %. A slightly higher disequilibrium value is estimated for Heidelberg (i.e. 1.11/1.22=0.91, Table 2, third column). Cuntz (1997) determined a mean disequilibrium of 0.704±0.081 at the earlier Heidelberg sampling site at ca. 20 m a.g.l., based on a comparison with slow-pulse ionization chamber measurements. This earlier value is significantly smaller than our new estimate for 35 m a.g.l., based on the comparison with the Heidelberg ANSTO detector. However, if we take into account that the HRM is most probably measuring 214Po activity concentrations by 11 % too low we may attribute part of the earlier difference measured by Cuntz (1997) to a “calibration bias” of the
HRM; this would bring both disequilibrium values closer together.
Also, for all other European stations that were part of the comparison study using one-filter systems, average lo-cal disequilibrium factors need to be estimated before these data can be used for quantitative applications. We, there-fore, made a respective preliminary attempt, based on the as-sumption that the214Po/222Rn disequilibrium at non-coastal sites increases with decreasing height above local ground (Ja-cobi and André, 1963). For Helsinki, where sampling is con-ducted ca. 30 m a.g.l., we can assume a similar value as for Heidelberg 35 m a.g.l., i.e. about 0.9 (Table 2, third column). At Mace Head, located directly on the Irish coast, we can probably assume that the disequilibrium is similar to that at the coastal site Lutjewad (i.e. close to 1 or slightly lower, if the air has recently been in contact with land), despite sam-pling at Mace Head being conducted only from 5 m a.g.l. Only at the more continental station Gif-sur-Yvette, where air for222Rn progeny measurements is sampled very close to the ground (i.e. 2 m), are we not able to make a justifiable disequilibrium estimate with the existing information.
similar to Schauinsland or slightly larger (i.e. between 0.8 and 0.9), also because the air intake heights at these sta-tions are slightly higher above local ground (between 5 and 10 m a.g.l.).
All our first estimates of mean disequilibrium factors for European stations with one-filter systems are listed in Ta-ble 2 (third column). They should be taken as preliminary, with a likely uncertainty (and variability due to different meteorological conditions) of about 0.05 to 0.1. We inves-tigated the variation of monthly mean disequilibrium fac-tors for Lutjewad and Heidelberg (Capuana, 2016), which were surprisingly constant with standard deviations smaller than 0.1 at both sites. Similar moderate variations were ob-served on the diurnal timescale with slightly lower (0.1) val-ues during daytime in summer than during early morning. This finding is in accordance with earlier work reported by Porstendörfer (1994). Only during rare situations with fog at Lutjewad did we experience exceptional222Rn progeny loss; otherwise, no systematic relation between disequilibrium and meteorological conditions was identified in our data sets. However, individual hourly measurements may show larger deviations from the averages given in Table 2. If we want to correct all European station data to be comparable with HRM222Rn data (we call this here “UHEI222Rn scale”), we have to combine two correction factors, the comparison fac-tor from Table 1 (column 4 in Table 2) and the disequilibrium factor (column 3 in Table 2) for one-filter systems. This will yield222Rn (UHEI222Rn scale)=measured activity concen-tration/(comparison factor×disequilibrium factor). If the data shall be normalized to the ANSTO scale, further mul-tiplication of these values by 1.11 is required. Both total cor-rection factors are listed in Table 2 (last two columns).
5 Conclusions
Our222Rn comparison exercise has been very successful in providing correction factors to make European 222Rn and 222Rn progeny-based measurements comparable. The slopes given in Table 1 can be used to transfer data sets to the Hei-delberg214Po scale. In the case of one-filter systems, which measure only222Rn progeny activity concentrations, further disequilibrium corrections are necessary to estimate atmo-spheric 222Rn activity concentrations. First preliminary es-timates of average correction factors, based on comparisons between the one-filter HRM and the two-filter ANSTO sys-tems at Cabauw, Lutjewad, Heidelberg, and Schauinsland range from 0.8 to 0.9. For model intercomparison studies, both corrections have to be applied to one-filter systems; therefore also the total multiplicative correction factors are presented (last two columns of Table 2). Further compari-son studies, e.g. with ANSTO monitors or other measure-ment systems, are needed to better determine the disequilib-rium between214Po (and other222Rn progeny) and222Rn for the sites with one-filter systems, so that the one-filter-based
222Rn data can reliably be used for quantitative model com-parison and flux estimates, e.g. using the radon tracer method (Levin et al., 1999).
Data availability. Data related to this paper are available online from the University of Heidelberg under doi:10.11588/data/10098.
The Supplement related to this article is available online at doi:10.5194/amt-10-1299-2017-supplement.
Competing interests. The authors declare that they have no conflict of interest.
Acknowledgements. The research leading to these results has received funding from the European Community’s Seventh Frame-work Programme (FP7/2007-2013) in the InGOS project under grant agreement no. 284274. We wish to thank the technicians and personnel at the stations for their support during the comparison study and Martina Schmidt (Laboratoire des Science du Climat et de l’Environnement, CNRS/CEA, Gif-sur-Yvette, France) for organizational help during the comparison at Gif-sur-Yvette. John Moncrieff (University of Edinburgh) is gratefully acknowledged for donating his ANSTO monitor to Heidelberg University. We wish to thank Claudia Grossi and two anonymous reviewers for their helpful comments on our manuscript. Finally, we acknowl-edge financial support by Deutsche Forschungsgemeinschaft and Ruprecht-Karls-Universität Heidelberg within the funding programme Open Access Publishing.
Edited by: C. Brümmer
Reviewed by: C. Grossi and two anonymous referees
References
Biraud, S.: Vers la régionalisation des puits et sources des com-poses à effet de serre: analyse de la variabilité synoptique à l’observatoire de Mace Head, Irlande, PhD Thesis, University of Paris VII, France, 2000.
Capuana, C.-A.: Calibration of ionization chambers and comparison of two monitors for radon measurement, BA Thesis, Institut für Umweltphysik, Heidelberg University, 2016 (in German). Chambers, S., Williams, A. G., Zahorowski, W., Griffiths, A. D.,
and Crawford, J.: Separating remote fetch and local mixing influ-ences on vertical radon measurements in the lower atmosphere, Tellus B, 63, 843–859, 2011.
Cuntz, M.: The Heidelberg222Rn monitor: Calibration, optimisa-tion, applicaoptimisa-tion, Diploma Thesis, Institut für Umweltphysik, Heidelberg University, Germany, 1997.
Dörr, H., Kromer, B., Levin, I., Münnich, K. O., and Volpp, H. J.: CO2and Radon-222 as tracers for atmospheric transport, J. Geo-phys. Res., 88, 1309–1313, 1983.
Global Atmosphere Watch Programmes der WMO, Umwelt-forschungsstation Schneefernerhaus, Wissenschaftliche Resul-tate 2011/2012, http://www.schneefernerhaus.de/fileadmin/web_ data/bilder/pdf/UFS-Broschuere_2012.pdf, last access: 18 Au-gust, 2016.
Griffiths, A. D., Chambers, S. D., Williams, A. G., and Werczyn-ski, S.: Increasing the accuracy and temporal resolution of two-filter radon–222 measurements by correcting for the instrument response, Atmos. Meas. Tech., 9, 2689–2707, doi:10.5194/amt-9-2689-2016, 2016.
Grossi, C., Arnold, D., Adame, A. J., Lopez-Coto, I., Bolivar, J. P., de la Morena, B. A., and Vargas, A.: Atmospheric 222Rn concentration and source term at El Arenosillo 100 m meteoro-logical tower in southwest, Spain. Radiat. Meas., 47, 149–162, doi:10.1016/j.radmeas.2011.11.006, 2012.
Gründel, M. and Porstendörfer, J.: Differences between the activity size distributions of the different natural radionuclide aerosols in outdoor air, Atmos. Environ., 38, 3723–3728, 2004.
Hatakka, J., Aalto, T., Aaltonen, V., Aurela, M., Hakola, H., Komp-pula, M., Laurila, T., Lihavainen, H., Paatero, J., Salminen, K., and Viisanen, Y.: Overview of the atmospheric research activities and results at Pallas GAW station, Boreal Env. Res., 8, 365–383, 2003.
Jacob, D. J. and Prather, M. J.: Radon-222 as a test of convective transport in a general circulation model, Tellus B, 42, 118–134, 1990.
Jacob, D. J., Prather, M. J., Rasch, P. J., Shia R. L., Balkanski, Y., J., Beagley, S. R., Bergmann, D. J., Blackshear, W. T., Brown, M., Chiba, M., Chipperfield, M. P., Degrandpre, J., Dignon, J. E., Fe-ichter, J., Genthon, C., Grose, W. L., Kasibhatla, P. S., Kohler, I., Kritz, M. A., Law, K., Penner, J. E., Ramonet, M., Reeves, C. E., Rotman, D. A., Stockwell, D. Z., Vanvelthoven, P. F. J., Verver, G., Wild, O., Yang, H., and Zimmermann, P.: Evaluation and intercomparison of global atmospheric transport models us-ing Rn-222 and other short-lived tracers, J. Geophys. Res., 102, 5953–5970, 1997.
Jacobi, W. and André, K.: The vertical distribution of Radon 222, Radon 220 and their decay products in the atmosphere, J. Geo-phys. Res., 68, 3799–3814, 1963.
Karstens, U., Schwingshackl, C., Schmithüsen, D., and Levin, I.: A process-based222radon flux map for Europe and its compari-son to long-term observations, Atmos. Chem. Phys., 15, 12845– 12865, doi:10.5194/acp-15-12845-2015, 2015.
Komppula, M., Lihavainen, H., Kerminen, V.-M., Kulmala, M., and Viisanen, Y.: Measurements of cloud droplet activation of aerosol particles at a clean subarctic background site, J. Geophys. Res., 110, D06204, DOI:10.1029/2004JD005200, 2005.
Levin, I., Glatzel-Mattheier, H., Marik, T., Cuntz, M., Schmidt, M., and Worthy, D. E.: Verification of German methane emission in-ventories and their recent changes based on atmospheric obser-vations, J. Geophys. Res., 104, 3447–3456, 1999.
Levin, I., Born, M., Cuntz, M., Langendörfer, U., Mantsch, S., Nae-gler, T., Schmidt, M., Varlagin, A., Verclas, S., and Wagenbach, D.: Observations of atmospheric variability and soil exhalation rate of Radon-222 at a Russian forest site: Technical approach and deployment for boundary layer studies, Tellus B, 54, 462– 475, 2002.
Levin, I., Hammer, S., Eichelmann, E., and Vogel, F.: Verification of greenhouse gas emission reductions: The prospect of
atmo-spheric monitoring in polluted areas, Philos. T. R. Soc. A, 369, 1906–1924, 2011.
Levin, I., Schmithüsen, D., and Vermeulen, A.: Assessment of 222radon progeny loss in long tubing based on static filter
mea-surements in the laboratory and in the field, Atmos. Meas. Tech., 10, 1313–1321, doi:10.5194/amt-10-1313-2017, 2017.
Mattsson, R., Helminen, V. A., and Sucksdorff, C.: Some investi-gations of airborne radioactivity with a view to meteorological applications, Contributions No. 58, Finnish Meteorological Of-fice, Helsinki, 1965.
Mattsson, R., Paatero, J., and Hatakka, J.: Automatic alpha/beta analyser for the air filter samples – absolute determination of radon progeny by pseudo-coincidence techniques, Radiat. Prot. Dosim., 63, 133–139, 1996.
Nazaroff, W. W.: Radon transport from soil to air, Rev. Geophys., 30, 137–160, 1992.
Paatero, J., Hatakka, J., Mattsson, R., and Lehtinen, I.: A compre-hensive station for monitoring atmospheric radioactivity, Radiat. Prot. Dosim., 54, 33–39, 1994.
Paatero, J., Hatakka, J., and Viisanen, Y.: Concurrent measurements of airborne radon-222, lead-210 and beryllium-7 at the Pallas-Sodankylä GAW station, Northern Finland, Reports 1998:1, Finnish Meteorological Institute, Helsinki, 1998.
Polian, G.: Les transports atmosphériques dans l’hémisphère sud et le bilan global du radon-222, PhD Thesis, University of Paris VI, France, 1986.
Polian, G., Lambert, G., Ardouin, B., and Jegou, A.: Long-range transport of continental radon in subantarctic areas, Tellus B, 38, 178–189, 1996.
Porstendörfer, J.: Properties and behaviour of radon and thoron and their decay products in the air, J. Aerosol. Sci., 25, 219–263, 1994.
Rosenfeld, M.: Modification of the Heidelberg Radon Monitor and first measurements, Diploma Thesis, Institut für Umweltphysik, Heidelberg University, 2010 (in German).
Schery, S. D. and Huang, S.: An estimate of the global distribu-tion of radon emissions from the ocean, Geophys. Res. Lett., 31, L19104, doi:10.1029/2004GL021051, 2004.
Schmithüsen, D., Chambers, S., Fischer, B., Gilge, S., Hatakka, J., Kazan, V., Neubert, R., Paatero, J., Ramonet, M., Schlosser, C., Schmid, S., Vermeulen, A., and Levin, I.: A European – wide 222Radon and 222Radon progeny comparison study, dataset,
doi:10.1158/data/10098, 2017.
Stockburger, H.: Continuous measurement of radon-, thorium B-and progeny activity concentration in the atmosphere, PhD The-sis, Freiburg University, 1960 (in German).
Stockburger, H. und Sittkus, A.: Unmittelbare Messung der natür-lichen und künstnatür-lichen Radioaktivität der atmosphärischen Luft, Zeitschrift für Naturforschung, 21, 1128–1132, 1966.
Taguchi, S., Law, R. M., Rödenbeck, C., Patra, P. K., Maksyutov, S., Zahorowski, W., Sartorius, H., and Levin, I.: TransCom continu-ous experiment: comparison of222Rn transport at hourly time scales at three stations in Germany, Atmos. Chem. Phys., 11, 10071–10084, doi:10.5194/acp-11-10071-2011, 2011.
Thomas, J. W. and Leclare, P. C.: A study of the two-filter method for radon-222, Health Phys., 18, 113–122, 1970.
CO and222Radon, Tellus B, 62, 389–402, doi:10.1111/j.1600-0889.2010.00493.x, 2010.
Vardag, S. N., Hammer, S., O’Doherty, S., Spain, T. G., Wastine, B., Jordan, A., and Levin, I.: Comparisons of continuous atmo-spheric CH4, CO2and N2O measurements – results from a trav-elling instrument campaign at Mace Head, Atmos. Chem. Phys., 14, 8403–8418, doi:10.5194/acp-14-8403-2014, 2014.
Volpp, J.: Investigation of large scale atmospheric transport in Cen-tral Europe using222Radon, PhD Thesis, Heidelberg University, 1984 (in German).
Whittlestone, S. and Zahorowski, W.: Baseline radon detectors for shipboard use: development and deployment in the First Aerosol Characterization Experiment (ACE 1), J. Geophys. Res., 103, 16743–16751, 1998.
Williams, A. G., Zahorowski, W., Chambers, S., Griffiths, A., Hacker, J. M., Element, A., and Werczynski, S.: The vertical dis-tribution of radon in clear and cloudy daytime terrestrial bound-ary layers, J. Atmos. Sci., 68, 155–174, 2011.
Xia, Y., Sartorius, H., Schlosser, C., Stöhlker, U., Conen, F., and Zahorowski, W.: Comparison of one- and two-filter detectors for atmospheric222Rn measurements under various meteorological conditions, Atmos. Meas. Tech., 3, 723–731, doi:10.5194/amt-3-723-2010, 2010.