HOW CHILDREN PERCEIVE AND UNDERSTAND THE FACIAL EXPRESSION OF FACE PAIN RATING SCALE
Fang-Suey Lin1, Ching-Yi Lin2, Chun-Yi Lee3, Chun-Pei Hsieh2 1
Visual Communication Design, National Yunlin University of Science and Technologyi, Yunlin, Taiwan
2
Graduate School of Design, National Yunlin University of Science and Technologyi, Yunlin, Taiwan 3
Pediatrics of Chang Bing Show Chwan Memorial Hospital, Changhua, Taiwan
Abstract
People have different feelings toward pain, and their expressions to medical personnel and caregivers are also different. Children can use appropriate pain rating scales according to their cognitive development to express their subjective feelings about pain. This study investigated children’s reactions to the Pain Scale, and improved the icons for a pain rating scale that is suitable for children, in order to facilitate positive doctor-patient communication.
30 children aged 4-6 as subjects, by one to one interview method; they were asked if they could easily comprehend pain shown by facial expression on the Face Rating Scale and the Oucher Scale. Based on this survey result, we developed a Face Pain Rating Scale, 30 children aged 4-7 were invited to indicate the ranking of intensity of pain. 67% of children can precisely indicate ranking of 6 facial expressions, when facial expressions are more distinctive, they can indicate different degrees of pain.
Key words: Child, Pain Rating Scale, communication
1. INTRODUCTION
Pain is a very abstract and subjective feeling. As the feeling of the intensity of pain may vary from person to person, different messages might be sent to medical personnel and caregivers. Assessing pediatric patients’ pain, centers on establishing a communication channel between pediatric patients, their families, and medical personnel. At present, descriptive words, which are the direct translation of foreign terms used for describing characteristics of pain, are not suitable for domestic use considering that the description of pain is significantly subject to cultural influence, which results in different expressions of pain in different cultures. Some relevant research has pointed out differences between adult patients’ self-reported intensity of pain and the intensity of pain assessed by medical personnel. In comparison with an adult patient’s self-reported intensity of pain, the adult patient’s intensity of pain assessed by medical personnel is usually lower (CEUs), and the divergence might be even wider when it comes to children who are less articulate in expressing themselves. As children’s cognitive and behavioral abilities are still under development, medical personnel usually must relay pediatric patients’ physical discomfort or pain. When facing pediatric patients with difficulty expressing themselves due to their limited language ability or restless pediatric patients who cannot stop crying, determining whether it is because those pediatric patients are throwing a tantrum or suffering from physical pain calls for the accurate assessment of pain so that further measures can be taken to relieve those pediatric patients’ pain.
Children’s self-report of pain intensity provides multifaceted information, which includes characteristics of the senses and emotional components, along with other cognitive, behavioral, and emotional factors. Methods for getting data for a self-report of pain intensity include the pain-rating index, questionnaires, and interviews. As such, when it comes to deriving the pain-rating index, practical and easy-to-use pain management tools that are appropriate for children’s age and cognitive ability should be adopted (Liebelt, 2000).
The objectives of this study are as follows: (1) Look into children’s comprehension of facial
expression “images” and “pictures”. (2) Compare children’s perceived intensity of pain when thveey look at illustrations on the Face rating scales and the Oucher Scale. (3) Find out factors and sources of pain through analyzing children’s experiences of pain, thereby improving pain rating scales for children, enhancing medical communication, and further developing appropriate textual-graphical communication designs. (4) To provide a reference for visual designs for medical communication purposes in the future. This study investigated children’s reactions to the Pain Scale, and improved the icons for a pain rating scale that is suitable for children, in order to facilitate positive doctor-patient communication.
2. RELATIVE LITERATURE SURVEY
Children’s pain varies in accordance with environmental factors, personal factors, and factors in relation to growing up. These factors include children’s mental and emotional state, behaviors, characters, cultural backgrounds, as well as the cultural background of children’s parents. For older children, the attitude of parents and peers has a huge impact on those children’s self-reports of pain. By observing their parents’ attitude, children grow to learn people’s behaviors while in pain. Meanwhile, children also grow aware of certain manners that adults expect them to act on in certain situations. Such expectation often makes an impact on children’s behaviors and responses to pain or ways to cover up their pain (McGrath, 1987).
The best way to look into children’s intensity of pain or feelings of pain is to allow children to express their pain themselves or adopt well-developed scales that have both good reliability and validity in Taiwan. In addition, measuring children’s intensity of pain is better accompanied with assessing the location of pain in order to accurately confirm which part on the body causes the children’s physical discomfort (Cheng, 2004). When being asked about their preferred pain rating scales, children answered that the face rating scale is their favorite (Wu & Chen, 2002).
Despite an abundance of pain management tools and pain scales nowadays, asking children to describe their experience of pain with their limited language ability and to compare different pain rating scales and pain management tools appears not easy. Further consideration must be given to children’s background, children’s family members’ pain management, and children’s parents’ attitude as these factors might be the primary decision-makers for children’s self-reported intensity of pain. As such, it is necessary to reinforce parents and children’s ability of pain management as well as review and improve communication media for the provision of heath care (R. L. Foster & Varni, 2002).
Pain rating scales appropriate for children’s cognitive development and ability can be used for children’s expression of their subjective feeling of pain. A few developed and verified pain measurement methods are listed below:
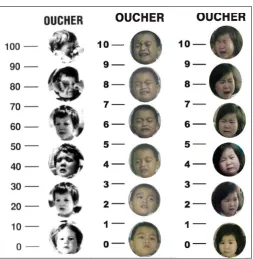
(1) Face rating scale (Fig1): six cartoon faces with facial expressions from smiling to crying from left to right are used to represent children’s different intensity of pain (Wong & Baker, 1988). (2) Oucher Scale (Fig2): Six pictures of children in pain and with different facial expressions accompanied with a 0 to 100 scale from the bottom to the top are used to present gradual scale from no pain to the worst pain. Apart from facial expressions of white children, black children, and Hispanic children on the Oucher scale, there is also an Asian adaption of the Oucher scale, which is modified from the one-hundred-point pain rating scale to a ten-point rating scale (Yeh, 2005). (3) Visual Analogue Scale (Fig3): A 100mm straight line with a crying face on the left end and a happy face on the right end is used. Pediatric patients are given the explanation that the 0mm on the left end represents no pain and the 100 mm on the right end represents the worst pain. These pediatric patients are subsequently invited to mark or point out the intensity of pain they feel on the scale (Merkel, 2000). (4) Numerical scale (Fig4): A 10 cm straight line which is marked from 0 to 10 with a 1 cm interval between each score is used. The score 0 represents no pain and the score 10 represents the worst pain (McCaffrey & Beebe, 1989). (5) Poker chips tool (Fig5): Four poker chips are used. Under the rule that one poker chip represents a slight pain and four poker chips represent an unbearable pain, pediatric patients are asked about how many poker chips can represent their pain at that moment. (Hester & Barcus, 1986).
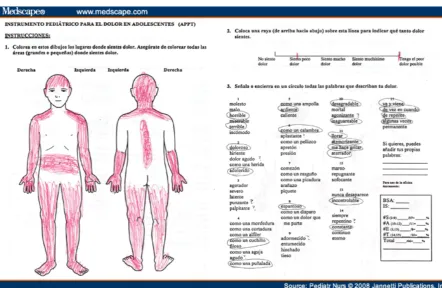
(6) Color scale (Fig6): this tool involves using a contour of a child’s body on a piece of paper and colors that represent pain. Children are asked to choose a colorful pen to highlight the body parts where they feel pain on the paper-based contour (Eland & Anderson, 1977). (7) Word graphic rating scale (Fig7): The method involves assigning numerical numbers from 1 to 10 to descriptors of the intensity of pain, asking children to choose the most appropriate descriptors for their feeling of pain at that particular moment, which include: no pain, little pain, medium pain, large pain, and the worst possible pain. Also, children are asked to point a numerical number which shows how much pain they feel. The numerical numbers from 1 to 3 indicate mild pain, 4 to 6 indicate medium pain, and 7-10 indicate severe pain (Jacob & Puntillo, 1999). (8) Adolescent Pediatric Pain Tool (Fig8): The tool, which involves using a double-sided paper and pencils, is a five-point scale for pediatric and adolescent patients aged between 8 and 17 to self-report the intensity of the pain they perceive (Jacob, Mack, Savedra, Van Cleve, & Wilkie, 2013). The scale can be divided into the location of pain (a) the marked location of pain on a contour drawing of a person on a piece of paper and the self-reported intensity of pain (Savedra, Tesler, Holzemer, Wilkie, & Ward, 1989); (b) the Word-Graphic Rating Scale, which involves using a 10 cm line to measure the intensity of pain, and descriptors from the left to the right of the line are no pain, little pain, medium pain, large pain, and the worst possible pain (Tesler et al., 1991); (c) the resulting score of the described intensity of pain in line with feelings, emotions, and the rating scale (Savedra et al., 1993); (d) producing a one-hundred point subscale (Savedra et al., 1995) based on the self-reported scores and a total score of pain; the total score on a one-hundred point scale (Wilkie et al., 1990 ).
Fig 1. Wong-Baker FACES Pain Rating Scale (Liebelt, 2000)
Fig 2. Oucher Scale: Left is U.S. version ( Liebelt, 2000);Middle is Taiwan version of the boys,Right is Taiwan version of the girls ( Yeh, 2005)
Fig 3. Visual Analogue Scale ;VAS (Kujala, 1948)
Fig 4. Numerical scale(Kujala, 1948)
Fig 5. Poker chips tool (Utah)
Fig 6. Color scale (Utah)
Fig 7. Word graphic rating scale (CEUs)
Fig 8. Adolescent Pediatric Pain Tool; APPT (Medscape)
According to the Cognitive-Developmental Theory proposed by Piaget (1896-1980), children’s experiences in the environment along with children’s cognitive processes and schema at the time when experiences happen to them will change in terms of quantity and quality in line with children’s growth. As the mind of a three-year old and the mind of a seven-year old might work differently, the cognition of an elementary school student and the cognition of a junior high school student may differ (Chang, 1996). Therefore, when facing children’s different expressions about their pain due to their age difference, caregivers should provide due alleviation of pain based on different circumstances. Little children’s message reception is apparently subject to the influence of little children’s prior concepts and knowledge. Given little children’s limited ability to make a good judgment, short attention span, short-term memory, and cognitive reasoning that is unable to consider an incident’s cause-effect relationship, it is not easy for children to exercise logical thinking to have a comprehensive understanding of how and why an incident happens. Picture books, comic books, and 3D books which are dominated by visual narratives are preferred by children aged between 5 or 6, who pay attention to verbal and visual narratives when they read a book (Lin, 2009). Visual information is human beings’ largest source of information as all objects that we see in our lives can be perceived in the form of visual images. As an actual object’s symbolic visual image bears a striking resemblance to the actual object, visual images can provide a shortcut for learning and well as serve as ideal media in little children’s early phase of visual experiences due to little children’s limited vocabulary. In terms of cognitive learning, visual images are the most direct and solid method to convey messages, the optimal knowledge structure to facilitate little children’s learning (Wen, 2007), as well as a fundamental psychological tool for little children to develop high-order thinking (psychological tools) (Vygotsky, 1962). In addition, in line with little children’s cognitive development (Greenfield & Bruner, 1966), visual images can enhance little children’s cognitive ability and understanding of messages (Cassata & French, 2006), thus suitable for serving as communication media with little children in medical communication.
Visual designs can induce scenario-based learning and designs that appeal to emotions are conducive for the process of cognition and learning. According to studies, a scenario supplemented by cartoon images can reinforce emotions such as excitement, enthusiasm, and determination. In addition, designs that appeal to emotions are favorable for inspiration and one’s hobbies. Inner emotions that are triggered due to individuals’ different state of mind and mode of feeling may affect the understanding and communication of messages. Among elements of design, shapes and colors provide effective and emotionally functional support for learners (Plass, Heidig, Hayward, Homer, & Um, 2014). Solid visual images accompanied by abstract terms appear to be effective media. In terms of choosing font colors and ensuring legible fonts against the backdrop, colors with fairly high saturation should be avoided to reduce viewers’ eye strain (Hsu & Li, 2005).
In order to meet a new standard of pain management and provide patients the best results of treatment, medical personnel have to make effective assessment and measurement of children’s pain (Foster & Varni, 2002). Information design, which involves triggering learners’ attention and awareness and enhancing learners’ memory, retrieval, and comprehension (Seels & Richey, 1994), is an planned activity which manipulates the concrete form of information (Haag & Grabowski, 1995), a problem-solving process, and involving textual and graphic elements arising from communication (Kuzmich, 1993). Relevant studies have suggested that “graphic advanced organizers” assist learners to pay attention to certain messages (Lagerwerf, Cornelis, de Geus, & Jansen, 2008). As an effective learning tool for preschoolers, concept mapping involves connecting visual images with concepts, enables children to organize thoughts during the course of learning, and are thus suitable for young children’s learning (Gallenstein, 2005). Concept mapping can effectively enhance young children’s comprehension of a story, better their cognitive abilities (Stice & Alvarez, 1987), assist young children to have a quick grasp of the purposes of learning and clarify concepts, help arrange themes of teaching, conduce to children’s meaningful learning (Gallenstein, 2005; Stice & Alvarez, 1987), and assist children to understand and associate events, the chronological order of events, and the association of events. There are restrictions to the selection of images as the selected images have to be comprehensible for readers, linked to readers’ life experiences, easy for the transfer of learning, and presented in a form appropriate for theme-based communication.
3. THE COMPREHENSIVE SURVEY OF THE FACE RATING SCALE AND THE OUCHER SCALE
3.1 Research subjects and the sampling
In this study, 30 children aged between 4 to 6 years old were selected as research participants, which consisted of 16 (53.3%) boys and 14 (46.7%) girls. The Face rating scale (Sample A) as shown in Figure 9 and the Oucher Scale (sample B) were chosen as the pain rating scales of this study. Meanwhile, a researcher was assigned to observe a child for a certain period of time, take 60 photos of this child, select 12 photos with different facial expressions out of the 60 photos, and question five other children aged between 4-6 years old about whether they were able to distinguish what happened to the child in the photos based on the child’s facial expressions. Based on these children’s answers, six photos were selected from the 12 photos, and the background of the six photos was erased so that the research participants could focus their attention on the facial expressions of the child in the photos (Figure 10 ).
Fig 9. (A) Model of Face rating scale ( Zheng Zhou City Orthopedic Hospital official website)
Fig 10. (B) Image of Oucher Scale
3. 2 Research Method and Procedures
Considering children’s speech and language development, ability to express themselves, and comprehension of general matters, and in an attempt to preclude impact from the attitude of teachers, other adults, or children’s peers, each child was interviewed on a one-to-one basis. The researcher popped out questions and provided samples, which assisted children participating in this study to understand the questionnaire’s content. The details procedures of the interviews are as follows: Step 1: Displaying cartoon faces of the Face rating scale (Sample A) and ask the children, “Can you tell me what each cartoon face expression in the photos says to you? Do you know what might have happened to each cartoon face in the pictures? ”
Step 2: Displaying pictures of the Oucher Scale (Sample B) and ask the children, “Can you tell me what the face expressions of the child in the photo says to you? Do you know what might have happened to the child in the pictures? ” As revealed by the pre-test, children’s responses showed a gradual increase in their perceived happiness from the child in the pictures. For example, children looking at photos 1 to 4 exclaimed that the child in the photos was “not happy”, “a little happy”, “very happy”, and “extremely happy’. To preclude children from answering the questions based on their memory from the previous picture, the pictures presented to children in Step 1 and Step 2 were in a random order in a formal survey. When the survey was in progress, being patient while awaiting children’s answers was important, and children should not be forced to distinguish all facial expressions and answer all questions.
Step 3: 12 pictures with different facial expressions from Sample (A) and Sample (B) were displayed in front of children at the same time to ask children which facial expressions appeared painful. Children were allowed to select multiple pictures. Under the circumstances that two or more pictures were selected, the children were asked to compare which facial expression in those selected pictures looked the most painful.
Step 4: All pictures were taken away and children were asked, “How would you express yourself when you are in extreme pain yet no adults next to you could understand how much pain you feel” Alternatively, do you have any experiences of suffering from extreme pain?” In a situation where children had difficulties understanding the question, the researchers may provide assistance to retrieve the children’s memory. For example, the researchers could ask hint questions such as “Have you ever had physical injuries and bloodletting experiences? If so, why did you get injured?” Another alternative question was, “When did you experience pain and what happened?” Once the children gave specific incidents that led to the bloodletting experiences, the researchers could proceed to ask, “Which part of your body was involved? How would you describe this pain and how painful was it?” 3.3 Results and Discussion
Data obtained from the survey results were analyzed with the computer software package SPSS Statistics 17.0, which used descriptive statistics to describe children’s comprehension of “cartoon illustrations” and “photos” of facial expressions, verbal protocol analysis to investigate children’s verbal reports of their experiences of physical pain, and differential analysis to look into children’s perceived intensity of pain from images shown in the Face rating scale and the Oucher Scale. Results from Step 1 and Step 2 were further coded, categorized and presented in terms of frequency and percentage in a one-hundred-point scale(Table 1~6).
Table 1. Children’s comprehension of cartoon illustrations and photos of facial expressions
Frequency Percent (%)
No.1 No.7 No.1 No.7 No.1
Not answer 6 20.0
Cry 4 2 13.3 6.7
Not cry 3 10.0
Happy 17 7 56.7 23.3
Unhappy 4 13.3
Laugh 9 1 30.0 3.3 No.7
Watching 4 13.3
Daze 1 3.3
Sleepy 1 3.3
A stomachache 1 3.3
Total 30 30 100 100
Table 2. Children’s comprehension of cartoon illustrations and photos of facial expressions
Frequency Percent (%) No.2
No.2 No.8 No.2 No.8
Not answer 3 9 10.0 30.0
Sleepy 17 56.7
Pouting 1 3.3
Tired 4 13.3
slow-witted 1 3.3.
Sick 1 3.3. No.8
Unhappy 1 3 3.3. 10.0
Angry 1 2 3.3. 6.7
Weird mouth 1 3.3.
Cry 7 23.3
Sad 1 3.3
Nervous 1 3.3
Pain 1 3.3
A little happy 1 3.3
Laugh 1 3.3
Think 1 3.3
Daze 1 3.3
Not cry 1 3.3
Feeling others are
nauseating 1 3.3
Total 30 30 100 100
Table 3. Children’s comprehension of cartoon illustrations and photos of facial expressions
Frequency Percent (%) No.3
No.3 No.9 No.3 No.9
Not answer 4 8 13.3 26.7
Scared 3 10.0
Wry face 2 6.7
Cross-eye 1 3.3
Cry 10 10 33.3 33.3
Sadness 3 1 10.0 3.3 No.9
Nervous 1 3.3
Shout crying 1 3.3
Fear of acid 1 3.3
Unhappy 1 1 3.3 3.3
Strange expression 2 6.7
Greedy 1 3.3
Not cry 1 3.3
Angry 3 10.0
stomachache 2 6.7
Almost cried 4 13.3
Total 30 30 100 100
Table 4. Children’s comprehension of cartoon illustrations and photos of facial expressions
Frequency Percent (%)
No.4 No.1 0
No.4 No.1 0
No.4
Not answer 2 4 6.7 13.3
Angry 22 73.3
Unhappy 1 3.3
Wry face 1 3.3
Pain 1 3.3
Think others
Strange 1 3.3
Curse 1 3.3
Crooked eye 1 3.3 No.10
Cry 20 66.7
sorrow 4 13.3
Tears 1 3.3
Painful of
injections 1 3.3
Total 30 30 100 100
Table 5. Children’s comprehension of cartoon illustrations and photos of facial expressions
Frequency Percent (%)
No.5 No.1 1
No5 No.1 1
No.5
Not answer 2 3 6.7.0 10.0
Cry 21 13 70.0 43.3
Tears 6 3 20.0 10.0
Sad 1 1 3.3 3.3
Uncomfortable 1 3.3
Hair into the eyes
1 3.3 No.11
Sharp teeth 1 3.3
Angry 2 6.7
Cry loudly 2 6.7
Almost cried 1 3.3
Moving 1 3.3
Getting lost
from parents 1 3.3
Total 30 30 100 100
Table 6. Children’s comprehension of cartoon illustrations and photos of facial expressions
Frequency Percent (%) No.6
No.6 No.1 2
No.6 No.1 2
Not answer 2 2 6.7 6.7
Eat people 2 6.7
Cry 6 16 10.0 53.3
Angry 3 1 20.0 3.3
Yawn 1 3.3
Shout 12 5 40.0 16.7
No.12
Decayed tooth 1 3.3
Shouted headache
1 3.3
Open mouth 1 1 3.3 3.3 Crying loudly 1 2 3.3 6.7
Unhappy 1 3.3
Being scolded 1 3.3
A stomachache 1 3.3
Total 30 30 100 100
The six cartoon illustrations of facial expressions in the Face rating scale (Sample A) was coded 1 to 6 in the order of “no pain” to “the worst pain”. Likewise, the six photos of facial expressions in the Oucher Scale (Sample B) were coded 7 to 12. In terms of the scoring system of procedures, a 0 to 2 score was assigned to each illustration and photo according to each child’s perceived intensity of pain. The score of 2 was given to photos and illustrations which were perceived to convey “the worst pain”, the score of 1 was given to the photos and illustrations which were perceived to convey “pain”, and the score 0 was given to remaining photos and illustrations (Table 7~8).
Table 7. Child’s perceived intensity of pain
Number 1 2 3 4 5 6
Frequency
Worst pain 0 0 0 2 3 15
Pain 0 0 1 1 3 7
Total 0 0 1 5 9 17
Table 8. Child’s perceived intensity of pain
Number 7 8 9 10 11 12
Frequency
Worst pain 0 0 0 1 6 12
Pain 0 1 1 5 5 2
Total 0 1 1 7 17 26
3.3.1 Children’s comprehension of each image in the Face rating scale and the Oucher Scale
As revealed in Table 7~8, the cartoon illustrations in the Face rating scale conveyed more accurate emotions whereas ill-designed illustrations were likely to cause misunderstanding. For example, 17 children (56.1%) were under the impression that the facial expression in No.2 meant “feeling sleepy”; there were 12 different answers to No.3, which easily led to children’s various imagination; 22 children (73.3%) thought the facial expression in No.4 meant “feeling angry”; 12 children (40%) thought the facial expression in Photo 6 meant “shouting out loudly’. In terms of children’s answers to the Oucher Scale photos, there were more diversified answers to No. 7 and No. 8 and more similar answers to No. 9 to No. 12, indicating that children were are more insensitive to subtle difference in facial expressions yet more responsive toward exaggerated facial expressions.
3.3.2. Children’s perception of pain conveyed by image in the Face rating scale and the Oucher Scale
A child looking at the 12 photos at the same time felt that Photo 12 conveyed the worst pain, which was followed by Photo 11 and Photo 6, meaning that the facial expressions of a child in Photo 12 and Photo 11 in the Oucher Scale did the best job is conveying the intensity of pain to these child research participants. Meanwhile, compared with the Face rating scale, children showed better comprehension of the intensity of pain demonstrated by the Oucher Scale. In addition, children had more acute perception of the Oucher Scale photos, which contained more exaggerated facial expressions. When choosing photos that expressed pain, children chose more photos from the Oucher Scale than photos from the Face rating scale. In compassion with “cartoon illustrations”, “photos” of facial expressions with more subtle details were more likely for children to associate them with the feeling of pain. For example, a “crying” facial expression was more likely to make children connect the photo with pain.
3.3.3 Children’s experiences of pain
Survey results of children’s experiences of pain were coded after the verbal protocol analysis was conducted, which generated 35 variables. The 35 variables were categorized according to the following classification methods: various types of discomfort as a result of sickness, “accidental” injuries during activities, “punishments” imposed by parents and caregivers on children, “anxiety” arising from experiences of visiting a dentist, the feeling of pain resulting from constantly scratching some “itchy” body parts, and “other factors”. As such, reasons that caused pain were classified into the six categories: accidents, sickness, punishments, itchiness, toothache, and others (Fig 11). As revealed by Figure 11, children’s experiences of pain largely came from sickness (31%) and accidents (27%). Pain resulting from sickness included needle shots (35%), stomachache (30%), a sore throat (14%), headache (11%), mouth ulcers (5%), and nasal discomfort (5%).
Fig 11. Pain factors
Pain associated with sick (figure 12) included given an injection (35%), stomach pain (30%), sore throat (14%), headache (11%), mouth ulcers (5%) and nose uncomfortable(5%).
Fig 12. Pain associated of sick
Accidental physical injuries (figure 13) included falling (35%), foot injury (22%), bumping one’s head (16%), hand injury (6%), mouth injury (6%), falling down stairs (6%), a hit on the jaw (3%), buttock pain (3%), and sting or stab wounds.
Accident
27%
Sick
31%
Itch
4%
Punish
16%
Tooth
pain
6%
Others
15%
Omission
1%
Pain factors
Mouth
ulcers
5%
Sore throat
14%
Headache
11%
Nose uncomfortable5%
Give an
injection
35%
Abdominal
pain
30%
Sick
Fig 13. Pain associated of accident
Physical pain resulting from punishments (figure14) included foot pain (5%), hand pain (21%), buttock pain (16%), and baton beating as a form of punishments (16%). Experiences of toothache (figure15) included pain caused by tooth decay (72%), visiting a dentist and receiving local anesthetic injections (14%), and tooth loss (14%).
Fig 14. Pain associated of punish
Fig 15. Pain associated of tooth
Butt pain
3%
Bumped
chin
3%
Mouth
injury
6%
Bumped
head
15%
Fell down
from the
stairs
6%
Foot injury
24%
Hand injury
6%
Fall
33%
Stabbed
3%
Accident
Foot pain
6%
Butt pain
19%
Hand
pain
25%
Use a
stick
50%
Punish
42%
Punish
Playing
anesthetic
14%
Teeth out
14%
Teeth out
10%
Tooth pain
Pain resulting from body itchiness (figure16) included blooding due to scratching the itchy area of mosquito bites (20%), constant rubbing the eyes due to itchiness (20%), a bleeding nose resulting from constantly poking the itchy nose (20%), the itchy buttock for hygienic reasons (20%), and eye allergies (20%). Other factors (figure17) which contributed to the experiences of pain included being a victim of maltreatment (23%), describing the location and intensity of pain (29%), fantasized pain as a result of media information influence (18%), learning from other people’s experiences of pain (6%), bleeding resulting from nails and cuticle picking (6%), irritated eyes (6%), pain resulting from excessive eyes gum (6%), and discomfort from wearing clothes which are too small (6%).
Fig 16. Pain associated of itch
Fig 17. Pain associated of other
Grazed and
irritated skin
due to
scratching the
itchy parts of
mosquito bites
20%
Pain resulting
from
constantly
picking one’s
itchy nose
20%
Pain resulting
from rubbing
one’ s itchy
eyes
20%
The butt feels
itchy for not
being wiped
clean
20%
Itchy eyes due
to allergy
20%
Itch
Learning
from other
people’s
experiences
of pain
5%
Being
mistreated
22%
Describing the
location and
intensity of
pain
28%
Bleeding from
nails and
cuticle picking
5%
Fantasized
pain as a
result of
media
information
influence
17%
Irritated
eyes
5%
Clothes are
too small
6%
The feeling of
pain resulting
from excessive
eyes gum
6%
Malfunctioning
neck muscles
due to neck
sprains
6%
Other
While expressing themselves with languages, children aged between 4 to 6 years old could only state their key memory. The key of inquiring children about their experiences of pain is having a good grasp of details in children’s short-term memory, taking notes while conducting the interviews, and inquiring children for more details. For example, in response to a child’s answer that his/her nose hurts, the interviewer may ask, “Why did it hurt? Did you get hit in the nose?” The questions might be followed by the child’s answers that contain information in relation to these symptoms such as “seeing a doctor” or “having a running nose”, thereby learning that the child’s discomfort arose from sickness. Children tend to have difficulty in distinguishing the difference between “pain”, “discomfort”, and “itchiness”. When encountering a child’s possible answer, “My reddish eyes hurt”, the interviewer had to proceed to confirm with the child why his eyes hurt. When encountering a child’s possible answers such as “my eyes were itchy, and it hurt when I kept rubbing them” or “the mosquito bites hurt”, the interviewer who asked further questions might learn that it was because children kept scratching areas of mosquito bites, which made wounded areas, become painful. Children should be encouraged and allowed to express themselves during the interviews, which might yield different amount of answers from different children. Some children’s knowledge of pain came from the emotions conveyed by television programs, some children’ cognition of pain was developed by observing other people’s pain of injuries at some incidents, and some children might have fantasized pain through looking at visual images. For example, despite having neither experience of being eaten by a dinosaur nor getting an electric shock, a few children were able to give a clear statement of the location and intensity of such fantasized pain on their bodies.
4. CHILDREN’S COMPREHENSIVE THE FACE PAIN RATING SCALE SURVEY 4.1 Select samples for the research
1. Based on results of the first stage research and referring to graphic designs of Wong-Baker FACES Pain Rating Scale and the face rating scale on the official website of Zheng Zhou City Orthopedic Hospital, we designed a face pain rating scale consisting of six facial expression icons which are more realistic and showing a clearer contrast (figure 18).
0 1 2 3 4 5
Fig 18. Face rating scale
2. Each facial expression, which was printed out by using a color laser printer, was mounted on a 10 x 12 cm card stock. An A3 paper with 6 table cells for the test of pain, the number of dots was proportional to the intensity of pain (figure 19).
Fig 19. Table cells for the test of pain
4.2 Subjects and procedure
A total of 30 children aged between four and seven years old were chosen as test participants. In order to prevent children from the influence of other children and teachers’ attitudes, the survey by questionnaire was conducted individually. The researchers asked questions and gave research samples to help children understand the questionnaire’s content. Being instructed to place facial expression icons into the corresponding blank table cells according to the intensity of pain, children were advised that the purple dots in the table cells represent the intensity of pain, the table cells without any dots meant no pain at all, the range of one to five dots meant the intensity of pain, and the number of dots was proportional to the intensity of pain. While mentioning about the different quantities of dots, the researcher had to point out the location of the table cells. After children had an accurate understanding of the meaning represented by the dots, the researcher took out the six facial expression icons and placed them arbitrarily in front of the children, and instructed the children to place the facial expression icons into the appropriate cell. (figure 20)
Fig 20
4.3 Results and Discussion
Children who participated in the test were divided into two groups according to their ages. Group A consisted of 15 children aged between five years old seven months and seven years old were and Group B consisted of 15 children aged between four years old and five years old six months. After the children placed the facial expression icons in order according to the intensity of pain, the results (see Table 9-11) indicated that twenty out of the 30 children (67%) successfully placed the six facial expression icons in the correct order. These 20 children consisted of 14 children in Group A and 6 children in Group B, indicating that older children could more accurately understand the six facial expression icons. Except for one child who couldn’t differentiate No. 4 facial expression icon from No.5 facial expression icon, all other Group A children had the correct answer for all facial expression
icons. Group B children had more trouble understanding No. 1 and No.3 facial expression icons with seven children getting the wrong answers.
Table 9 Children’s understanding of the facial expression of pain (N=30)
Pain scale
Cording 0 1 2 3 4 5
Incorrect
N(%) 1 (3.3) 7 (23.3) 6 (20) 7 (23.3) 5 (16.7) 2 (6.7) * Twenty children answered the six facial expression icons correctly(67%)
Table 10 Group A Children’s understanding of the facial expression of pain (N=15)
Cording 0 1 2 3 4 5
1. 0 1 2 3 4 5
2. 0 1 2 3 4 5
3. 0 1 2 3 4 5
4. 0 1 2 3 4 5
5. 0 1 2 3 4 5
6. 0 1 2 3 4 5
7. 0 1 2 3 4 5
8. 0 1 2 3 4 5
9. 0 1 2 3 4 5
10. 0 1 2 3 4 5
11. 0 1 2 3 5 4
12. 0 1 2 3 4 5
13. 0 1 2 3 4 5
14. 0 1 2 3 4 5
15. 0 1 2 3 4 5
Incorrect(N) 0 0 0 0 1 1
*Fourteen children answered the six facial expression icons correctly
Table 11 Group B Children’s comprehensive of the intensity of pain ( N=15)
Cording 0 1 2 3 4 5
1. 0 3 4 5 2 1
2. 0 1 2 3 4 5
3. 0 1 2 3 4 5
4. 0 2 1 4 3 5
5. 0 2 1 3 4 5
6. 0 1 2 3 4 5
7. 0 2 3 1 4 5
8. 0 1 2 3 4 5
9. 3 0 2 1 4 5
10. 0 2 3 1 4 5
11. 0 1 3 2 4 5
12. 0 1 2 4 3 5
13. 0 1 2 3 4 5
14. 0 1 2 3 4 5
15. 0 4 2 3 1 5
Incorrect(N) 1 7 6 7 4 1
* Six children answered the six facial expression icons correctly
The observation of children’s arrangement of the facial expression icons revealed that most children preferred to place No. 0 and No. 5 facial expression icons in order first, which indicated that it was easier for children to understand facial expression icons with bigger variations. Sometimes picking up one incorrect facial expression icon resulted in successive incorrect answers.
5. CONCLUSIONS
This study found that when presented with facial expressions of the two pain rating scales, the Face rating scale and the Oucher Scale, children could more accurately describe the pain conveyed by the facial expressions of the cartoon illustrations in the Face rating scale. However, ill-designed illustrations were likely to lead to misunderstanding. In terms of the Oucher Scale, children were more unlikely to understand facial expressions with slight difference. On the contrary, more dramatic facial expressions were better at sending out messages of pain. In both pain rating scales, a crying facial expression was likely to make children associate it with pain. Children’s experiences of pain mostly resulted from experiences of sickness and accidents such as stomachache, headache, or a sore throat due to sickness, or the pain of needle shots from visiting a doctor. Accidental injuries also happened a lot to children at this phase and resulted in experiences of pain due to getting injury from falling or getting hit by hard objects.
According the results of comprehensive survey, facial expressions of cartoon illustrations could convey more accurate emotions yet there were still several images which were not easily associated with pain. Facial expressions shown in photos could convey stronger feelings of pain. On the contrary, subtle changes in facial expressions appeared not easy for children to discern.
The facial expression icons of face pain rating scale designed by this study are appropriate and
comprehensible for most children. Restricted by children’s developing language ability, proper guidance had to be provided occasionally and patience was essential when awaiting for children’s answers. Due to time constraint and limited human resources for this study, only a relatively small number of samples were collected and this study was merely an interim analysis to generate results that can be used to design subsequent studies. Meanwhile, future researchers can collect data pertaining to medical institutions, patients, and caregivers at medical facilities, thereby producing a reference for improving communication between patients and medical personnel.
ACKNOWLEDGMENTS
The authors would like to express their thanks to the National Science Council, Taiwan, R.O.C., who have sponsored the research presented in this paper under Grant NSC 103-2410-H-224-025; all Green Sunshine kindergarten teachers who offered support and all children who participated in the interviews.
REFERENCES
CEUs, H. (http://www.homesteadschools.com/nursing/courses/ManagementCancerPain/toc.html). Management cancer of pain. Retrieved 12.5, 2013
Cheng-Mei Hsu, Chang-Franu Lee. (2005). Research electronic storybooks and children's preferences: Human factors design point: Digital Learning Design and Management Symposium.
Chun-Hsing Chang. (1996). Educational Psychology: Three of the theory and practice-oriented: Taiwan Donghua.
Eland, J. M., & Anderson, J. E. (1977). The experience of pain in children. Pain: A sourcebook for nurses and other health professionals, 453-473.
Eric L. Liebelt, M. B., MARYLAND. (2000). Assessing Children's Pain in the emergency department. McCaffrey, M., & Beebe, A. (1989). Pain Clinical Manual for Nursing Practice, Mosby, St. Louis, MO.
Fang-Ching Lin (2009). Children's Reading Behavioral Response towards Illustrated Science Curricula. Journal of Health Care Technology, 11(1), 30-46.
Foster, R. L., & Varni, J. W. (2002). Measuring the quality of children's postoperative pain management: Initial validation of the child/parent Total Quality Pain Management (TQPM™) instruments. Journal of pain and symptom management, 23(3), 201-210.
Gallenstein, N. L. (2005). Never Too Young for a Concept Map. Science and Children, 43(1), 44-47. Stice, C. F., & Alvarez, M. C. (1987). Hierarchical concept mapping in the early grades. Childhood Education, 64(2), 86-96.
Greenfield, P. M., & Bruner, J. S. (1966). Culture and cognitive growth. International Journal of Psychology, 1(2), 89-107.
Haag, B. B., & Grabowski, B. L. (1995). The Design of CD-I: Incorporating Instructional Design Principles. Educational Technology, 35(2), 36-39.
Hester, N., & Barcus, C. (1986). Assessment and management of pain in children. Pediatr Nurs Update, 1(2).
Hsin-Chuan Wu, Hsiu-Jung Chen (2002). Comparison of Scales Assessing Post-Operative Pain in Children. Tzu Chi Medical Journal, 14(5), 311 – 315.
Su-Fen Cheng. (2004). A Review of Children's Pain Assessment and Management. Journal of Nursing, 20-24. doi: 10.6224/jn.51.6.20
Jacob, E., Mack, A. K., Savedra, M., Van Cleve, L., & Wilkie, D. J. (2013). Adolescent Pediatric Pain Tool for Multidimensional Measurement of Pain in Children and Adolescents. Pain Manag Nurs. doi: 10.1016/j.pmn.2013.03.002
Jacob, E., & Puntillo, K. A. (1999). A survey of nursing practice in the assessment and management of pain in children. Pediatric nursing, 25(3), 278-286.
Kujala, K. (1948). Faktorer som inverkar på djupstabiliserade jordars mekaniska egenskaper.
Cassata, A. E., & French, L. (2006). Using concept mapping to facilitate metacognitive control in preschool children.
Kuzmich, C. J. (1993). Integrating Instructional, Graphical, and Message Design.
Lagerwerf, L., Cornelis, L., de Geus, J., & Jansen, P. (2008). Advance Organizers in Advisory Reports Selective Reading, Recall, and Perception. Written Communication, 25(1), 53-75.
McGrath, P. A. (1987). An assessment of children's pain: a review of behavioral, physiological and direct scaling techniques. Pain, 31(2), 147-176.
Medscape. (http://img.medscape.com/fullsize/migrated/572/919/pn572919.fig3.gif). Retrieved 12.5, 2013
Merkel, S., & Malviya, S. (2000). Pediatric Pain, Tools, and assessment. Journal of PeriAnesthesia Nursing, 15(6), 408-414.
Plass, J. L., Heidig, S., Hayward, E. O., Homer, B. D., & Um, E. (2014). Emotional design in multimedia learning: Effects of shape and color on affect and learning. Learning and Instruction, 29, 128-140. doi: 10.1016/j.learninstruc.2013.02.006
Sai-Chung Wen. (2007). Introduction to Psychology: San MinBookstore Co., Ltd..
Seels, B., & Richey, R. (1994). Instructional technology: The definition and domains of the field: Association for Educational Communications and Technology Washington, DC.
Tzu-Min Hung. (2010). A Brief Discussion on Howto Present the Elements of Roles with Fear Emotion in the Picture Books. Nanhua University Journal of Aesthetics and Visual Arts, 2.
Utah, P. r. c. a. u. o. (http://painresearch.utah.edu/cancerpain/ch14f1.gif). The Hypermedia Assistant for Cancer Pain Management. Retrieved 12.5, 2013
Vygotsky, L. (1962). The Development of Scientific Concepts in Childhood.
Wong, D. L., & Baker, C. (1988). Pain in children: comparison of assessment scales. Pediatr Nurs, 14(1), 9-17.
Yeh, C.-H. (2005). Development and validation of the Asian version of the Oucher: a pain intensity scale for children. The Journal of Pain, 6(8), 526-534.
Yeh, C. H. (2005). Development and validation of the Asian version of the oucher: a pain intensity scale for children. J Pain, 6(8), 526-534. doi: 10.1016/j.jpain.2005.03.002
Zheng Zhou City Orthopaedic Hospital official website.
(http://www.zzgkyy.com/kydt_show.asp?ID=1315). Deepen the pain Pain Management Nursing norms. Retrieved 12.5, 2013