www.atmos-meas-tech.net/4/2607/2011/ doi:10.5194/amt-4-2607-2011
© Author(s) 2011. CC Attribution 3.0 License.
Measurement
Techniques
Simultaneous stable isotope analysis of methane and nitrous oxide
on ice core samples
C. J. Sapart1, C. van der Veen1, I. Vigano1, M. Brass,1, R. S. W. van de Wal1, M. Bock2, H. Fischer2, T. Sowers3, C. Buizert4, P. Sperlich4, T. Blunier4, M. Behrens5, J. Schmitt2, B. Seth2, and T. R¨ockmann1
1Institute for Marine and Atmospheric research Utrecht, Utrecht Univ., Princetonplein 5, 3584CC Utrecht, The Netherlands 2Climate and Environmental Physics, Physics Institute and Oeschger Centre for Climate Change Research, Univ. of Bern, Sidlerstrasse 5, 3012 Bern, Switzerland
3Earth and Environmental Systems Institute, Geoscience, 237 Deike Building, Pennsylvania State Univ., University Park, PA 16802, USA
4Center for Ice and Climate, Niels Bohr Institute, Univ. of Copenhagen, Juliane Maries Vej 30, 2100 Copenhagen, Denmark 5Alfred Wegener Institute for Polar and Marine Research, Am Handelshafen 12, 27570 Bremerhaven, Germany
Received: 16 June 2011 – Published in Atmos. Meas. Tech. Discuss.: 14 July 2011
Revised: 13 November 2011 – Accepted: 22 November 2011 – Published: 2 December 2011
Abstract. Methane and nitrous oxide are important green-house gases which show a strong increase in atmospheric mixing ratios since pre-industrial time as well as large varia-tions during past climate changes. The understanding of their biogeochemical cycles can be improved using stable isotope analysis. However, high-precision isotope measurements on air trapped in ice cores are challenging because of the high susceptibility to contamination and fractionation.
Here, we present a dry extraction system for combined CH4and N2O stable isotope analysis from ice core air, using an ice grating device. The system allows simultaneous anal-ysis of δD(CH4)or δ13C(CH4), together with δ15N(N2O), δ18O(N2O) and δ15N(NO+ fragment) on a single ice core sample, using two isotope mass spectrometry systems. The optimum quantity of ice for analysis is about 600 g with typi-cal “Holocene” mixing ratios for CH4and N2O. In this case, the reproducibility (1σ ) is 2.1 ‰ forδD(CH4), 0.18 ‰ for δ13C(CH4), 0.51 ‰ forδ15N(N2O), 0.69 ‰ forδ18O(N2O) and 1.12 ‰ forδ15N(NO+fragment). For smaller amounts of ice the standard deviation increases, particularly for N2O isotopologues. For both gases, small-scale intercalibrations using air and/or ice samples have been carried out in col-laboration with other institutes that are currently involved in isotope measurements of ice core air. Significant differences are shown between the calibration scales, but those offsets are consistent and can therefore be corrected for.
Correspondence to: C. J. Sapart
1 Introduction
2608 C. J. Sapart et al.: Simultaneous stable isotope analysis of methane and nitrous oxide on ice core samples
32
Figures
777
778
Fig.1: Schematic set-‐up of the analytical system. The extraction system in the
779
shaded box in the center consists of a glass line (12mm o.d.) with manual valves.
780
The connection between this glass line and the ice grater is made via a piece of
781
flexible stainless steel bellows tubing. T1, T2 and T3 represent, respectively, a
782
water trap, a CO
2/N
2O trap and a Hayesep trap where CH
4and air are adsorbed.
783
V1, V2 and V3 represent multiport two-‐position Valco valves.
784
785
Fig. 1. Schematic set-up of the analytical system. The extraction system in the shaded box in the center consists of a glass line (12 mm o.d.)
with manual valves. The connection between this glass line and the ice grater is made via a piece of flexible stainless steel bellows tubing. T1, T2 and T3 represent, respectively, a water trap, a CO2/N2O trap and a Hayesep trap where CH4and air are adsorbed. V1, V2 and V3
represent multiport two-position Valco valves.
al., 2002; R¨ockmann et al., 2003b; Brass and R¨ockmann, 2010) and subsequent analytical systems for ice core anal-yses (Bernard et al., 2006; Schaefer et al., 2006; Ferretti et al., 2005; Sowers, 2001, 2006; Sowers et al., 2003; Bock et al., 2010b; Behrens et al., 2008). These developments have resulted in a number of interesting findings in the past years (Fischer et al., 2008; Mischler et al., 2009; Sowers, 2001, 2006, 2010; Sowers et al., 2003; Bernard et al., 2006; Ferretti et al., 2005; Bock et al., 2010a; Sch¨afer et al., 1998) which have, for example, ruled out a strong contribution of ma-rine clathrate decomposition to paleoatmospheric methane changes as observed in ice core air.
Ice extraction systems exist as wet extraction systems (af-ter Robbins et al., 1973; Craig and Chou, 1982), dry extrac-tion systems (after Moor and Stauffer, 1984; Etheridge et al., 1988) and sublimation techniques (G¨ul¨uk et al., 1997, 1998; Schmitt et al., 2011) each with their particular benefits and limitations. A drawback of most of the analytical systems published to date is that they can only measure one single compound per sample. Since ice air is limited and precious, we designed a system where at least two gases can be mea-sured on one ice air sample, namely one isotope signature
of CH4(δD orδ13C) and the complete isotopic composition of N2O (δ15N(N2O),δ18O(N2O) andδ15N(NO+fragment)). The new method is suited for ice samples of 200–800 g (for ice with mixing ratios of roughly 220–270 ppb for N2O and 600–700 ppb for CH4)corresponding to a minimum of∼14– 17 ng of CH4and∼15 ng of N2O for Holocene ice, allowing a high temporal resolution (∼20 yr) for Greenland ice core data. The amount of ice used is similar for CH4 and 30 % smaller for N2O compared to already published datasets.
2 Method
2.1 Experimental set-up
The complete analytical system is schematically shown in Fig. 1. A dry extraction technique is coupled to two continuous-flow IRMS systems for simultaneous isotope analysis of CH4and N2O. These parts will be described in detail in the following subsections.
2.1.1 Extraction
The extraction device consists of a 6 l stainless steel (SS) pot equipped with a perforated SS cylinder with sharp edges, the so-called “ice-grater” (Etheridge et al., 1988), where an ice core sample is grated under its own weight by sliding back and forth over the grater. The grater fits precisely between bottom plate and lid of the extraction pot, to avoid inter-ference in order to avoid metal-metal collisions, which may lead to CH4contamination (Higaki et al., 2006). Moreover, the grater is coated with titanium nitride (TiN, BALINIT®A, Oerlikon Blazers) in order to harden, protect the grating sur-face and increase the lifetime of the grater. Following the introduction of the ice sample into the grating cylinder, the SS pot is sealed with a copper o-ring (conflat flange of 22 cm of diameter) and fixed in a shaking device inside a freezer at−30◦C. From there, the pot can be evacuated to 10−3mb via the vacuum extraction system to remove laboratory air before grating starts. During the grating process, the shaker oscillates with a frequency up to 3 Hz (see below) and with an amplitude of about 6 cm. After 20 min of grating follow-ing an optimized protocol (see below), 99 % of an ice core piece of 200–800 g has been ground into flakes of 1 to 2 mm diameter.
After the grating, the SS pot is reconnected to the vac-uum extraction system (Fig. 1) and the air evacuated from the ice is processed through Trap 1 (T1), which traps H2O at −80◦C, and Trap 2 (T2), which traps CO2, N2O and most higher molecular weight hydrocarbons at−196◦C, to Trap 3 (T3). T1 and T2 are 2 U-shape tubes (12 mm o.d.,
L=250 mm). T3 is a U-shape tube (35 mm o.d., L=250) filled with ∼40 ml of Hayesep D (mesh 80/100, Alltech GmbH, Germany), a molecular adsorbent, cooled to−196◦C in a liquid nitrogen bath. This trap acts as a cryopump ad-sorbing all the air (inclusive CH4)from the SS pot to T3 in 45 min. After extraction, the N2O-CO2 mixture trapped in T2 is flushed with He (He BIP 5.7 from Air Products) at ambient temperature to the N2O IRMS. Subsequently, T3 is heated to 60◦C and its content is flushed by He to the CH4 IRMS. Both flushing units operate independently.
2.1.2 Methane IRMS
The CH4IRMS system is a fully automated analytical set-up for δD(CH4)or δ13(CH4)analyses (Brass and R¨ockmann, 2010). This system has been used for various laboratory and atmospheric studies in the past (Vigano et al., 2008, 2009, 2010; Keppler et al., 2006, 2008). For ice core-air mea-surements, the air trapped in T3 is flushed by He through a 2 position Valco 6 port valve (V1) (VICI® AG Interna-tional) to the preconcentration unit (PRECON) at a flow rate of 20 ml min−1. The PRECON of the CH4 IRMS system consists of a 1/800 SS tube of which the central 6 cm are packed with Hayesep D (mesh 80/100, Alltech GmbH, Ger-many). At−132◦C, the PRECON adsorbs CH4 while O2
and N2are purged out to the vent. After 540s of preconcen-tration, the cooling is stopped, the PRECON system slowly warms up, and residual air is vented. Only shortly before the CH4is released from the PRECON (at a temperature read-ing of∼−75◦C), V1 switches to “inject”. The CH4released is thus transferred to the CRYOFOCUS unit (Fig. 1), while other condensable gases are still retained on the Hayesep D. The cooling/heating system is explained in detail by Brass and R¨ockmann (2010). The CRYOFOCUS unit is a 1/1600 gas chromatography (GC) column (Poraplot Q) cooled to −158◦C where CH4is focused to obtain a narrow peak and remaining interferences are separated and removed (Brass and R¨ockmann, 2010). Following the CRYOFOCUS, CH4 is transferred through V2 to the conversion oven.
For δD measurements, CH4 is pyrolysed in an alu-mina (Al2O3) tube (0.8 mm inner diameter (i.d.), Length (L)=360 mm) at a temperature of +1300◦C. During pyrol-ysis, CH4is converted to hydrogen (H2)and carbon (C). C is deposited on the inner surface of the alumina tube, which promotes an efficient pyrolysis and H2production (Brass and R¨ockmann, 2010).
Forδ13C measurements, CH4is combusted to CO2in an alumina tube (1 mm i.d., L=320 mm) at +900◦C. Three Nickel wires (0.25 mm outer diameter (o.d.), Goodfellow, Cambridge Ltd., England) are used as catalysts and intro-duced into the tube. During each run, the combustion tube is flushed with O2for 5 s to refresh the oxidant before CH4 reaches the reactor.
The simultaneous analysis of both δD and δ13C is not possible, thus the system is running either in the pyrol-ysis or in the combustion mode. Following the pyroly-sis/combustion step, the sample is transferred via an open split interface (ThermoFinnigan Gas Bench II, Germany) to the mass spectrometer (ThermoFinnigan Delta plus XL, Ger-many).
2.1.3 Nitrous oxide IRMS
2610 C. J. Sapart et al.: Simultaneous stable isotope analysis of methane and nitrous oxide on ice core samples et al., 2003b) and to the mass spectrometer
(ThermoFinni-gan, Delta Plus XP, Germany). There, the ion masses 44, 45, 46, 30 and 31 are monitored for determination of
δ15N(N2O),δ18O(N2O) and the position dependent15N sig-natures (δ15N(NO+fragment)) as described in Brenninkmei-jer and R¨ockmann (1999).
2.2 Measurement procedure
2.2.1 Sample preparation and evacuation of the pot The ice sample is cut with a band saw to the desired size and shape. Subsequently, ∼2 mm of the surface of the sample is removed by microtoming. Next, the sample is weighed and inserted into the pre-cooled grating cylinder inside the SS pot. The pot is then immediately fixed to the shaking device inside the freezer at−30◦C and connected to the vac-uum system via a 65 cm length SS flexible bellows tubing (© Swagelok). Evacuation is usually performed overnight and a vacuum of 10−3mb is reached. In the case 2 samples are measured per day, the pot containing a new ice sample is evacuated for at least 90 min in order to reach a pressure of 10−3mb as well.
2.2.2 Blank and standard measurement
To diagnose possible contamination and in order to moni-tor the stability of the analytical system, a blank and a stan-dard measurement are performed before each ice sample. A sequence of measurement is blank-standard measurement-blank-ice core sample-blank. The blank measurement before the ice core measurement (or before the standard measure-ment) is carried out in order to verify that neither CH4nor N2O remains in T2 or T3, and that the system is cleaned and evacuated before starting the air measurements. The blank measurement after the “real” measurement (or after the stan-dard measurement) is carried out to verify that the entire sam-ple has been transferred from T2 and T3 to the IRMS systems and that the extraction system is evacuated properly. Dur-ing the blank measurements, pure He carrier gas is flushed from T2 and T3 (heated to +60◦C) to both IRMS systems and it is verified that neither CH4nor N2O peaks appear in the system. Standard measurements are performed before the ice core sample with a blank measurement in between. The goal of the standard measurement is to verify a proper operation of T3 and to monitor the stability of the system. In a standard measurement, about 20–50 ml of reference air (NAT332, 2141 ppb CH4, 331 ppb N2O) is filled into the SS pot containing the ice sample for the subsequent run (the pot is evacuated beforehand). The reference air is then extracted like an ice air sample (see next section). The blank and stan-dard measurement ensure that the system is thoroughly evac-uated and in a reproducible state before starting with the ice sample.
33
786
Fig.2: Grating of twenty-‐two ice core samples of different length and different
787
shapes at various frequencies and shaking angles (a). “a” is the angle between
788
the horizontal plane and the cross section of the SS pot. The error estimate
789
(smaller than the data-‐points) includes the error of the scale and the spread from
790
repeated tests.
791
792
0 20 40 60 80 100
0 1 2 3 4 5
0 5 10 15 20 25 30 35
2 quarter cylinders/f=1.5 Hz constant/ a=0 1 half cylinder/f=1.5 Hz constant/ a=0 2 quarter cylinders/ f=1-3Hz / a=0 2 quarter cylinders/ f=1-3Hz / a=0-30 1 half cylinder/ f=1-3Hz / a=0-30 2 half cylinders/ f=1-3Hz / a=0-30
Frequency (Hz)
Fraction
of
ice
grated
(%) Frequency
(Hz)
Time (min)
99% of ice grated!
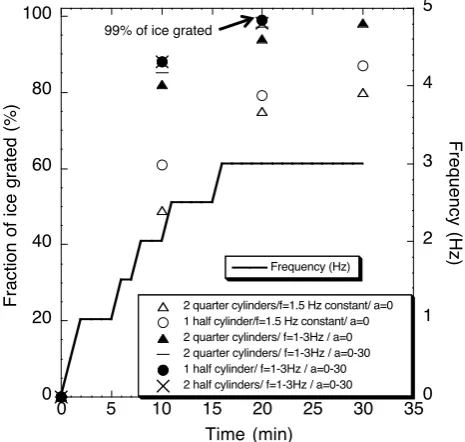
Fig. 2. Grating of twenty-two ice core samples of different length
and different shapes at various frequencies and shaking angles (a). “a” is the angle between the horizontal plane and the cross section of the SS pot. The error estimate (smaller than the data-points) includes the error of the scale and the spread from repeated tests.
2.2.3 Ice core air measurement
Following the standard measurement, the evacuated SS pot is disconnected from the extraction line and ice grating starts. During the first 2 min the frequency is slowly increased to 1 Hz and then in several steps to 3 Hz (Fig. 2). This is done manually, and by listening, care is taken that the ice sample does not knock against the walls (lids and bottom) of the SS pot. After 20 min of shaking, the SS pot is reconnected to the glass-line and the transfer line is evacuated. T1 is cooled by an ethanol-liquid nitrogen mixture to−80◦C and T2 and T3 are cooled by liquid nitrogen to−196◦C. After closing the valve between T1 and T2, the valve of the SS pot is opened and the pressure is measured with a MKS Baratron pressure gauge (accuracy: 0.05 mb range 0–100 mb). The (STP) vol-ume of air in the ice is calculated from the pressure and the volume of the pot and the mixing ratios is determined by comparing the peak area: sample air ratio in a sample to the same ratio in a calibrated reference gas. The extraction pro-cess starts by opening the valve between T1 and T2. The whole air sample is adsorbed on the Hayesep D in T3 within 45 min; the valve after T3 is kept closed.
IRMS systems are started simultaneously and the extracted samples are transferred to the IRMS systems. After isotope measurement of the ice air samples, the glass line is not evac-uated, but the second blank measurement as described above is conducted to verify that all the air had been transferred to both IRMS systems.
After the measurement, the SS pot is opened, cleaned with lens paper, filled with new ice, sealed and reconnected to the shaker in the freezer for evacuation.
When the two IRMS systems are not analyzing blanks, standards or samples from the ice extraction system, they are automatically running air samples from laboratory refer-ence air cylinders (NAT325 for the CH4IRMS and NAT335 for the N2O IRMS, both filled with atmospheric air cylin-ders sampled in Groningen, NL) via the separate IRMS sys-tems. Every reference air measurement lasts about 30 min and those runs are used for data correction (see Sect. 3.5) and quality control of the system.
3 Optimization of the dry extraction system
Several parameters were optimized for the new dry extraction system in order to ensure the most precise and reproducible stable isotope measurements.
3.1 Grating efficiency
We optimized the grating efficiency by adjusting the dura-tion, position and frequency of the shaking and the shape of the ice sample in order to have the largest quantity of ice grated in the shortest amount of time. Twenty-two ice core samples (half or quarter cylinders) of 6 to 18 cm of length and between 200–800 g weight were introduced into the grater and shaken at frequencies varying from 0 to 3 Hz (Fig. 2). During the shaking tests, the pot was opened every 5 min and the remaining (i.e. non-grated) ice samples were weighed to evaluate the grating efficiency. Figure 2 shows the results of the grating tests. It appears that under optimal conditions, (with two half cylinders of 12 cm length and at a frequency of 0–3 Hz) 88 % of the ice sample was grated after 10 min and 99 % after 20 min. The amount of ice introduced into the shaker is not a critical parameter, however, the shaking fre-quency and the position of the samples in the grater are im-portant. When shaking is started at 3 Hz, a strong knocking of the ice sample against the walls of the SS pot can be heard, which could potentially (but this was not clearly identified) damage the oxide layer of the SS surface and lead to CH4 production (Higaki et al., 2006). Furthermore, strong colli-sions with the wall break the ice sample into small pieces, which decreases the grating efficiency. Therefore, the fre-quency of shaking is increased slowly to 1 Hz during the first 2 min, maintained at 1 Hz for 4 more min and then increased gradually again to 3 Hz (Fig. 2). Moreover, the SS pot can be fixed in the shaking device in different position from the
horizontal to the vertical position. For the first 5–10 min of shaking, the pot stays in a horizontal position (angle (a)=0), thereafter it is rotated to an angle (a) of 30◦. This allows a more efficient grating of the small remaining pieces. For large samples (>500 g), the grating angle is maintained at
a=30◦during the entire grating process to prevent the ice to knock strongly against the lid of the SS pot. The typical di-ameter of the grated ice flakes is about 1–2 mm and>97 % of the air is extracted while grating bubbly ice. The grating ef-ficiency is determined using the assumption that 10 % of the ice volume is air which represents the average total air con-tent for the type of ice used for the tests. So we compare the total air content with the calculated volume of air extracted as explained in Sect. 2.2.3.
3.2 Extraction procedure
Extraction of air from the grating pot is a critical step. Since the extraction takes a long time, it was decided not to pump through a CH4adsorption agent with a vacuum pump, but to use a larger quantity of adsorption agent as cryopump. To find the most suitable adsorption agent, several grams of molecular sieve, activated carbon or Hayesep D were filled into separate 100 ml glass bottles, thoroughly outgassed and used to adsorb different amounts of reference air from the SS pot. Hayesep D mesh 80/100, Alltech GmbH, Germany appears to be the most efficient and reproducible (in term of isotope ratio measurements) adsorbent. Tests with differ-ent mesh sizes were carried out and it appears that consider-ing the relatively large amount of Haysep packed in T3, the largest mesh size was the most efficient, because the greater porosity allows a more efficient release of the air. Conse-quently, in the final design we used a glass-line provided with a 70 ml U-shaped Hayesep D trap (T3).
The N2O is completely trapped in a U-shaped glass tube (12 mm o.d., L=250 mm) immersed in liquid nitrogen (−196◦C), and is released when heated to room temperature. It was verified that no N2O is trapped in T1 or T3 or remains in T2 after sample transfer to the isotope system by measur-ing the N2O mixing ratios from these traps after a normal sample analysis.
3.3 Tests with bubble-free ice
2612 C. J. Sapart et al.: Simultaneous stable isotope analysis of methane and nitrous oxide on ice core samples
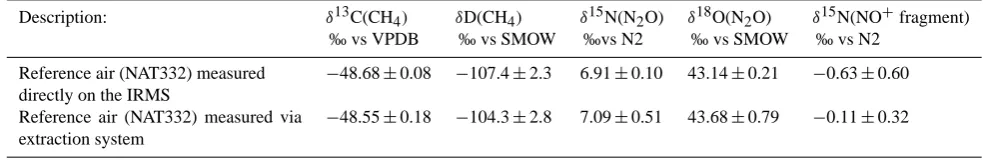
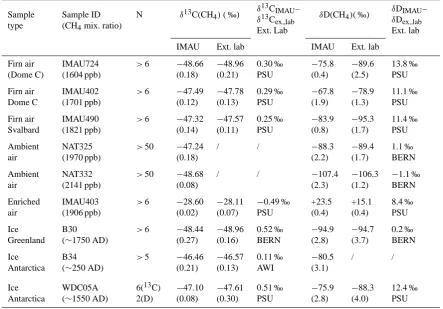
Table 1. Results from tests with the extraction system. Each value represents the mean±1σ standard deviation of>40 measurements of different amount (20–100 ml) of the same reference air (NAT332, 2141 ppb CH4, 331 ppb N2O). The first row corresponds to reference air
directly measured on the two IRMS systems. The second row corresponds to the measurement of reference air introduced into the SS pot and extracted as an ice core air sample.
Description: δ13C(CH4) δD(CH4) δ15N(N2O) δ18O(N2O) δ15N(NO+fragment)
‰ vs VPDB ‰ vs SMOW ‰vs N2 ‰ vs SMOW ‰ vs N2 Reference air (NAT332) measured
directly on the IRMS
−48.68±0.08 −107.4±2.3 6.91±0.10 43.14±0.21 −0.63±0.60 Reference air (NAT332) measured via
extraction system
−48.55±0.18 −104.3±2.8 7.09±0.51 43.68±0.79 −0.11±0.32
It should be noted that although this BF ice does not con-tain air, it is less hard than deep ice core ice so the grat-ing is not exactly identical. After the gratgrat-ing procedure, the reference air from the SS pot was extracted like an ice air sample and CH4mixing ratios and stable isotope ratios were measured from T3 on a GC-Flame Ionization Detector (FID, GC8000top, CE instruments®)and on the IRMS system. In parallel, the reference air cylinder was analyzed directly on the GC-FID and on the IRMS system in order to verify that the extracted air had the same mixing ratio as measured di-rectly from the cylinder. The results show that the differences in isotopic composition and mixing ratios, between the aver-age values of bubble free ice measurement and the reference measurements is within the measurement uncertainty. This indicates that no significant contamination occurs during the grating-extraction process.
3.4 System reproducibility
More than forty reproducibility tests were conducted by ex-tracting and analyzing between 20 and 100 ml of reference air (NAT332, 2141 ppb CH4, atmospheric air cylinder from Groningen) from the SS pot either filled with leftover grated ice samples or empty. The test with leftover grated ice was done in order to verify that all the air released from the ice was adsorbed on T3, so that no air remained in the pot. NAT332 was regularly measured directly on both IRMS sys-tems as well. The average differences between the isotope signature of NAT332 measured directly on both IRMS sys-tems and extracted from the grating pot shows slight offsets of 0.13 ‰ forδ13C(CH4), 0.5 ‰ for δD(CH4), 0.18 ‰ for δ15N(N2O), 0.54 ‰ forδ18O(N2O), 0.52 ‰ forδ15N(NO+ fragment) (Table 1). Those small offsets are constant and daily monitored with the standard measurements. For ice core samples, the reproducibility for different amounts of ice is presented in Table 2. The amount of air remains a limiting parameter for reliable N2O isotope and mixing ra-tio measurements. Air released from 200 g and 350 g of ice (with mixing ratios of 600–700 ppb for CH4 and 220– 270 ppb for N2O) is enough for high precision (here high pre-cision means that we reached or are beyond the prepre-cision of
already published datasets for the same amount of ice) mea-surements forδ13C(CH4)andδD(CH4), respectively, but for this amount the precision is rather low for the N2O isotope signatures. An increase of the sample size to about 600 g leads to a strong reduction of the error also for N2O isotopo-logues (Table 2) which allows to reach or improve the pre-cision of already published datasets (Sowers et al., 2002 and Bernard et al., 2006) using 40 % less ice.
3.5 Data correction
The isotope analyses are performed on a ThermoFinnigan Delta plus XL IRMS (for CH4isotopologues) and on a Ther-moFinnigan XP IRMS (for N2O isotopologues). Running gas peaks of pure CO2, H2and N2O bracket the sample peak for direct referencing to eliminate short-term shifts in IRMS performance. This raw δ-value from the chromatogram is evaluated with the ISODAT software and is then compared to the daily mean value of reference air measurements on both IRMS systems to obtain theδvalue of the sample versus the reference air,δSAM vs REF. These values are then corrected for non-linearity when needed (see below). The reference air cylinders have been independently calibrated versus interna-tional standards as explained in Brass and R¨ockmann (2010) and Kaiser et al. (2003).
Linearity tests are performed at least twice a week on both IRMS systems by running twenty-five analyses of various volumes (5 to 40 ml for the CH4IRMS and 20 to 333 ml for the N2O IRMS) of reference air NAT335 (for N2O IRMS, 326 ppb) and NAT325 (for CH4IRMS, 1970 ppb) covering the investigated sample range. Those linearity runs are used to monitor the quality of the analytical systems and the sta-bility of the measurements for small peak areas.
Table 2. System reproducibility. Five samples of similar ice were measured for each test. For each isotope signature, the first line gives
the reproducibility for the minimum amount of ice necessary for reliable measurements and the second line gives the reproducibility for our preferred conditions, which is a trade-off between high precision and possible high temporal resolution.
Stable Gas amount Ice amount 1σ-reproducibility isotope (ng) 600–700 ppb for CH4 (‰)
220–270 ppb for N2O
δ13C(CH4) 14±2 200±38 0.31±0.06
42±2 600±54 0.18±0.02
δD(CH4) 21±2 350±48 2.9±0.8
42±2 600±58 2.1±0.2
δ15N(N2O) 10±1 350±32 0.92±0.11
17±1 600±58 0.51±0.09
δ18O(N2O) 10±1 350±32 1.08±0.23
17±1 600±58 0.69±0.14
δ15N(NO+fragment) 10±1 350±32 1.63±0.31 17±1 600±58 1.12±0.48
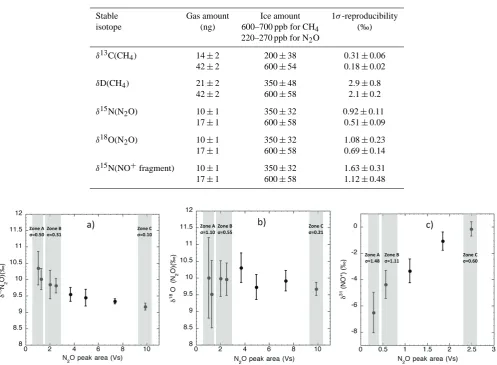
Fig. 3. Results from linearity tests for N2O isotopologues carried out twice a week during one month. Various amounts of reference air were
introduced directly to the N2O IRMS system. Zone A corresponds to peak areas where the small ice core samples of B30 were measured
(350–480 g). Zone B corresponds to the “optimal zone” where larger ice samples (∼500–700 g) are measured. Zone C corresponds to standard reference air measurements. (a)δ15N(N2O) (b)δ18O(N2O) (c)δ15N(NO+fragment).
δREF Cin order to obtainδSAM vs REF. In order to correct for the non-linearity, about ten reference air runs are performed covering exactly the same peak area as the ice sample mea-sured beforehand (Fig. 3). The average of those ten runs is
δREF lin. The linearity correction (Lin corr) corresponds to δREF C−δREF lin. To obtain the finalδvalue, we add Lin corr toδSAM vs REF. Zone A corresponds to ∼350–480 g of ice samples and zone B to∼500–700 g of ice (Table 2). For N2O isotopologues, the error (standard deviation) decreases by at least 20 % (depending on the isotope) from zone A to zone B. We preferentially measure ice samples in zone B, which is a compromise between good precision and economic use of ice (equivalent to possible high temporal resolution).
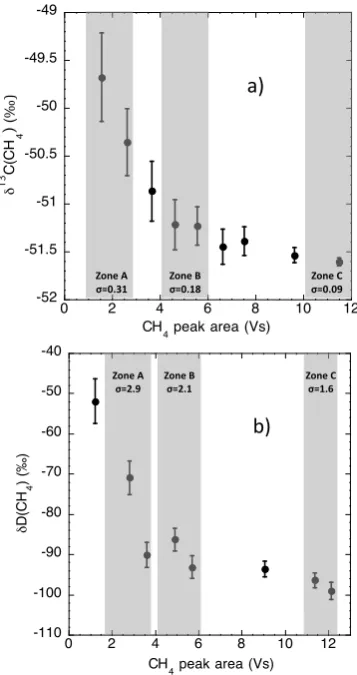
The CH4 IRMS system shows non-linearity patterns (Fig. 4a and b) as well. The correction procedure is similar for N2O isotopologues, but the number of runs before and after the ice core air run is about six. The amount of ice is less critical for CH4isotopologues, because even when mea-suring ice in zone A, the reproducibility remains similar or better than already published datasets Behrens et al. (2008), Bock et al. (2010), Sowers et al. (2010).
4 Intercomparison
2614 C. J. Sapart et al.: Simultaneous stable isotope analysis of methane and nitrous oxide on ice core samples
35
802
803
Fig.4: Results from linearity tests for CH4 isotopologues
carried out twice a week 804
during one month. Various amounts of reference air were introduced directly to
805
the CH4 IRMS system. Zone A corresponds to peak areas where the small ice core
806
samples of B30 were measured (200-‐350g for δ13C and 350-‐480g for δD ). Zone B
807
corresponds to the “optimal zone” where larger ice samples (~500-‐700g) are 808
measured. Zone C corresponds to standard reference air measurements. a) 809
δ13C(CH4) b) δD(CH4).
810
-52 -51.5 -51 -50.5 -50 -49.5 -49
0 2 4 6 8 10 12
!
13 C(CH
4
)
(
!"
CH4 peak area (Vs)
!"#$%&% '()*)+%
!"#
!"#$%,% '()*-.% !"#$%/%
'()*0-%
-110 -100 -90 -80 -70 -60 -50 -40
0 2 4 6 8 10 12
!
D(CH
4
) (‰)
CH4 peak area (Vs)
!"#$%&% '()*+%
!"#
!"#$%,% '(-*)% !"#$%.%
'(-*/%
Fig. 4. Results from linearity tests for CH4isotopologues carried
out twice a week during one month. Various amounts of reference air were introduced directly to the CH4IRMS system. Zone A
cor-responds to peak areas where the small ice core samples of B30 were measured (200–350 g forδ13C and 350–480 g forδD). Zone B corresponds to the “optimal zone” where larger ice samples (∼500– 700 g) are measured. Zone C corresponds to standard reference air measurements. (a)δ13C(CH4)(b)δD(CH4).
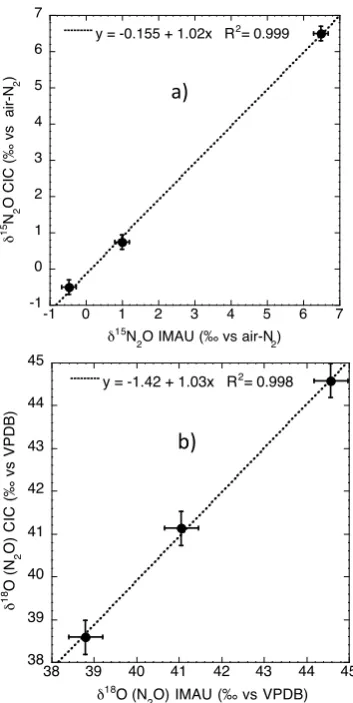
reference materials. Therefore, results from different tories are generally not directly comparable. Several labora-tories are presently involved in isotope measurements of CH4 and N2O from the NEEM ice core (North Greenland Eemian Ice Drilling program). As a first step towards characteriz-ing the offset between these laboratories, a small number of air and ice samples were exchanged between Utrecht Uni-versity and the other laboratories. For CH4isotope analysis, air and ice samples were exchanged with the Pennsylvania State University (PSU), the University of Bern (BERN) and the Alfred Wegener Institute for Polar and Marine Research in Bremerhaven (AWI). For N2O isotope analysis, three air samples were exchanged with the Center for Ice and Climate in Copenhagen (CIC). A larger intercomparison exercise, led by the PSU group, is currently being carried out with many more laboratories.
4.1 Methane intercomparison
Electropolished 2 l stainless steel cans were used for the iso-tope analysis, similar to those used for air sampling on air-craft and subsequent isotope and trace gas analysis (Kaiser et al., 2006; Laube et al., 2010). For comparison with the PSU lab, three archived firn air samples were used. Two samples (IMAU402 and IMAU724) from the 1999 drilling at Dome C, Antarctica (Br¨aunlich et al., 2001) and one sample from Svalbard (IMAU490). The fourth sample corresponds to highly enriched CH4(IMAU403). For the intercompari-son with BERN two continental whole air samples (NAT325 and NAT332) were collected in Groningen, the Netherlands, and used as laboratory reference gases at IMAU. One of them (NAT332) contains a significant CH4contamination (mixing ratio 2141 ppb). By combining firn air samples with clean and contaminated recent air samples, the air samples cover a range of ∼1.5 ‰ in δ13C and ∼35 ‰ in δD. The very enriched sample (IMAU403) has a13C content far outside the range of tropospheric values, but it has been included to assess potential differences in theδ scale, which is rel-evant since most laboratories only use a one-point calibra-tion for CH4isotopologues. The ice core samples were from Greenland (B30 core,∼1750 AD), and from Antarctica (B34 core,∼250 AD), provided by AWI and analyzed by BERN, IMAU and AWI, respectively. In addition we used ice from the WAIS divide drilled in 2005 in Antarctica (WDCO5A, ∼1550 AD) provided by PSU and analyzed by PSU and IMAU.
Results of the CH4intercomparison are summarized in Ta-ble 3. For the three firn air samples analyzed by IMAU and PSU (first three lines in Table 3), there is an average offset ofδ13C(CH4)=0.28±0.03 ‰ andδD=12.1±1.5 ‰. This difference is very reproducible, indicating that it is likely due to an offset in calibration scales between the two lab-oratories. For the WAIS ice core samples (last line in Ta-ble 3), the difference is identical forδD (12.4 ‰), but it in-creases for δ13C to 0.51 ‰. This effect is larger than the reproducibility established for our new system. It is in the same direction, but slightly larger (∼0.1 ‰) than the differ-ence between air measured directly and extracted from the ice grating device as shown in Table 1. The difference of the IMAUδ13C(CH4)measurements and the results from BERN on ice core air is similar (0.52 ‰), but the difference to AWI is much smaller (0.11 ‰). Unfortunately, no air compari-son samples are available for comparicompari-son between IMAU, and these two laboratories. For δD(CH4), the results from the IMAU and BERN systems agree very well for both air and ice measurements and the differences are well within the combined error, 4 ‰ and 6 ‰, respectively.
Table 3. Intercomparison of measurements made at IMAU with the new system and at other labs for air samples (six first lines) and ice
samples (three last lines). 1 sigma standard deviations from N-measurements are presented between brackets. All data are referenced to V-SMOW forδD(CH4)and V-PDB forδ13C(CH4).
Sample type
Sample ID (CH4mix. ratio)
N δ13C(CH4)( ‰) δ
13C IMAU–
δ13Cex lab
Ext. Lab
δD(CH4)( ‰) δDIMAU–
δDex lab
Ext. lab IMAU Ext. lab IMAU Ext. lab
Firn air (Dome C)
IMAU724 (1604 ppb)
>6 −48.66 (0.18) −48.96 (0.21) 0.30 ‰ PSU −75.8 (0.4) −89.6 (2.5) 13.8 ‰ PSU Firn air Dome C IMAU402 (1701 ppb)
>6 −47.49 (0.12) −47.78 (0.13) 0.29 ‰ PSU −67.8 (1.9) −78.9 (1.3) 11.1 ‰ PSU Firn air Svalbard IMAU490 (1821 ppb)
>6 −47.32 (0.14) −47.57 (0.11) 0.25 ‰ PSU −83.9 (0.8) −95.3 (1.7) 11.4 ‰ PSU Ambient air NAT325 (1970 ppb)
>50 −47.24 (0.18)
/ / −88.3 (2.2) −89.4 (1.7) 1.1 ‰ BERN Ambient air NAT332 (2141 ppb)
>50 −48.68 (0.08)
/ / −107.4 (2.3)
−106.3 (1.2)
−1.1 ‰ BERN Enriched
air
IMAU403 (1906 ppb)
>6 −28.60 (0.02)
−28.11 (0.07)
−0.49 ‰ PSU +23.5 (0.4) +15.1 (0.4) 8.4 ‰ PSU Ice Greenland B30 (∼1750 AD)
>6 −48.44 (0.27) −48.96 (0.16) 0.52 ‰ BERN −94.9 (2.8) −94.7 (3.7) 0.2 ‰ BERN Ice Antarctica B34 (∼250 AD)
>5 −46.46 (0.21) −46.57 (0.13) 0.11 ‰ AWI −80.5 (3.1) / / Ice Antarctica WDC05A (∼1550 AD)
6(13C) 2(D) −47.10 (0.08) −47.61 (0.30) 0.51 ‰ PSU −75.9 (2.8) −88.3 (4.0) 12.4 ‰ PSU
are included in the intercomparison. This may be attributed to the difference between the extraction devices used. The IMAU data were obtained with a dry extraction system as described above and the other laboratories use different wet extraction techniques (e.g. Behrens et al., 2008; Bock et al., 2010b, Sowers, 2010).
Concerning the enriched sample (IMAU403), the offset between IMAU and PSU is not consistent with the aver-age offset of the firn air samples. The change in offset is 0.8 ‰ over a range of∼20 ‰. The results suggest that fu-ture international calibration efforts should aim for at least a two-point calibration strategy for CH4isotopologues, where a scale difference can be calibrated like for water isotopo-logues (SMOW-SLAP-scale). The presented data are only a first step showing the existence of significant differences for
δ13C(CH4).
The reported differences between different laboratories can be larger than the reported uncertainties of individual laboratories. This means that isotope variations along a po-lar ice core can be studied consistently and with high pre-cision with one analytical system, but comparisons between datasets should take into account these differences.
An important issue is that possible offsets are constant and do not vary in time, which could be monitored by regularly
measuring similar ice core samples. In addition, regular com-parisons between wet and dry extraction methods may be used to assess long-term stability of the extraction procedure, and such measurements have been initiated in our laboratory. 4.2 Nitrous oxide intercomparison
2616 C. J. Sapart et al.: Simultaneous stable isotope analysis of methane and nitrous oxide on ice core samples
36
811
812
Fig.5: N
2O isotope results of three air cylinders measured at IMAU and CIC. a)
813
δ
15
N b) δ
18
O. The dotted line represents the best fit.
814
815
-1 0 1 2 3 4 5 6 7
-1 0 1 2 3 4 5 6 7
y = -0.155 + 1.02x R2= 0.999
!
15N
2
O
CIC
(‰
vs
air-N
2
)
!15N2O IMAU (‰ vs air-N2)
!"#
38 39 40 41 42 43 44 45
38 39 40 41 42 43 44 45
y = -1.42 + 1.03x R2= 0.998
!
18
O (N
2
O)
CIC
(‰
vs
VPDB)
!18O (N2O) IMAU (‰ vs VPDB)
!"#
Fig. 5. N2O isotope results of three air cylinders measured at IMAU and CIC. (a)δ15N (b)δ18O. The dotted line represents the best fit.
5 Conclusions
A new dry extraction technique coupled to two IRMS sys-tems for simultaneous CH4 and N2O isotope analysis has been developed for high-precision isotope measurements of ice core air. The minimum amount of preindustrial ice (with CH4 mixing ratios of about 600–700 ppb and N2O mixing ratios of about 220–270 ppb) necessary for measurements of both gases is 350 g, but in order to increase reproducibil-ity, we preferentially measure samples of about 600 g. For these amounts, the reproducibility is 2.1 ‰ for δD(CH4), 0.18 ‰ forδ13C(CH4), 0.51 ‰ forδ15N(N2O), 0.69 ‰ for δ18O(N2O) and 1.12 for δ15N(NO+ fragment). Possible small offsets during the extraction of air from the grating device are smaller than the presently existing uncertainties of the CH4and N2O isotope scales for all signatures. Re-sults from a small-scale intercalibration exercise for air and ice samples with five external laboratories (BERN, PSU, CIC and AWI) reveal significant offsets between the laboratories. Future attempts for harmonization of the CH4isotope scale
should provide at least a two-point calibration scale. Despite these open issues on calibration, the excellent reproducibility will allow the new analytical system to investigate in detail the past atmospheric budget of CH4and N2O with relatively high temporal resolution allowing reconstructing changes in the sources and sinks.
Acknowledgements. We would like to acknowledge the Dutch
Science Foundation (NWO) for funding (Projects: 851.30.020 & 865.07.001).
Edited by: D. Griffith
References
Behrens, M., Schmitt, J., Richter, K. U., Bock, M., Richter, U. C., Levin, I., and Fischer, H.: A gas chromatogra-phy/combustion/isotope ratio mass spectrometry system for high-precision deltaδ13C measurements of atmospheric CH4 ex-tracted from ice core samples, Rapid Commun. Mass Spectrom., 22, 3261–3269, doi:10.1002/rcm.3720, 2008.
Bernard, S., R¨ockmann, T., Kaiser, J., Barnola, J.-M., Fischer, H., Blunier, T., and Chappellaz, J.: Constraints on N2O
bud-get changes since pre-industrial time from new firn air and ice core isotope measurements, Atmos. Chem. Phys., 6, 493–503, doi:10.5194/acp-6-493-2006, 2006.
Bock, M., Schmitt J., M¨oller, L., Spahni R., Blunier T., and Fischer H.: Hydrogen isotopes preclude marine hydrate CH4emissions
at the onset of Dansgaard-Oeschger events, Science, 328, 1686– 1689, doi:10.1126/science.1187651, 2010a.
Bock, M., Schmitt, J., Behrens, M., Moller, L., Schnei-der, R., Sapart, C., and Fischer, H.: A gas chromatogra-phy/pyrolysis/isotope ratio mass spectrometry system for high-precisionδD measurements of atmospheric CH4extracted from
ice cores, Rapid Commun. Mass Spectrom., 24, 621–633, doi:10.1002/rcm.4429, 2010b.
Bousquet, P., Ciais, P., Miller, J. B., Dlugokencky, E. J., Hauglus-taine, D. A., Prigent, C., Van der Werf, G. R., Peylin, P., Brunke, E. G., Carouge, C., Langenfelds, R. L., Lathiere, J., Papa, F., Ramonet, M., Schmidt, M., Steele, L. P., Tyler, S. C., and White, J.: Contribution of anthropogenic and natural sources to atmospheric CH4variability, Nature, 443, 439–443, doi:10.1038/nature05132, 2006.
Brass, M. and R¨ockmann, T.: Continuous-flow isotope ratio mass spectrometry method for carbon and hydrogen isotope measure-ments on atmospheric methane, Atmos. Meas. Tech., 3, 1707– 1721, doi:10.5194/amt-3-1707-2010, 2010..
Br¨aunlich, M., Aballain, O., Marik, T., Jockel, P., Brenninkmei-jer, C. A. M., Chappellaz, J., Barnola, J. M., Mulvaney, R., and Sturges, W. T.: Changes in the global atmospheric CH4budget
over the last decades inferred fromδ13C andδD isotopic anal-ysis of Antarctic firn air, J. Geophys. Res., 106, 20465–20481, doi:10.1029/2001JD900190, 2001.
Brenninkmeijer, C. A. M. and R¨ockmann, T.: Mass spectrometry of the intramolecular nitrogen isotope distribution of environmental N2O using fragment-ion analysis, Rapid Commun. Mass
Spec-trom., 13, 2028–2033, 1999.
chem-istry of atmospheric trace gases, Chem. Rev., 103, 5125–5162, doi:10.1021/cr020644k, 2003.
Craig, H. and Chou, C. C.: Methane – the Record in Polar Ice Cores, Geophys. Res. Lett., 9, 1221–1224, 1982.
Dlugokencky, E. J., Masarie, K. A., Lang, P. M., and Tans, P. P.: Continuing decline in the growth rate of the atmospheric CH4
burden, Nature, 393, 447–450, doi:10.1038/30934, 1998. Dlugokencky, E. J., Bruhwiler, L., White, J. W. C., Emmons,
L. K., Novelli, P. C., Montzka, S. A., Masarie, K. A., Lang, P. M., Crotwell, A. M., Miller, J. B., and Gatti, L. V.: Observational constraints on recent increases in the at-mospheric CH4 burden, Geophys. Res. Lett., 36, L18803, doi:18810.11029/12009gl039780, 2009.
Etheridge, D. M., Pearman, G. I., and Silva, F. D.: Atmospheric trace-gas variations as revealed by air trapped in an ice core from Law Dome, Antarctica, Ann. Glaciol., 10, 28–33, 1988. Etheridge, D. M., Steele, L. P., Francey, R. J., and Langenfelds, R.
L.: Atmospheric CH4between 1000 AD and present: Evidence
of antropogenic emissions and climatic variability, J. Geophys. Res., 103, 15979–15993, 1998.
Ferretti, D., Miller, J., White, J., Etheridge, D., Lassey, K., Lowe, D., Allan, B., MacFarling, C., Dreier, M., Trudinger, C., and Ommen, T. V.: Unexpected changes to the global CH4 budget over the past 2000 years, Science, 309, 864–867,
doi:10.1126/science.1115193, 2005.
Fischer, H., Behrens, M., Bock, M., Richter, U., Schmitt, J., Louler-gue, L., Chappellaz, J., Spahni, R., Blunier, T., Leuenberger, M., and Stocker, T. F.: Changing boreal CH4sources and constant biomass burning during the last termination, Nature, 452, 864– 867, doi:10.1038/nature06825, 2008.
Fl¨uckiger, J., Monnin, E., Stauffer, B., Schwander, J., Stocker, T. F., Chappellaz, J., Raynaud, D., and Barnola, J. M.: High-resolution Holocene N2O ice core record and its
relation-ship with CH4and CO2, Global Biogeochem. Cy., 16, 1010,
doi:10.1029/2001GB001417, 2002.
Forster, P., Ramaswamy, V., Artaxo, P., Berntsen, T., Betts, R., Fahey, D. W., Haywood, J., Lean, J., Lowe, D. C., Myhre, G., Nganga, J., R. Prinn, Raga, G., Schulz, M., and Dorland, R. V.: Changes in Atmospheric Constituents and in Radiative Forcing, in: Climate Change 2007: The Physical Science Basis. Con-tribution of Working Group I to the Fourth Assessment Report of the Intergovernmental Panel on Climate Change, edited by: Solomon, S., Qin, D., Manning, M., Chen, Z., Marquis, M., Av-eryt, K. B., Tignor, M., and Miller, H. L., Cambridge University Press, Cambridge, United Kingdom and New York, NY, USA, 2007.
G¨ull¨uk, T. and Slemr, F.: Simultaneous measurements of CO2, CH4
and N2O in air extracted by sublimation from Antarctica ice
cores: Confirmation of the data obtained using other extraction, J. Geophys. Res., 103, 15971–15978, doi:10.1029/98JD00686, 1998.
G¨ull¨uk, T., Wagner, H. E., and Slemr, F.: A high-frequency mod-ulated tunable diode laser absorption spectrometer for measure-ments of CO2, CH4, N2O and CO in air samples of few cm3,
Rev. Sci. Instrum., 68, 230, doi:10.1063/1.1147814, 1997. Higaki, S., Oya, Y., and Makide, Y.: Emission of CH4from
Stain-less Steel Surface Investigate by using Tritium as a Radioactive Tracer, Chem. Lett., 35, 292, doi:10.1246/cl.2006.292, 2006. IPCC: Climate Change 2007: The Physical Science Basis – Fourth
Assessment Report of the Intergovernmental Panel on Climate Change, Cambridge Univ. Press, New York, 2007.
Ishijima, K., Sugawara, S., Kawamura, K., Hashida, G., Morimoto, S., Murayama, S., Aoki, S., and Nakazawa, T.: Temporal varia-tions of the atmospheric N2O concentration and its deltaδ15N
and deltaδ18O for the latter half of the 20th century recon-structed from firn air analyses, J. Geophys. Res.-Atmos., 112, D03305, doi:10.1029/2006JD007208, 2007.
Kaiser, J., Engel, A., Borchers, R., and R¨ockmann, T.: Probing stratospheric transport and chemistry with new balloon and air-craft observations of the meridional and vertical N2O isotope
dis-tribution, Atmos. Chem. Phys., 6, 3535–3556, doi:10.5194/acp-6-3535-2006, 2006.
Keppler, F., Hamilton, J. T. G., Brass, M., and R¨ockmann, T.: CH4
emissions from terrestrial plants under aerobic conditions, Na-ture, 439, 187–191, doi:110.1038/nature04420, 2006.
Keppler, F., Hamilton, J. T. G., McRoberts, W. C., Vigano, I., Brass, M., and R¨ockmann, T.: Methoxyl groups of plant pectin as a precursor of atmospheric CH4: evidence from deuterium la-belling studies, New Phytol., 178, 808–814, doi:10.1111/j.1469-8137.2008.02411.x, 2008.
Laube, J. C., Martinerie, P., Witrant, E., Brenninkmeijer, C. A. M., Bolder, M., R¨ockmann., T., van der Veen, C., and Sturges, W. T.: Accelerating growth of HFC-227ea (1,1,1,2,3,3,3-heptafluoropropane) in the atmosphere, Atmos. Chem. Phys., 10, 5903–5910, doi:10.5194/acp-10-5903-2010, 2010.
Lelieveld, J., Crutzen, P. J., and Dentener, F. J.: Changing concen-tration, lifetimes and climate forcing of atmospheric CH4, Tellus, 50B, 128–150, 1998.
MacFarling Meure, C., Etheridge, D., Trudinger, C., Steele, P., Langenfelds, R., Ommen, T. V., Smith, A., and Elkins, J.: Law Dome CO2, CH4 and N2O ice core records
ex-tended to 2000 years BP Geophys. Res. Lett., 33, L14810, doi:14810.11029/12006GL026152, 2006.
Merritt, D. A., Hayes, J. M., and Des Marais, D. J.: Carbon iso-topic analysis of atmospheric CH4by isotope-ratio-monitoring
gas chromatography-mass spectrometry, J. Geophys. Res., 100 D, 1317/1326, doi:10.1029/94JD02689, 1995.
Miller, J. B., Mack, K. A., Dissly, R., White, J. W. C., Dlugo-kencky, E. J., and Tans, P. P.: Development of analytical meth-ods and measurements ofδ13C in atmospheric CH4 from the
NOAA/CMDL global air sampling network, J. Geophys. Res., 107, 4178, doi:10.1029/2001JD000630, 2002.
Mischler, J. A., Sowers, T. A., Alley, R. B., Battle, M., Mc-Connell, J. R., Mitchell, L., Popp, T., Sofen, E., and Spencer, M. K.: Carbon and hydrogen isotopic composition of CH4over
the last 1000 years, Global Biogeochem. Cy., 23, GB4024, doi:10.1029/2009GB003460, 2009.
Moor, E. and Stauffer, B.: A New Dry Extraction System for Gases in Ice, J. Glaciol., 30, 358–361, 1984.
Quay, P., Stutsman, J., Wilbur, D., Snover, A., Dlugo-kencky, E., and Brown, T.: The isotopic composition of atmospheric CH4, Global Biogeochem. Cy., 13, 445–461, doi:10.1029/1998GB900006, 1999.
Rice, A. L., Gotoh, A. A., Ajie, H. O., and Tyler, S. C.: High-precision continuous-flow measurement of δ13C and δD of atmospheric CH4, Anal. Chem., 73, 4104–4110,
doi:10.1021/ac0155106, 2001.
Analy-2618 C. J. Sapart et al.: Simultaneous stable isotope analysis of methane and nitrous oxide on ice core samples
sis of Ancient Atmosphere, J. Geophys. Res., 78, 5341–5344, doi:10.1029/JC078i024p05341, 1973.
R¨ockmann, T., Kaiser, J., and Brenninkmeijer, C. A. M.: The iso-topic fingerprint of the pre-industrial and the anthropogenic N2O
source, Atmos. Chem. Phys., 3, 315–323, doi:10.5194/acp-3-315-2003, 2003a.
R¨ockmann, T., Kaiser, J., Brenninkmeijer, C. A. M., and Brand, W. A.: Gas chromatography/isotope-ratio mass spectrometry method for high-precision position-dependent15N and18O mea-surements of atmospheric N2O, Rapid Commun. Mass Spec-trom., 17, 1897–1908, doi:10.1002/rcm.1132, 2003b.
R¨ockmann, T. and Levin, I.: High-precision determination of the changing isotopic composition of atmospheric N2O
from 1990 to 2002, J. Geophys. Res., 110, D21304, doi:21310.21029/22005JD006066, 2005.
Sch¨afer, H.: Meterologische Analyse f¨ur Spurengasmessungen am Observatorium Izana (Teneriffa) unter Verwendung von R¨uckw¨artstrajektorien, Physik, Universit¨at Mainz, Mainz, 1998. Schaefer, H., Whiticar, M. J., Brook, E. J., Petrenko, V. V., Ferretti, D., and Severinghaus, J.: Ice Record ofδ13C for Atmospheric CH4Across the Younger Dryas–Preboreal Transition, Science,
313, 1109–1112, doi:10.1126/science.1126562, 2006.
Schmitt, J., Schneider, R., and Fischer, H.: A sublimation technique for high-precision measurements ofδ13CO2and mixing ratios of
CO2and N2O from air trapped in ice cores, Atmos. Meas. Tech.,
4, 1445–1461, doi:10.5194/amt-4-1445-2011, 2011.
Sowers, T.: N2O record spanning the penultimate deglaciation from
the Vostok ice core, J. Geophys. Res., 106, 31903–31914, 2001. Sowers, T.: Late quaternary atmospheric CH4 isotope record
suggests marine clathrates are stable, Science, 311, 838–840, doi:10.1126/science.1121235, 2006.
Sowers, T.: Atmospheric CH4 isotope records
cover-ing the Holocene period, Quat. Sci. Rev., 29, 213–221, doi:10.1016/j.quascirev.2009.05.023, 2010.
Sowers, T., Rodebaugh, A., Yoshida, N., and Toyoda, S.: Extending records of the isotopic composition of atmospheric N2O back
to 1800 AD from air trapped in snow at the South Pole and the Greenland Ice Sheet Project II ice core, Global Biogeochem. Cy., 16, 1129, doi:1110.1029/2002GB001911, 2002.
Sowers, T., Alley, R. B., and Jubenville, J.: Ice core records of at-mospheric N2O covering the last 2000 years, Science, 301, 945–
948, doi:10.1126/science.1085293, 2003.
Sowers, T., Bernard, S., Aballain, O., Chappellaz, J., Barnola, J. M., and Marik, T.: Records of theδ13C of atmospheric CH4over the last 2 centuries as recorded in Antarctic snow and ice, Global Biogeochem. Cy., 19, 493–503, doi:2010.1029/2004GB002408, 2005.
Spahni, R., Chappellaz, J., Stocker, T. F., Loulergue, L., Hausam-mann, G., Kawamura, K., Fl¨uckiger, J., Schwander, J., Raynayd, D., Masson-Delmotte, V., and Jouzel, J.: Atmospheric methane and nitrous oxide of the late Pleistocene from Antartic ice cores, Science, 310, 1317, doi:10.1126/science.1120132, 2005. Vigano, I., van Weelden, H., Holzinger, R., Keppler, F., McLeod,
A., and R¨ockmann, T.: Effect of UV radiation and tempera-ture on the emission of methane from plant biomass and struc-tural components, Biogeosciences, 5, 937–947, doi:10.5194/bg-5-937-2008, 2008.
Vigano, I., R¨ockmann, T., Holzinger, R., van Dijk, A., Keppler, F., Greule, M., Brand, W. A., Geilmann, H., and van Weelden, H.: The stable isotope signature of CH4emitted from plant ma-terial under UV irradiation, Atmos. Environ., 43, 5637–5646, doi:5610.1016/j.atmosenv.2009.5607.5046, 2009.
Vigano, I., Holzinger, R., Keppler, F., Greule, M., Brand, W. A., Geilmann, H., van Weelden, H., and R¨ockmann, T.: Water drives the deuterium content of the CH4
emit-ted from plants, Geochim. Cosmochim. Act., 74, 3865–3873, doi:10.1016/j.gca.2010.03.030, 2010.