A STUDY OF SALT TOLERANCE OF FOUR
VARIETIES OF WHEAT*
BY R. D. AsANA AND V. R. KALE:!:
Dirision of Botanv, Indian A!{ricultural Research Institute, New Delhi UPPAL (1962) estimated that about a million and a half acres of agri-cultural land in India are affected by accumulation of salts, about half of the area being found in the. Punjab and Uttar Pradesh. . Russell (1950) pointed out that "losses of 20 per cent. or more of yield of the crop can be due to salts without salt damage being apparent to the farmers ". While adoption of soil amendment practices is the obvious remedy, it may not always be practicable to implement these due to non-availability of suitable quality of water for leaching, difficulty of adequate drainage and the high cost involved in these operations.
Under such circumstances the use of suitable agronomic practices and selection of well-adapted crops or varieties assume significance.
Differences between species and varieties in regard to salt tolerance have been reported (cf. Parija, 1940; Ayers et a!., 1952; Forsberg, 1953; Kobayashi, 1954; Pizer, 1954; U.S. Salinity Laboratory, 1954; Bernstein and Hayward, 1958; Hayward and Bernstein, 1958; Mehta and Desai, 1959). Although considerable work has been done on the physiology of salt tolerance, no definite suggestion has so far emerged regarding a reliable basis for selection of varieties (cf Bernstein and Ayers, 1951, 1953; Ayers et a!., 1951; Bhatnagar and Murty, 1960). Henckel and Strogonov (1961) and Repp (1961) described tests for select-ing plants and varieties on the basis of protoplasmic resistance to salt injury, but so far as the writers are aware, the possibility of their application to selection of varieties has not been demonstrated.
As salts do not produce the same degree of injury at different stages of growth (Ayers et
at.,
1951; Ogo and Sasai, 1955; Ota and Hayashi, 1956; Shimoya and Ogo, 1956; Pearson, 1959) it may be expected that "growth analysis", along with a study of the uptake of nutrients, might reveal differential varietal tolerance at critical growth stages (Asana, 1961). In fact such an approach has been attempted recently by Greenway (1962 a and 1962 b), which has yielded promising results for barley.*
The data incorporated in this article formed a part of the thesis submitted by one of us (V. R. K.) and approved in partial fulfilment of the requirements for th~ Ph.D. Degree of LA.R.I., New Delhi.6 R. D. ASANA AND V. R. KALE
In the experiments reported here, a study was made on the effect of salts on tillering, dry matter production, leaf area, uptake of phos-phorus, potassium, sodium and calcium, and on ear characters of four varieties of wheat.
EXPERIMENTAL PROCEDURE
Wheat plants were raised in earthen pots, each with a capacity to hold about 10 kg. of air-dry soil. The soil was mixed with
t
kg. of well-rotted compost. Four wheat varieties (Triticum aestivum),Pbc 281, N Ps 718, 823 and 824 were used in the seasons 1960-61 and 1961-62. Sowings were done on 11-11-1960 and 14-11-1961 respec-tively in the two seasons. About a fortnight after sowing, six uniform seedlings were r. tained per pot, which was fertilized a week later with one gm. each of ammonium sulphate, potassium sulphate and single superphosphate. Another gm. of ammonium sulphate was applied at
the boot-leaf stage.
The salinisation of the soil was commenced about three weeks after sowing with the addition of one litre per pot of a solution of equal parts of calcium chloride and sodium chloride (5,000 ppm for the low-salt level S1, and 10,000 ppm for the high-salt level SJ. These salt treatments were repeated at weekly intervals up to the time of maxi-mum tillering; thus, in 1960-61 five applications of the two salt levels were made. In 1961-62 the low salt treatment (S1) was omitted and only high salt treatment (S2) was given. Two more salt applications were also made during this season, one at the boot-leaf stage and the other at the time of ear emergence. The unsalinised (S0) pots were also watered with one litre of water every time the salt solution was applied.
The salinity status of the first 6" depth of the soil in the pots was determined after the third and the fifth applications in 1960-61. [t was estimated by determining the electrical conductivity in millimhos/cm. at 25° C. of 1: 2 soil extract on solubridge. This value was converted for the saturation percentage of the soil (the latter being determined by the sticky point) by the following formula, as suggested by Jackson (1958):
E.C. sat. extract = E. C. I : 2 extract 200
moisture in the soil at saturation.
Growth observations.-Tiller counts were taken in all the pots up
to the maximum tillering stage.
SA.LT TOLERANCE OF Wl-iEAT 7
When the four leaves on the main shoot started yellowing the num-ber of yellow leaves was counted from time to time until maturity. From these data the change in time of the percentage greenness of leaves on the main shoot was worked out.
Plant samples.-Sample 1 was collected on 14-12-1960, on the
33rd day after sowing when tillering just commenced. Twelve seed-lings cut at the base of the stem from two pots under each treatment were divided into four lots of three seedlings each (4 replicates). They were then dried in an oven at 90o C. to constant weight. The second sample was collected on 12-1-1961, at the maximum tiller stctge (62 days after sowing). Two pots per treatment were harvested for the purpose and the laminc:e were separated from the sheaths and both were dried separately. The third sample w1s collected at the time of ear emergence and as such the dates of sampling were as follows:
NP 823 16-2-1961
Pbc 281 18-2-1961
NP 711\ 21-2-1961
NP 824 28-2-1961
Three pots per treatment were harvested and the plants were separated into flag leaves, remaining leaves, stems and ear and dried.
At maturity the remaining thirteen pots per treatment were har-vested for final grain and straw weight. Observations on final ear num-ber, grain number per ear and I 000 g~ .1in weight were also recorded.
Chemical analysis.-Phosphorus was estimated by the method
described by Koeing and Johnson (1942). Potassium and sodium were estimated by the flame photometer. Calcium was estimated according to the method of Cheng and Bray ( 1951 ).
EXPERIMENTAL RESULTS
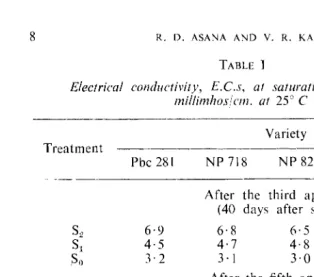
The level of salinity was determined after the third and fifth appli-cations in the 1960-61 experiment. The relevant data are given in Table I. Lt may be concluded that the four varieties were exposed to more or less similar salinity stress.
Tillering.-Weekly tiller counts were taken up to the maximum
tillering stage in the two seasons and the main effects of variety and salinity were found to be significant at each stage. The data at the maximum tillering stage alone are, however, presented in Table II. It may be concluded that tiller production was much less in the 1961-62 season than in 1960-61. The order of varieties changed slightly during the second season, and increase in salinity depressed tillering.
Dry matter.-Samples for dry weight of shoots were taken at the
8 R. D. ASANA AND V. R. KALE
TABLE 1
Electrical conductivity, E.C.s, at saturation percentage in mi11imhos/cm. at 25° C
Variety Treatment
Pbc 281 NP 718 NP 823 NP 824 Mean
-
-After the third application
(40 days after sowing)
s2
6·9 6·8 6·5 6·7 6·7sl
4·5 4·7 4·8 4·3 4·6~0 3·2 3 ·I 3·0 2·9 3·0
After the fifth application (maximum tillering stage)
s2
9·5 9-8 9·7 9·8 9·7sl
6·8 6·8 6·7 6·8 6·7So 3·3 3·4 3·5 3·4 3·4
TABLE II
Effect o{ interaction of l'ariety and salinity on mean maximum ti1!er number per pot
~---~-
-Variety Treatment
Pbc 281 NP 718 NP 823 NP 824 Mean
1960-61
s2
27 ·I 41·4 27·2 34·3 32·3sl
30·9 42·1 28·9 37·1 34·7So 35·5 43·0 28·2 38·9 36·4
Mean 31·1 42·2 28 ·] 36·7
1961-62
s2
25·2 31·3 22·1 30·2 27·2So 27·4 32·4 28·3 36·2 31·1
Mean 26·3 31·9 25·2 33·2
1960-61 1961-62
L.S.D. at 5% P for variety 1·9 2·1
L.S.D. at 5% P for treatment 1· 7 1· 5
SALT TOLERANCE OF WHEAT 9
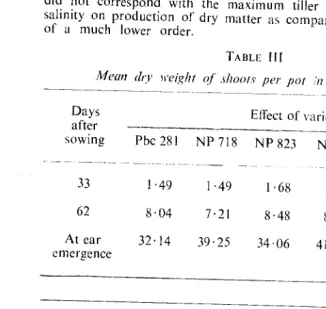
tiller number (62 days after sowing) and at the time of ear emergence in 1960-61. The effects of variety and salinity were significant on all these occasions, but that of interaction was not significant, and, therefore, data on the mean effects of variety and salinity only are presented in Table Ill. lt will be seen that dry weights per pot of the four varieties did not correspond with the maximum tiller number. The effect of salinity on production of dry matter as compared to tillering was also of a much lower order.
TABLE III
Mean dry weight ol shoots per pot :n gm ( 1960-61)
----~~~-~--- --- - · - - - · - - ---
---·---Days Effect of variety
after
sowing Pbc 281 NP 718 NP 823 NP 824 L.S.D. at 5% P
- - · -
~---·----
---33 1·49 1·49 1· 68 I· 52 0· 12
62 8·04 7·21 8·48 8·90 0·33
At ear 32· 14 39·25
emergence 34·06 41·72 1·92
Effect of salinity
s~
sl
Sn--- -
-33 1·48 I· 56 I ·64 0·09
62 7·93 7·95 8·60 0·28
At ear 35·53 36·60 38·24 I ·63
emergence
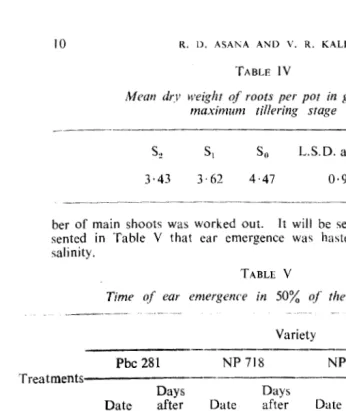
The dry weights of roots at the time of maximum tiller number were also determined. The effect of salinity alone was significant and the relevant data are given in Table IV. The root weight was signifi-cantly reduced at the S2 level and the depression in root weight was much greater than in shoot weight.
Time ol ear emergence.-Observations were made daily on the
10
R. D. ASANA AND Y. R. KALETABLE IV
Mean dry weight of roots per pot in gm. at the maximum tillering stage
L.S. D. at 5% P
3·43
3·62
4·47
0·93
ber of main shoots was worked out. It will be seen from the data pre-sented in Table V that ear emergence was hastened with incr<:ase in salinity.
TABLE
v
Time of ear emergence in 50% of' the main shoots
Pbc
281
Treatments---Date
Days after sowing
- - -
-Variety
NP 718
NP 823
NP 824
Date
Days after sowing
Date
Days after sowing
Date
Days after sowing
S
25-2-1961
86
5-2-1961
86
2-2-1961
83
I0-2-1961
61
s,
7-2-1961
88
7-2-1961
88
3-2-1961
84
12-2-1961 93
S
119-2-1961
90
8-2-1961
89
6-2-1961
87
14-2-1961 95
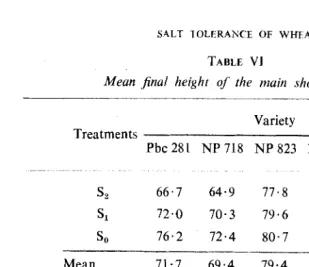
Plant height.-The data on the effect of salinity on the final height of main shoots (from ground level to the base of the ear), given in Table VI, show that height decreased with increase in salinity and that it was not significantly reduced by salt treatment in variety NP
823.
Leaf area on main shoot.-Approximately four green leaves were present on the main shoot after ear emergence. The lengths and widths of these leaves were measured. As the data are voluminous, the mean effects of variety and treatment on mean leaf length and width only are presented in Table VII. Both length and width of leaves decreased progressively with increasing salinity.
Leaf area duration.-The effect of the salt treatments on the
inter-SALT lOLERANCE OF WHEAT
TABLE VJ
Mean .final height of the main shoot in em
Variety
Treatments -Pbc 281 NP 718 NP 823 NP 824 Mean
s2
66·7 64·9 77·8 73·7 70·8sl
72·0 70·3 79·6 81·8 75·9So 76·2 72·4 80·7 84·1 78·4
Mean 71·7 69·4 79·4 79·9
L.S.D. at 5% P for variety 1·8 L.S.D. at 5% P for treatment 1·6 L.S.D. at 5% P for interaction
..
3·2TABLE VII
Effect of variety and salinity on mean length and width of.four leaves on main shoot
Variety
11
Pbc 281 NP718 NP823 NP824 L.S.D. at 5% P
----~---·-·"-
-Length
in em 13·6 12·7 16·9 16·5 0·40
Width
in em 1·08 1·08 1·10 1·08 0·01
Salinity levels
s2
sl
So L.S.D. at 5% PLength
in em 14·1 14·9 15·7 0·37
Width
12 R. D. ASA~A AND \'. R. KALF
vals. From these values the percentage of green leaves was calculated at different times. These percentages were plotted against time and the area under each curve was measured. The values of the areas under the two higher salinity levels relative to that of control (100) are pre-sented in Table VIII. It would appear that the rate of senescence increased with increasing salinity and that the salt tolerance of varieties decreased in the order NP 823 = NP 824
>
Pbc 281>
NP 718.TABLE VIII
Eff"cct ()f" salinity 011 leaf-area duration on main shoot
Variety Treatments
Pbc 281 NP 718 NP 823 NP824
s2
79·8 57·7 92·9 87·8sl
83·9 72·3 88·9 96·4So 100·0 100·0 100·0 100·0
Uptake l~[ nutrients.-The effect of salt treatments on the uptake
of phosphorus, potassium, calcium and sodium was of a much larger order than that of variety and as such the main effects of salt treatments on nutrient uptake only are presented in Table lX. It may be concluded that up to the time of maximum tillering the uptake of phosphorus, sodium and calcium increased with salinity, whereas that of potassium was unaffected. At ear emergence, the plants of the S2 treatment had
higher sodium content than those of the S0 treatment. A similar, though statistically insignificant. effect was seen on the uptake of phosphorus and calcium.
The effects of salt treatments on the percentage content of K, Na and Ca are presented in Fig. I. It will be seen that in leaves the per-centage of potassium decreased with time at all three salt levels. The percentage content of sodium increased up to 62 days after sowing and thereafter remained constant. The percentage of calcium slightly decreased between 33 and 62 days at S0 and S1 levels and thereafter remained constant. More or less similar trends were seen in the stem.
It appears that with time, the relative proportion of sodium to potassium increased in both leaves and stem.
Grain yields.-The data on grain yield are given in Table X. lt
SAL! loLEkAt'CI oi- WHEAi
13
TABLE IX
Mineral content of' the aerial parts per pot in mg
Treatment
Days after sowing
33 62 At ear
emergence
-Phosphorus
s2
6·7 24·8 71· Isl
6·4 22·5 64·5So 6·4 15·7 59· I
L.S.D. at 5% P 2·0 Not
significant
Potassium
s~ 70 254 628
sl
73 261 619So 75 265 654
L.S.D. at 5% P Not Not
significant significant
Calcium
s~ 14·3 52·3 125·6
sl
14·3 45·2 102·0Su 13·3 36·0 91· 7
L.S.D. at 5% P 3·4 Not
significant
Sodium
s~ 2·5 17 ·I 99
sl
I ·6 16·2 80So I· 8 12·9 72
L.S. D. at 5% P 3·0 20
(iii) since the effect of interaction was not significant, all the four
varieties suffered equally at the highest salt level. It is, however,
noteworthy that NP 823 suffered the least from salinity, although statistical analysis does not show the interaction to be significant.
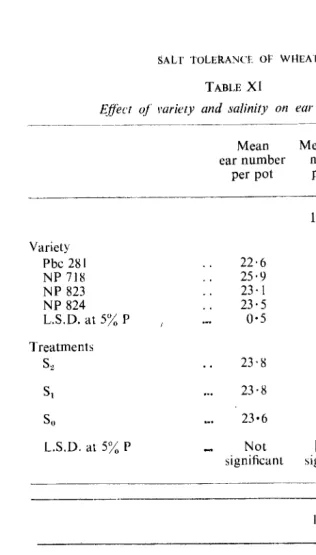
The effect of salinity on the three components of yield may now be examined. The data on ear number per pot, grain number per ear
and 1000-grain weight are given in Table X I. It will be seen that out
14
R. b. ASANA AND V. R. KAtE TABLE XMean grain yield in gm per pot
Treatment Variety
1960-61
Pbc 2g1 26·66 30·69 NP 718 27·97 31·08
NP 823 29·06 29·11
NP 824 28·80 32·43
Mean 28·13 30·82
L.S.D. at 5% P for treatments
L.S.D. at 5% P for varieties
L.S.D. at 5% P for interaction
Treatment Variety
1961-62
Pbc 281 21·70 24·60 NP 718 24·60 26·80
NP 823 26·20 26·70
NP 824 21·30 24·30
Mean 23·41 25·50
(92) (100)
L.S.D. at 5% P for treatments
L.S.D. at 5% P for varieties
L.S.D. at 5% P for interaction
Mean
31· 37 29·57 30·64 29·90 29·62 29·26 31·65 30·96
30·82
2·04
Not significant
Not significant
1. 35
1 . 91
Mean
23·10 25·71 26·42 22·53
SALT tOLEltANCf: OF Wl-tEA'l
15
TABLE XI
Effect of l'ariety and salinity on ear characters
,~-·--- - - · ·
Mean Mean grain Mean 1000-ear number number gra!n weight
per pot per ear m gm
1960-61
Variety
Pbc 281 22·6 29·4 45·0
NP 718 25·9 24·3 34·3
NP 823 23·1 26·4 48·1
NP 824 23·5 33·1 39·8
L.S.D. at 5% P 0·5 1·6 0·7
Treatments
s2
23·8 30·4 40·3sl
23·8 31· 6 42·0Su 23•6 30·5 43·1
L.S.D. at 5% P Not
F
Not 0·6significant significant
----~----~
1961-62
Variety
Pbc 281 17· 1 29·6 44·8
NP 718 20·8 35·1 35·9
NP 823 20·6 26·5 47·3
NP 824 16·4 32·4 41 ·8
L.S.D. at 5% P I· 5 I· 5 0·8
Treatments
s2
18·7 31·2 41·7sl
18·9 30·6 43•3L.S.D. at 5% P Not Not 0·6
16 IC D. ASANA ANb V. R. KALE
1·1 LEAVES 0'40 STEM
1·0
c~0·3s
Ca.\
0-9
~::.
~
0'8
0·7 020
0·6 015
i/5-
No./;
0·2 025
0·20
0·15
K
4 3•5
2·5
2 ' - ' - - - - ' - - - _ _ J
33 62 90 I· 5 '---::~-=-'----' 33 62 90
OAYS FROM SOWING
Ftc;. I. EfTects of salt treatments on the 0
0 content of K, Na and Ca of leaves
and stem at various stages of growth. x - x - S1 ; 0 - 0 S,;
e- e
' 0 S2 •
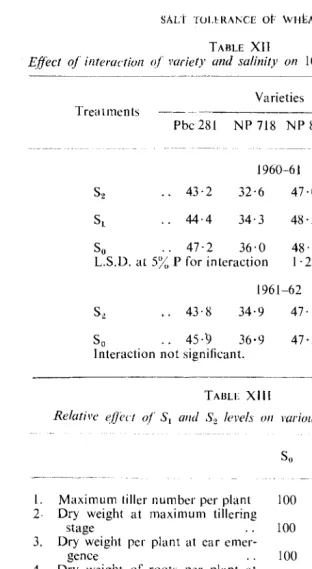
grain yield was affected by salinity due to the adverse effect of the latter
on 1000-grain weight. The etTect of interaction salt level X variety on
1000-grain weight was also significant as can be seen from the data
pre-sented in Table XII. It would appear that among the four varieties
NP 823 suffered the least in 1000-grain weight due to salinity.
DISCUSSION
As the four vaneties were influenced alike by salinity, the main features of their average response will be considered in what follows.
The effects of salinity on various growth attributes are summarised
SALt TOU RANCE o~· \VHEA'l
17
TABLE XII
Effect of interaction of variety and salinity on 1000-grain weight in f<ni. · - - - ·
-Varieties
Treatments
--~---Pbc 281 NP 718 NP 823 NP 824
1960~61
43·2
44·4
32·6 47·0
34·3
S0 47·2 36·0
L.S.D. at 5% P for interaction
48·5
48·7 1·2
1961~62
43·8 34·9 47·1
S0 45·9 36·9 47·5
Interaction not significant.
TABLE XIII
38·2
40·7
40·6
40·9
42·6
Relative effect of
sl
ands2
leFels 0/1 various groll'th attributesSo
sl
s?
·----~--
~---l. Maximum tiller number per plant 100 95 b9
2- Dry weight at maximum tillering
stage 100 96 93
3. Dry weight per plant at ear
emer-gence 100 96 93
4. Dry weight of roots per plant at
maximum tillering stage
too
82 775.
Ear number per plant 100 100 1006. Spikelet number per ear 100 98 95
7. Grain number per ear 100 100 100
8. 1000-grain weight 100 97·5 93·5
9. Grain yield 100 100 90
lO.
Final height of main shoot 100 97 90II. Straw weight per plant 100 99 88
12. Leaf area duration on mam axts
during post-anthesis period 100 85 79
18 R. D. ASANA AND V. R. KALI:
According to Bernstein and Hayward (1958), efiects on plant growth of high concentrations of soluble salts in the root medium may be me-diated by osmotic inhibition of water absorption, by specific effects of the constituent ion(s) in the saline media, or a combination of the two. Furthermore, specific ion effects may involve direct toxicity or a variety of nutritional effects. In our experiments tillering and dry matter pro-duction were significantly depressed at
sl
ands2
levels on the 30th day after sowing and ten days after the first application of the salts. These and some of the subsequent adverse effects, as detailed in Table XIII, appear to be similar to those usually associated with water stress. The shoot/root ratio, however, increased and the spikelet number per ear was little affected, with increase in salinity (cf Tables [V and Xlll). Eaton (1942), and Bernstein and Pearson (1954) regarded decrease in topfroot ratio with increase in salinity to be a significant feature in the adjustment of a plant to salinity inasmuch as the proportion of water-absorbing to transpiring organs is thereby increased. Although decrease in shootjroot ratio has been regarded as a typical response to soil moisture stress (cf Miller, 1938; May and Milthorpe, 1962). Williams and Shapter (1955) observed that the immediate response to water stress was an increase in shoot/root ratio, this effect being later reversed in barley but not in rye. Greenway (1962 b), however, found that the shoot/root ratio decreased with· increase in salinity during the first 10 days, but was similar to the control at the end of another 5 days. In view of this inconsistent effect of water and salt stress on shoot/root ratio, it is difficult to decide whether the increase in shoot/root ratio, in our case, was a response to water stress alone or also to some nutri-tional unbalance. The negligible effect of salinity on the differentiation of spikelet priomordia was referred to earlier. Greenway (1962 a)mentions the finding of Gates that primordial initiation in lupins was inhibited by moderate water stresses, but not by salinity treatments. It seems, therefore, reasonable to think that water stress alone was not involved in the various salinity effects.
Our data show that K/Na and K/Ca ratios decreased and P content increased with increase in salinity (cf Fig. 2). The uptake of K was, however, not depressed. Greenway ( 1962 a) also found a similar effect in barley, although in his case the uptake of K decreased. With increase in salinity these ratios decreased much less in the stem (leaf-sheaths, unemerged leaves, ear primordium and stem) and ear (when emerged) than in leaves. Greenway (1962 a) also states that the inflorescence in barley was better protected against an ion unbalance of the substrate. It would appear that the differential tolerance to salinity of the different stages of development may partly be due to tendency of growing tissues to accumulate less of sodium (and also chlorine) as the present data and those of Greenway (1962 b) would suggest.
SALT roUJtA NeE OF \Vi iiAi
(1959), whereas salt stress appears to increase it (cf present data; Fine and Carson, l 954; Shimose, l 957; Ehrler and Bernstein, 1958). We have no suggestion to offer at present as to how increase in the up-take of P is related to the adverse effect of salt on growth. A study of phosphorous metabolism may perhaps prove useful in this connection.
s
K/Co.~.0 EAR
5
K/ca.
0 STEM
5
K
/ca.
0 LEAVES
10
K/Na.
0 E AR
10
KINo.
0 5 T I[ I'll
20
10
KINa.
0 LEAVES
33
DAYS SOWING
FIG. 2. Ratios of m. cquiv. "i, (of dry weight) of K/Na and K/Ca in leaves, stem and ear at different stages of growth. D ~ S0 ; ~ = S1;
8
= S,.Among the ear characters contributing to grain yield, 1000-6rain weight was significantly depressed at the highest salt level. Since grain development largely depends upon current photosynthesis, and the reduction in leaf-area duration was more strongly affected than the 1000-grain weight, it is possible that the photosynthetic activity of the ear was affected much less by salinity. This observation is relevant to the so-called quick tests for assessing varietal response to salinity. For instance, according to Henckel and Strogonov ( 1961 ), salt tolerance in cotton could be assessed by the extent of salt burn spots on leaves with petioles standing in 0· I M KCI or KzSO, solution in direct sunlight. A similar test did differentiate NP 7 I 8 as the most susceptible among the four varieties used by us; but as already stated its grain yield was not inferior to that of the other 3 varieti~s under saline conditions.
20
IC D. ASA~A ,,l\[) \'. R. KAIEAcKNOWLEDGEMENT
Our thanks are due to Dr. M. S. Swaminathan. Head of the Division of Botany, for providing facilities and encouragement in this investigation.
SuMMARY
Four vanet1es of wheat, NP 718. NP 823. NP 824 and Pbc 281, were compared for their salt toler;;:nce during two seasons. The
sali-nity levels (with the addition of NaCl and CaCl~) varied, in terms of
electrical conductivity, as 3 · 4 (S0 ). 6 · 7 (S1 ) and 9 · 7 (SJ mmh./cm. at
25'' C. The varieties did not show any consistent differential response
to salinity. The root growth wa> depressed relatively more than shoot growth. Tillering, leaf size. shoot height, 1000-grain weight and grain yield were depressed by about 10 per cent. The uptake of K was not atTected and that of Na, Ca and P was increased. The ratio KINa decreased in the order leaves> stem (including leaf-sheaths)> ear,
thus indic<Jting differential response of these tissues to nutrient
unbalance. It is suggested that this physiological difference may be
related to the small effect of salinity on the number of spikelets and
grains. The depressing effect of >alts on 1000-grain weight is
attri-buted to hastening of senescence <Jnd the associated reduction in photo-synthetic activity. Since salt stress appears to affect considerably the
ionic compositicn of the plant, it is sugge~ted that the differential
up-take of various ions by the tissues of ditTerent organs requires a more critical study for the assessment of salt tolt:·nmce.
REHRI::NCIS
i\SA:"A. R. D. ( 1961 ). Physiological problems concerning crop production under qline conditions in India. Salinity problems in Arid Zones. Proc. lHmm s~·mt'osium, UNFSCO, Paris, I R I 83.
AvrRS, A. D. W ADLCILiH, C. H. AND BERNSHII', L. ( 1951 ). Salt tolerance of six varieties of lettuce. Proc. An1er. Soc. Hort. Sci .. 57, 2.17-42.
---. BROWN. J. W. AND WADLI·KiH, C. H. (1952). Salt tPierance of barlcv and wheat in soil plots receiving several saliniration regimes. Agron . .lrno: .. 44, 307-10.
BERNSTEIN. L. AND AYlRS, A. D. ( 1951 ). Salt tolerance of six varit·Iics of green beans.
Proc. A mer. Soc. Hort. Sci .. 57, 243 4R.
___ AND---- (1953). Salt tolerance of tive varieties of carrots. /hid., Iii, 360-66. - - AND HAYWARD, H. L ( 1958). Physiology of salt tolerance. A1111. Rn. 1'/.
Phniol., 9, 25-46.
--- AND PEARSON, G. A. ( 1954). The inRuencc of integrated soil moisture stress achieved by varying the osmotic pressure of culture solutions on growth of tomato and pepper plants. Soil. Sci., 77, 355-68.
SAL1 TOLERANCE OF WHEA1 21
CHENG, K. L. AND BRAY, R. H. (1951). Determination of calcium and magnesium in soil and plant material. Soil Sci., 72, 449-58.
EATON, F. M. (1942). Toxicity and accumulation of chloride and sulphate salts in plants. Jour. Agr. Res., 64, 357-99.
EHRLER, W. AND BERNSTEIN, L. (1958). Effects of root temperature, mineral nutri-tion and salinity on the growth and composinutri-tion of rice. Bot. Gaz .. 120, 67-74.
FINE, L. 0. AND CARso:-~. P. L. ( 1954). Ph~1sphorus needs of snnll grains on a
moderately saline soil. Proc. An;a. Soc. Soil. Sci., 18, 60 63.
FoRSBERG, D. E. ( 1953). The response of various forage <.:rops to saline soils.
Canad. Jour. Agric. Sci.. 33, 542-49. GATES, C. T. AND BoNNER, J. ( 1959).
period of water shortage. IV.
metabolism of tomato leaves.
Response of the young tomato plant to a brief
Eff~cts of water stress on the ribonucleic acid
Plant Physiol., 34, 49-55.
GREENWAY, H. (1962a). Plant response to saline substrates. I. Growth ·and ion uptake of several varieties of Hordeum during and after sodium chloride treat-ment. Austral. Jour. Bioi. Sci., 15, 16-38.
---~ (1962 h). Plant response to s:1line substrates. II. Chloride sodium and potassium uptake and translocation in young plants of Hordeum vulgare during and after a short sodium chloride treatment. !hid., 15, 39-57.
HAYWARD, H. E. AND BERNSTEI:-.1, L. (1958). Plant growth relationships on salt-affected soils. Bot. Rei'., 24: 584-635.
HENCKEL, P. A. AND STROGONUY, B. P. ( 1961 ). Physiology of plants consuming saline water. Salinity problems in Arid Zones. Proc. Tehran Symposium, UNESCO, Paris, 145-51.
JAcKSON, M. L. (1958). Soil Clll!mical Analysis. Prentice-Hall, Inc., Englewood, Califfs. N.J., 498 pp.
KOI!AYASHl, T. ( 1954). Studies on salt resistance of cultivated plants. Proc. Crop. Sci. Soc. .Iapan, 22, 36-38.
KOE!NG, R. A. AND JoHNSON, C. R. ( 1942). Colorimetric determination of phos-phorus in biological products. lnd!ll't. Engg. Chem. Anal. Ed., 14, 155--64.
MI.HTA, B. Y. AND DESAI, R. S. ( 1959). Salt tolerance studies. Effect of soil salinity on the growth and chemical composition of plants~! and II. Jour. Soil and
Water Conserv. i11 India, 7, 101-15.
!'v!AY, L. H. AND MtLTHORP~. F. L. (1962). Drought resistance of crop plants.
Field Crop Ahst., 15, 1-9.
MtLLER, E. C. ( 1938). Plant Phrsiology. 2nd Edition. McGraw. Hill Book Co.
Inc., New York, 123 pp.
0Go, T. AND SASAI, K. (1955). Studies on the saline injury on crops. 1-11. The effect on the growth and on the maturity of wheat as produced by the saline water irrigation at ear formation period. Sci. Rep. Fac. Agr. Okayama Univ., 6, 43-50. OrA, K. AND HAYASHI, H. (1956). Studies on the salt injury to crops. IX. Effect of sodium chloride on the root development of yourng wheat plant. Fac. Agr, Gifu Univ. Res. Bull., 6, 21-27.
PARI.! A, P. ( 1940). An11ual Report of Rice Research Scheme, Orissa.
22 R. D. ASANA \ND V. R. KALE
PIZER, N. H. (1954). The coastal floods of January-February 1953. An account of soil and crop problems which followed in the Eastern Province. Agric. Progr.
29, 34-53. (Field Crop Abstract, 921, 1956.)
REPP, GERTRUDE (1961). The salt tolerance of plants. Basic Research and Test salinity problems in Arid Zones. Proc. Tehran Symposium, UNESCO, Paris,
153-61.
RussELL, E. J. (1950). Soil Conditions and Plant Growth. Longmans, Green and Co., London. 635 pp.
SHIMOSE, N. (1957). Distribution of P32 in rice plants grown in chloride excess
solu-tion. Sci. Rep. Fac. Okayama Univ., 10, 25-28.
SHIMOYA, T. AND Ooo, T. (1956). Studies on the saline injury on crops. IT. On the effects of the growth and the harvest of the rice plant as produced by the saline irrigation at different growing periods. Okayama Prof Agr. Exp. Stn. Spec. Bull., 54, 21-28. (Quoted from Hayward and Bernstein, 1958.)
UPPAL, H. L. (1962). Reclamation of saline and alkali soils. Land Reel. Jrrig. Res. lnst. Punjab Pub/., 47.
U.S. REGIONAL SALINITY LABORATORY STAFF (1954). Diagnosis and improvement of saline and alkali soils. U.S. Dept. Agr. Agri. Handbook, 60, 160 pp. WILLIAMS, R. F. AND SHAPTER, R. E. (1955). A comparative study of growth and