2002 Annual Statistics Report
Secondary Education
Secondary Schools in Vanuatu
0 2 4 6 8 10 12 14
Torba Sanma Malampa Penama Shefa Tafea
N
o
.
o
f
S
c
h
o
o
ls
Anglophones Francophones
Division of Policy and Planning Services
October 2002
Acknowledgement
The Division of Policy and Planning Services in the Department of education wishes to thank all secondary school Principals and all those who assisted in collecting data for publishing this report.
Word of thanks is also extended to Mr. Enock Léon (School Radio Program officer) for informing through radio messages the secondary school principals on the islands about the returns of the questionnaire. The Statistics section relies very much on radio messages due to difficulty in communicating directly with schools.
Preface
It is my great pleasure to submit the 2002 Secondary School Annual Statistical Report. This report has been successfully published in collaboration with the principals and teachers. The school radio program by Mr. Enock Leon has played a significant role in this part.
The data compiled would provide to all users and public at large information on statistics of each secondary school. The data is compiled using tables and graphical illustrations and analysed to ensure easy access to users.
Intentionally, this report is produced to meet short and long term demands of all users particularly planners of government and non-governmental organizations, and specifically the Ministry of Education and students to name a few.
Thank you all again who helped in one way or another and I look forward to your cooperation in similar future exercises.
Jesse Dick
Director
Table of Content
ACKNOWLEDGEMENT ... 2
PREFACE ... 4
INTRODUCTION ... 7
SECTION I:
SCHOOL INFORMATION ... 8
Table 1: Number of Schools by Province and by Medium of Instruction ... 8
Graph 1: Secondary Schools by Medium of Instruction ... 8
Tableau 1.1 : Number of Anglophone Schools by Administration ... 9
Graph 1.1 : Disaggregation of Anglophone Schools by Administration ... 9
Graph 1.1.1 : Disaggregation of Francophone Schools by Administration ... 10
Table 1.2: Rural secondary schools ... 10
Table 1.3 : Schools in Port Vila and Luganville ... 11
Graph 1.3.1: Urban Secondary Schools ... 11
Table 1.4 : Number of classes by Provinces and by Year ... 12
( Year : 10, 11, 12, 13 and 14). ... 12
Graph 1.4.1: Enrolment trend by Year ... 12
SECTION II:
STUDENT INFORMATION ... 13
Table 2.1: Number of Secondary school students by Province, 2002 ... 13
Graph 2.2: Student Percentage 2001-2002 ... 13
Table 2.4: Number of Students by Medium of Instruction and by Province. ... 14
Graph 2.4: Student percentages by gender – Anglophone schools ... 14
Graph 2.5: Student percentages by gender – francophone schools. ... 15
Table 2.5: Enrolment by Age and by Year level ... 15
Graph 2.5 : Secondary Enrolment – Official and unofficial ages. ... 16
Table 2.6: Number of Student by School Administration ... 16
Graph 2.6: Percentage of Student by school administration. ... 17
Table 2.7: Student Enrolment in Urban Schools. ... 17
Graph 2.7: Percentage of Students in both Urban and Rural Schools ... 17
Table 2.8: Enrolment Trend from 1992 to 2002 ... 18
Graph 2.8: Student Growth 1992-2002 ... 18
Table 2.9: Total number of repeaters by province ... 19
Table 2.10: Total number of dropouts in 2001 ... 19
Table 2.12: Total number of Transfers out, 2002 ... 20
SECTION III:
TEACHERS INFORMATION ... 21
Table 3.1: Teacher’s by Province and by Sex. ... 21
Table 3.2: Percentage of Teachers with Teaching Qualification. ... 21
Table 3.3: Student/Teacher Ratio ... 22
Table 3.4: Teachers Status ... 22
Table 3.5: Number of Teachers paid under Different School’s Administration. ... 23
CONCLUSION: ... 23
RECOMMENDATIONS: ... 24
ANNEX ... 25
Student by Province ... 26
Secondary School Teachers ... 27
Introduction
The Secondary School Annual Report is intended to assist users in particular planners identify and make important decisions to serve different needs of secondary education. According to this report, there are 59 schools of which 29 are government owned, 19 mission schools and 11 private schools. The total enrolment has increased by 10 percent this year.
The objectives of this report are as follows:
To identify the need to increase the number of schools.
To determine annual enrolment rates
To assist economise the education system
To identify if there is sufficient qualified teachers
To assist identify teachers who needed in-service trainings
To identify different problems frequently arising in schools
To determine the distribution and rationalisation of schools
This report has three (3) main sections; School Information, Pupil’s Information and Teacher’s Information. The analysis of the report is based on data extracted from the questionnaires we received from each secondary school. As in previous years, collection of returns from schools still remains incomplete, 25 percent of mostly private schools have not submit their entry report forms. The school principals and the department staffs must be motivated so that we better plan the collection of returns in terms of time and resources mobilization. The integrity of data is affected by incomplete returns and needed consideration.
This year questionnaires were sent directly to schools as a way to combat part of the problems. However, certain schools reported not receiving the questionnaires as expected. It is certain that there is communication difficulty because the islands are spread over the sea.
Section I:
School Information
In this section, information on secondary schools is illustrated using tables and graphs:
Table 1: Number of Schools by Province and by Medium of Instruction
Province Anglophone Schools
Francophone Schools
Total
Torba 1 0 1
Sanma 8 5 13
Malampa 5 5 10
Penama 7 2 9
Sherfa 12 5 17
Tafea 5 4 9
Total 38 21 59
The table above indicated that this year the total number of secondary schools increased from 57 to 59, which is an increase by 3.5 percent. The provinces of Sanma and Shefa are the beneficiaries of the increase. Generally, there is a fare distribution of schools in Sanma and Torba with regards to their population. The table also indicates that 65 percent are Anglophone secondary schools in the 6 provinces.
Graph 1: Secondary Schools by Medium of Instruction
The graph above justifies that there is no French secondary school in Torba. One major reason for not establishing a French JSS is because there are not enough feeder primary schools and also because class 6 enrolment is very low in existing French primary schools in Torba.
Secondary Schools
0 5 10 15
Torba Sanma Malampa Penama Shef a Taf ea
Tableau 1.1 : Number of Anglophone Schools by Administration
The above table shows the number of schools by type of administration. The government operates 29 schools, Catholic mission 8, Protestant 3 and SDA mission 2 schools. The following church denominations; Presbyterian, AOG, COC, Anglican and Holiness have on average 1 school each.
Eighteen out of 21 junior secondary
schools are complete stream from year 7 to 10. In the year 2003 it is possible to include year 11 classes
in some secondary schools. Analytically 12 classes of year 11 will be needed to adequately cater for
all out going year 10 students.
Graph 1.1 : Disaggregation of Anglophone Schools by Administration
Administration
Torba Sanma Malampa Penama Shefa Tafea Anglophone Francophone Total (A+F)
Govt (E) 1 3 5 4 5 3 21 21
Govt (F) 0 2 2 0 2 2 8 8
(F)
Catholic 0 1 2 2 1 2 8 8
assisted (F)
Protestant 0 2 1 0 0 0 3 3
assisted (F)
SDA 0 1 0 0 1 0 2 2
assisted (E)
Presbyterian 0 0 0 0 1 0 1 1
assisted (E)
Anglican 0 0 0 1 0 0 1 1
assisted (E)
C.O.C 0 0 0 1 0 0 1 1
assisted (E)
AOG 0 0 0 0 0 1 1 1
(E)
Holiness 0 0 0 0 1 0 1 1
(E)
Holiness 0 0 0 0 1 0 1 1
Total 1 13 10 9 17 9 38 21 59
Province Total
Anglophone schools by Administration 26%
54% 3%
3% 3%
5% 3% 3%
Govt (E) SDA Presbyterian Anglican
The above graph shows the distribution of Anglophone secondary schools by administration. The indicators show that the government has the majority of 54 percent of Anglophone secondary schools in the country followed by private administrations with 26 percent and other school authorities, which run 3 percent each of the school.
Graph 1.1.1 : Disaggregation of Francophone Schools by Administration
The pie chart above shows the general distribution of French secondary schools by type of administration. The government predominates the development of secondary education system followed by catholic mission with 40% followed by other church denominations.
Table 1.2: Rural secondary schools
The table above shows the number of secondary schools by island excluding schools in the urban areas of Luganville and Port-Vila. There is no proper rationalisation of schools in terms of population density of each island. The Ministry should take into account the population density of each island before coming into term of establishing a new secondary school.
Islands Torba Sanma Malampa Penama Shefa Tafea Total
Ambae 5 5
Ambrym 2 2
Aore 1 1
Efate 2 2
Epi 3 3
Maewo 1 1
Malekula 7 7
Malo 1 1
Paama 1 1
Pentecost 3 3
Santo 7 7
Tanna 9 9
Tongoa 1 1
Vanualava 1 1
Total 44
Francophone Schools by Administration
38%
38% 14%
5% 5%
Table 1.3 : Schools in Port Vila and Luganville
This table shows that 73 percent of secondary schools are located in Port Vila and 27 percent in Luganville. Administratively, the distribution is as follows:
54% of the schools are operating privately 33% are government own
And 13% are catholic schools
The high population in the urban areas induce the high percentage of student enrolment in private schools. At the recent 1999 National population census, 49 094 of the total population live in Port-Vila and Luganville.
Graph 1.3.1: Urban Secondary Schools
Municipalities Total
Anglophone Francophone Catholic Private (E) Private (F) Holliness (E) Holliness (F) Schools
Port-Vila 2 1 1 4 1 1 1 11
Luganville 1 1 1 1 4
Total 3 2 2 5 1 1 1 15
Government
Urban Schools
73% 27%
Port-Vila Luganville
Urban Schools by Administration
20%
13%
13% 33%
7%
7% 7%
Table 1.4 : Number of classes by Provinces and by Year
( Year : 10, 11, 12, 13 and 14).
The table above shows the number of classes by year. There is clear evidence that enrolment decreases up the latter of senior secondary cycle.
From year 10 to year 11, it decreases by 62% From year 11 to year 12, it decreases by 14% From year 12 to year 13, it falls by 10% From year 13 to year 14, it decreases by 12%
Graph 1.4.1: Enrolment trend by Year
The line graph indicates the decreases in senior secondary enrolment due to lack of available space in senior secondary schools. The Ministry must increase the number of classrooms in Senior Cycle according to the outcome of the student results especially after completing year 10, 11, 12, 13 and 14.
Province Year 10 Year 11 Year 12 Year 13 Year 14 Total
Torba 1 0 0 0 0 1
Sanma 10 3 3 2 0 18
Malampa 9 3 1 0 0 13
Penama 7 2 2 1 0 12
Shefa 15 8 5 4 1 33
Tafea 8 3 1 0 0 12
Total 50 19 12 7 1 89
School levels
Senior classroom s
50
1 7
12 19
0 10 20 30 40 50 60
Year 10 Year 11 Year 12 Year 13 Year 14
N
u
m
b
e
Section II:
Student Information
The information in this section is illustrated using tables and graphs:
Table 2.1: Number of Secondary school students by Province, 2002
This year enrolment rose from 8,746 to 9,610, which is a 10% increase on average. Below are specific percentage changes by province.
(-8%) unfortunately Torba indicates a decline from year 8, 9 and 10.
The enrolment in Sanma secondary schools increase by 18% due to the new establishment of year 7 at Saint Michel Technical School which admitted a total of 99 students in 2002.
Rensarie Junior Secondary School introduced two-year 11 classes and one year 12 class at Orap JSS which is administrated by the Protestant church. This increases enrolment by 19% in Malampa.
Penama province recorded an 8% increase due to the number of student in a new year 7 and the establishment of a new year 9 at Gambule Junior Secondary School.
There is a 5 percent increase in Shefa due to the introduction of year 8 in Central Secondary School, in Port-Quimie school on Epi and also in two other new schools, which were established in 2001.
Tafea province recorded a 5% increase due to a new year 11 at Tafea College and a new establish year 12 at Tafea Christian college and also due to the expansion of Lowanatom Technical school in 2001.
Graph 2.2: Student Percentage 2001-2002
Student Province Male Female Total 2001 percentage (%)
Torba 64 59 123 133 -8 Sanma 1123 1029 2152 1819 18 Malampa 713 654 1367 1150 19 Penama 733 722 1455 1343 8 Shefa 1703 1774 3477 3319 5 Tafea 492 544 1036 982 5 Total 4828 4782 9610 8746 10
Student 2002
2001 and 2002 Enrolm ent
0 1000 2000 3000 4000
Torba Sanma Malampa Penama Shefa Tafea
Province
n
u
m
b
e
r
Table 2.4: Number of Students by Medium of Instruction and by Province.
The above table shows the enrolment of secondary school students by medium of instruction. The total enrolment indicates that 60% of students enrolled in Anglophone secondary schools and 40% in francophone schools. The data by language of instruction illustrates the gap based on the number of students who enrolled in both Anglophone and francophone secondary schools in the country.
Graph 2.4: Student percentages by gender – Anglophone schools
The pie graph above indicates the number of students in Anglophone schools distributed by medium of instruction and by sex. The data collected shows that 51% are male and 49% are female students. The figures in table 2.4 also illustrate a near balance on the number of student by gender who enrolled in the Anglophone secondary schools.
Province
Anglophone Francophone Total
Male Female Male Female Male Female
Torba 64 59 0 0 64 59
Sanma 648 559 475 470 1123 1029
Malampa 325 318 388 336 713 654
Penama 625 615 108 107 733 722
Shefa 1021 1044 682 730 1703 1774
Tafea 282 268 210 276 492 544
Total 2965 2863 1863 1919 4828 4782
5828 3782 9610
Student
Percentage distribution of Anglophone student
51% 49%
Graph 2.5: Student percentages by gender – francophone schools.
The distribution of student in French schools by sex indicates that 49% are male students and 51% are female. The sharing of student in French medium schools by sex is vice versa to that of English secondary schools. In overall, however both graphs show that male students dominated the whole enrolment.
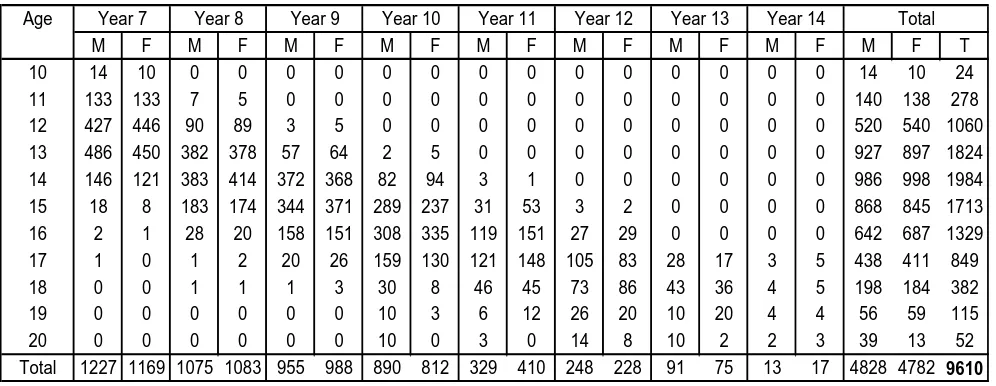
Table 2.5: Enrolment by Age and by Year level
Age is one of the important criteria for selection into secondary education. The above table shows the actual number of students in secondary schools by age and by year level. According to the secondary education policy, the official age to enter secondary school is (12-19 years old). Out of the actual total enrolment, which is 9610, only 9256 students have the required official age to be in a secondary school. The total number of student disseminated by age also indicated that 4% of them do not have the required age to enrol in any secondary school. It means that the student concerned have entered primary schools at their very young age.
Age
M F M F M F M F M F M F M F M F M F T
10 14 10 0 0 0 0 0 0 0 0 0 0 0 0 0 0 14 10 24
11 133 133 7 5 0 0 0 0 0 0 0 0 0 0 0 0 140 138 278
12 427 446 90 89 3 5 0 0 0 0 0 0 0 0 0 0 520 540 1060
13 486 450 382 378 57 64 2 5 0 0 0 0 0 0 0 0 927 897 1824
14 146 121 383 414 372 368 82 94 3 1 0 0 0 0 0 0 986 998 1984
15 18 8 183 174 344 371 289 237 31 53 3 2 0 0 0 0 868 845 1713
16 2 1 28 20 158 151 308 335 119 151 27 29 0 0 0 0 642 687 1329
17 1 0 1 2 20 26 159 130 121 148 105 83 28 17 3 5 438 411 849
18 0 0 1 1 1 3 30 8 46 45 73 86 43 36 4 5 198 184 382
19 0 0 0 0 0 0 10 3 6 12 26 20 10 20 4 4 56 59 115
20 0 0 0 0 0 0 10 0 3 0 14 8 10 2 2 3 39 13 52
Total 1227 1169 1075 1083 955 988 890 812 329 410 248 228 91 75 13 17 4828 4782 9610
Year 7 Year 8 Year 9 Year 10 Year 11 Year 12 Year 13 Year 14 Total
Percentage distribution of Francophone student
M a le 4 9 % F e m a le
5 1 %
The NER (net enrolment ratio) for the secondary education is 29% this year. The low net enrolment ratio denotes that the official secondary school age population currently attending school is very low.
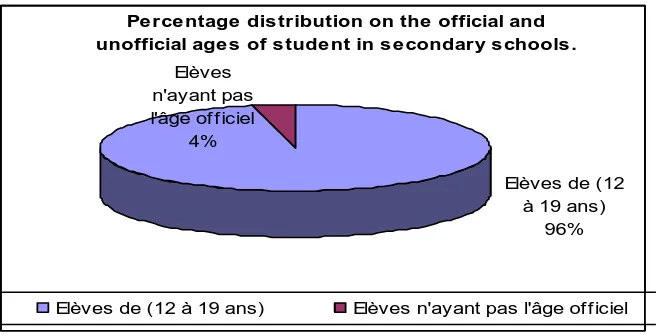
Graph 2.5 : Secondary Enrolment – Official and unofficial ages.
The pie chart above illustrates figures in table 2.5. In the case of Lycee LAB, the majority of year 14 students are 20 years of age. These students prepare themselves through the DAEU (Diplôme d’Accès a l’Enseignement Universitaire) to enable them to enter the French University in New Caledonia.
Table 2.6: Number of Student by School Administration
The table above indicates the number of student by school administration. The data collected shows that 56 percent of the student attended government secondary schools followed by 12 percent in Catholic schools and 9 percent enrolled in Private schools. The rest of 23 percent of students enrolled in schools administered by other school authorities.
Pe rce ntage dis tribution on the official and unofficial age s of s tude nt in s e condary s chools .
Elèves de (12 à 19 ans)
96% Elèves
n'ayant pas l'âge of f iciel
4%
Elèves de (12 à 19 ans) Elèves n'ayant pas l'âge of f iciel
Province Catholic Protestant Presbyterian C.O.C Anglican SDA AOG
Ang Fran Fran Ang Ang Ang Ang Ang Fran Ang Ang Ang Fran Ang Fran. Total
Torba 123 0 0 0 0 0 0 0 0 0 0 0 0 123 0 123
Sanma 675 598 234 113 0 0 0 293 0 239 0 0 0 1320 832 2152
Malampa 643 269 169 286 0 0 0 0 0 0 0 0 0 929 438 1367
Penama 600 215 0 0 265 360 0 0 15 0 0 0 1240 215 1455
Shefa 1036 808 347 0 461 0 0 70 188 419 0 79 69 2065 1412 3477
Tafea 463 284 202 0 0 0 0 0 0 19 68 0 0 550 486 1036
Total 3540 1959 1167 399 461 265 360 363 188 692 68 79 69 6227 3383 9610 Total
Holiness
Graph 2.6: Percentage of Student by school administration.
Table 2.7: Student Enrolment in Urban Schools.
Despite of the actual total enrolment, 35% of students enrolled in urban schools. The schools enrolment distribution indicated that10% of student enrolled in Luganville and 25% in Port Vila. Out of the total enrolment in the urban schools, 62% of the students are francophone and 38% are Anglophone. The last census recorded that 21% of the total population live in Port Vila. This highlights the concentration of population in the urban areas.
Graph 2.7: Percentage of Students in both Urban and Rural Schools
Municipality
Anglophone Francophone AnglophoneFrancophone Anglophon
e
Francophone Total
Luganville 21 72 0 0 21 72 94
Port-Vila 0 0 104 131 104 131 235
Total 21 72 104 131 125 204 329
Sanma Shefa summary
Percentage distribution by Adm instration AOG 1% Government 56% Cat holic 12% Prot est ant
4% COC 3% Presbyt erian 5% Privat e 9% SDA 4% Anglican 4% Holiness 2%
The Graph 2.7 shows that 65% of students enrolled in rural schools while 35 percent in urban schools (10% of students enrolled in Luganville and 25% in Port Vila).
Table 2.8: Enrolment Trend from 1992 to 2002
Table 2.8 indicates that the average rate of increase of student enrolment from 1992 to 2002 is 11%. In 1993 there was a sudden increase with the intake of year 7 students as a result of increases in the number of secondary schools.
Graph 2.8: Student Growth 1992-2002
Province M F T M F T M F T M F T M F T
Torba 42 33 75 54 38 92 71 61 132 62 56 118 59 80 139
Sanma 511 381 892 701 486 1187 654 516 1170 687 581 1268 781 650 1431
Malampa 194 141 335 251 172 423 299 229 528 306 238 544 418 316 734
Penama 370 337 707 421 371 792 402 398 800 412 416 828 422 414 836
Shefa 981 795 1776 1068 964 2032 1036 919 1955 1105 919 2024 1080 926 2006
Tafea 144 89 233 143 97 240 166 93 259 217 140 357 248 148 396
Total 2242 1776 4018 2638 2128 4766 2628 2216 4844 2789 2350 5139 3008 2534 5542
1996
1992 1993 1994 1995
M F T M F T M F T M F T M F T M F T
65 69 134 65 69 134 65 69 134 82 74 156 96 92 188 64 59 123 800 610 1410 813 664 1477 913 764 1677 1017 862 1879 976 843 1819 1123 1029 2152 460 367 827 554 481 1035 653 595 1248 567 517 1084 595 555 1150 713 654 1367 508 540 1048 588 598 1186 626 621 1247 658 675 1333 675 668 1343 733 722 1455 1167 1051 2218 1148 1146 2294 1348 1318 2666 1592 1575 3167 1659 1660 3319 1703 1774 3477 297 225 522 289 252 541 381 345 726 448 415 863 486 496 982 492 544 1036
3297 2862 6159 3457 3210 6667 3986 3712 7698 4364 4118 8482 4487 4314 8801 4828 4782 9610
2000 2001 2002
1997 1998 1999
Enrolment trend from 1992 - 2002
0 2000 4000 6000 8000 10000 12000
1992 1993 1994 1995 1996 1997 1998 1999 2000 2001 2002
With the current enrolment trend, it is projected that the number of students will doubled in 11 years if
enrolment continue to increase by 11 percent. This means that the government on its part has to make available more schooling space each year.
Table 2.9: Total number of repeaters by province
Within this year’s total enrolment; about 2 percent of the enrolments are repeaters. This shows that there is continual increase in the total number of repeaters in year 7, 8 and year 10 annually. The reason there are repeaters in secondary level is when under age students do not perform well, they could repeat by the discretion of the principal or school council. Other students repeat on medical or other unavoidable circumstances.
Table 2.10: Total number of dropouts in 2001
The above table shows that there is 5 percent of dropouts from the 2001 total enrolment in secondary schools. The main reason is because some parents were not able to finance their child’s school fees; therefore the students were not able to complete the scholastic year. Other reasons include termination from school due to serious misconduct or poor academic performance. It is important to note that some schools tend to include year 10 dropouts at the end of the year, which may affect this data. The table above shows that there is a high number of dropouts in year 8 and year 10.
Province Year 7 Year 8 Year 9 Year 10 Year 11 Year 12 Year 13 Year 14 Total
Torba 1 2 1 0 0 0 0 0 4
Sanma 12 17 6 18 7 0 1 0 61
Malampa 18 19 17 17 3 5 0 0 79
Penama 1 2 1 4 0 0 0 0 8
Shefa 21 12 0 8 5 15 1 0 62
Tafea 3 1 0 1 0 0 0 0 5
Total 56 53 25 48 15 20 2 0 219
Province Year 7 Year 8 Year 9 Year 10 Year 11 Year 12 Year 13 Year 14 Total
Torba 0 4 0 0 0 0 0 0 4
Sanma 23 19 23 41 2 37 2 0 147
Malampa 19 34 14 17 2 0 0 0 86
Penama 6 15 20 14 2 3 3 0 63
Shefa 20 11 13 18 6 4 0 0 72
Tafea 15 25 18 11 0 0 0 0 69
Table 2.11:
Total number of Transfers in, 2002.
The transfer process of students from one school to another usually takes place through out the year. This year indicators show that 10 percent of the students were transferred from one school to another within the secondary level. However we are not able to identify the reasons of these transfers. But it is believed that most of these transfers took place because some parents find it difficult to finance both school fees and transportation cost. Therefore parents decided to enrol their child/children in a nearby secondary school that are financially affordable.
Table 2.12: Total number of Transfers out, 2002
Table 2.12 shows that 4 percent of students were transferred out justifying more students coming in than going out of the secondary education system. The reasons for transfer out are similar to transfer in. There is evidence that most students attend schools in their province or selected to schools of their preference resulting in very low out-transfers.
Table 2.13: Total number of Boarders in Secondary schools
The above table shows that 69 percent of the total secondary enrolments are borders. Most parents prefer to board their kids so that they could be better discipline academically or learn to be independent when they become older. Other reasons for high rate of boarding is most students’ travel from their home island to another island to attend secondary school.
Province Year 7 Year 8 Year 9 Year 10 Year 11 Year 12 Year 13 Year 14 Total
Torba 0 0 0 0 1 0 0 0 1
Sanma 153 70 55 52 28 6 6 0 370
Malampa 94 46 28 10 44 0 0 0 222
Penama 55 17 19 13 0 2 0 0 106
Shefa 87 23 26 6 21 9 0 0 172
Tafea 20 10 9 7 0 0 0 0 46
Total 409 166 137 88 94 17 6 0 917
Province Year 7 Year 8 Year 9 Year 10 Year 11 Year 12 Year 13 Year 14 Total
Torba 0 0 1 0 0 0 0 0 1
Sanma 17 14 9 30 8 8 13 0 99
Malampa 35 23 9 14 16 20 0 0 117
Penama 8 6 5 0 0 0 0 0 19
Shefa 14 35 19 19 7 7 0 0 101
Tafea 11 3 3 0 0 0 0 0 17
Total 85 81 46 63 31 35 13 0 354
Province Year 7 Year 8 Year 9 Year 10 Year 11 Year 12 Year 13 Year 14 Total
Torba 37 33 21 21 0 0 0 0 112
Sanma 378 332 293 240 147 107 42 0 1539
Malampa 333 321 227 195 107 21 0 0 1204
Penama 345 295 304 257 78 63 19 0 1361
Shefa 334 265 238 277 131 119 41 0 1405
Tafea 264 231 231 204 60 3 0 0 993
Section III:
Teachers Information
In this section, teachers information are tabulated and illustrated using graphs:
This year the total number of secondary school teachers is 591. The majority of the teachers are graduates with teaching qualifications from the Vanuatu Institute of Teacher education (VITE) or from the other universities.
Table 3.1: Teacher’s by Province and by Sex.
The number of secondary school teachers has increased by 6% this year base on 2001 statistics. The 2002 indicators show that 61% of teachers are posted to Shefa and Sanma secondary schools. This is again due to the larger number of secondary schools in these two provinces.
Table 3.2: Percentage of Teachers with Teaching Qualification.
The above table shows that 70% of teachers have obtained a teaching certificate. It must be noted however that 30% of the teachers do not obtain a teaching certificate. It is important that the department of Education trained them for the benefit of our education system and to address issues of the level of training for teachers who teach in secondary schools.
Province Male Female Total
Torba 5 1 6
Sanma 105 49 154
Malampa 53 24 77
Penama 61 22 83
Shefa 115 91 206
Tafea 39 26 65
Total 378 213 591
Province Male Female Total Total %
Trained Tea. Teachers Teachers
Torba 3 0 3 6 50
Sanma 68 35 103 154 67
Malampa 38 21 59 77 77
Penama 49 19 68 83 82
Shefa 75 69 144 206 70
Tafea 24 12 36 65 55
Total 257 156 413 591 70
Table 3.3: Student/Teacher Ratio
The above table indicated that the average student/teacher ratio is 17:1. According to the secondary education teacher posting policy, the official posting ratio is 35:1. The total number of teachers shows that the actual average student/teacher ratio is fairly low. While it is important for the department of education to review teachers posting, one major reason for the under average actual ratio is the geographical location of schools.
Table 3.4: Teachers Status
The above figures are distribution of teachers by their teaching status:
66% of teachers are permanent. These teachers are full time teachers with teaching certificates.
19% are probation teachers. These are new graduated teachers.
15% are voluntary teachers. They are normally paid by the school’s administration or by other
non-government organizations. The non-government must coordinate teacher’s recruitment properly to avoid disparity of teacher’s qualification, which may affect the student’s performance.
Province Number of Number of Student/ Teacher Student Teachers ratio
Torba 123 6 21
Sanma 2152 154 14
Malampa 1367 77 18
Penama 1455 83 18
Shefa 3477 206 17
Tafea 1036 65 16
Total 9610 591
Province Permanent Probation Voluntary Total
Torba 4 1 1 6
Sanma 119 24 11 154
Malampa 35 20 22 77
Penama 54 11 18 83
Shefa 148 32 26 206
Tafea 29 26 10 65
Table 3.5: Number of Teachers paid under Different School’s Administration.
The above table indicates the different types of school administrations who also recruit and pay teachers’ salaries.
69% mass of salaries is paid by the government 12% of teacher’s salaries is paid by different churches 4% salaries are paid by the school council
15% of teacher’s salaries are paid by other school administration.
The churches contributed a lot financially in paying for their teacher’s salaries. We noted however, that there also financial difficulties in paying teachers salaries by both government, church and private. The government must look seriously again at different scales it is currently paying its teachers.
Conclusion:
The following are key points and issues highlighted in the 2002 secondary schools statistical digest which importantly the Ministry of Education, the churches and private must be made aware of in education development;
The distribution of schools in relation to actual population needs of each in each island is irrational.
The fair establishment of Anglophone and Francophone schools in each province.
The establishment of a Francophone secondary school in Torba province must be considered.
The inadequacy of the number of year 11 classes to cater for high year 10 dropouts.
The high number of urban schools still does not match the fast urban population growth.
The lack of official entry age policy enforcement in secondary schools.
The high rate of secondary schools dropouts in year 10, 11, 12, 13 and 14.
The number of untrained teachers in the teaching force
The actual student teacher ratio is generally low despite that some schools are short of teachers.
Province Government Mission School Council Others
Torba 5 0 0 1
Sanma 97 22 7 28
Malampa 59 8 2 8
Penama 68 7 2 6
Shefa 132 29 9 36
Tafea 48 7 5 5
Recommendations:
Here is some recommendations base on the analysis of this data:
To ensure that there is a balance grouping of students by schools, by islands and by provinces.
To reduce disparity between the number of Anglophone and francophone students proportionally.
The government should encourage other organizations or individuals to establish more schools.
More than 60% of students were not able to continue their studies in year 11. The government should put in place other means of training as operating more new technical schools. There could be serious poor education related problems in future if the situation is not carefully addressed.
To harmonize the teacher training: permanents, probation and voluntary to have the same quality of training in each school.
To respect the official criteria concerning the number of students per class and per teacher. (The average students/teacher ratio is 17:1) The ministry must:
Ensure proper number of students per classroom to avoid congestion and conductive learning environment.
Review teachers posting
Student by Province
School Province Island Medium of Administration Affiliation
Instruction Male Female Male Female Male Female Male Female Male Female Male Female Male
Ranon Malampa Ambrym English Government 15 21 16 10 16 8 6 3
Lakatoro Malampa Malekula English Government 25 16 22 23
Rensarie JSS Malampa Malekula English Government 24 16 33 39 23 13 18 17 12 24
South West Bay Malampa Malekula English Government 17 19 18 17 16 19 18 19
Liro Malampa Paama English Government 15 23 11 19 20 12
96 95 89 89 66 59 62 51 12 24 0 0 0
Sessivi Malampa Ambrym French Catholic 7 13 9 4 8 7 6 12
College de Rensarie Malampa Malekula French Government 26 13 13 19 16 8 16 8 16 20
Norsup Malampa Malekula French Government 23 17 21 13 13 11 9 7
Orap Malampa Malekula French Protestant 32 42 35 24 26 22 20 10 22 25 18 10
Vao Malampa Malekula French Catholic 15 15 11 17 12 12 14 7
103 100 89 77 75 60 65 44 38 45 18 10 0
Ambaebulu Penama Ambae English Government 34 35 22 23 35 38 22 16
Navutiriki Penama Ambae English Government 20 20 20 16 18 15 20 12
Vatumauri Penama Ambae English Private 4 5 6
Vureas Penama Ambae English Anglican 33 39 40 27 41 23 33 29 18 24 17 17 7
Gambule Penama Maewo English Government 25 12 15 11 6 11
Lini Memerial College Penama Pentecost English Government 11 24 13 23 13 20 20 30
Ranwadi High School Penama Pentecost English C.O.C 25 24 20 20 33 40 22 16 16 20 16 13
152 159 136 120 146 147 117 103 34 44 33 30 7
Tagaga Penama Ambae French Catholic 15 16 15 14 20 10 12 8
Melsisi Penama Pentecost French Catholic 11 23 17 15 7 12 11 9
26 39 32 29 27 22 23 17 0 0 0 0 0
Aore Sanma Aore English SDA 28 23 32 24 26 18 19 24 31 34 18 16
Home Community Sanma Luganville English Private 21 15 19 8 10 6 11 14
Santo East Sanma Luganville English Government 18 19 22 14 20 17
Hog Harbour Sanma Santo English Government 38 29 18 19 16 22 15 15
Matevulu College Sanma Santo English Government 33 30 27 34 31 28 24 31 36 27 34 30 17
Natanara Sanma Santo English Private 7 4 7 4 3 4 4 2
Tamolvanua Sanma Santo English Private 13 5 13 5 9 12 10 5
Turtle Bay Sanma Santo English Private 9 5 9 5
167 130 147 113 115 107 83 91 67 61 52 46 17
College de Luganvillle Sanma Luganville French Government 46 45 54 70 43 45 41 45 23 34 7 21 8
Saint Michel Sanma Luganville French Catholic 32 31 34 36 32 28 21 20
Nandiutu Sanma Malo French Government 17 18 17 12 13 12 7 9
Molivalivu Sanma Santo French Protestant 22 13 18 5 14 9 10 4
Niwa Sanma Santo French Protestant 6 0 6 0 4 2 0 0
123 107 129 123 106 96 79 78 23 34 7 21 8
Onesua Shefa Efate English Presbyterian 30 49 44 48 33 42 47 49 29 36 23 31
Ulei Shefa Efate English Government 41 41 16 26 20 25 20 25
Epi High School Shefa Epi English Government 18 20 15 20 20 21 16 22
Port-Quimie Shefa Epi English SDA 23 17 11 19
Central Junior Shefa Port-Vila English Government 21 14 15 20 20 15
Malapoa College Shefa Port-Vila English Government 38 35 31 40 36 37 38 32 30 36 36 16 22
NTM (E) Shefa Port-Vila English Holiness 11 13 13 5 4 9 14 6 3 1
Port-Vila International Shefa Port-Vila English Private 0 0 4 7 4 5 6 4 3 1
Sorovanga Shefa Port-Vila English Private 13 12 19 15 14 15 16 15
Vila Christian College Shefa Port-Vila English Private 1 5 3 4 2 1 2 4
Vila City College Shefa Port-Vila English Private 31 39 25 26 28 32 42 21
Napangasale Shefa Tongoa English Government 22 19 27 11 7 2 14 23
249 264 223 241 188 204 215 201 65 74 59 47 22
Burumba Shefa Epi French Government 18 19 11 15 12 12 4 8
Ecole Française Shefa Port-Vila French Private 19 22 16 16 22 27 9 20 11 9 9 6 2
Lycée Shefa Port-Vila French Government 58 45 43 61 50 56 57 57 39 65 53 54 21
Montmartre Shefa Port-Vila French Catholic 44 34 20 37 26 38 38 29 21 10 15 13 14
NTM (F) Shefa Port-Vila French Holiness 10 10 12 7 3 8 10 6 2 1
149 130 102 136 113 141 118 120 73 85 77 73 37
Ienaula Tafea Tanna English Government 22 16 16 17 17 13 18 12
Lenakel Tafea Tanna English Government 22 15 21 22 17 19 20 15
North Tanna Christ Comm. Tafea Tanna English Private 2 5 2 5 1 4
Tafea Christian School Tafea Tanna English AOG 11 5 11 5 8 8 8 4 2 3 2 1
Tafea JSS Tafea Tanna English Government 23 17 15 23 13 25 22 17 9 17
80 58 65 72 56 69 68 48 11 20 2 1 0
College de Tafea Tafea Tanna French Government 15 18 10 22 13 24 13 16 6 23
Imaki Tafea Tanna French Catholic 18 17 14 14 11 11 10 7
Isangel Tafea Tanna French Government 18 15 9 20 15 17 15 15
Lowanatom Tafea Tanna French Catholic 10 20 11 12 11 17 11 8
61 70 44 68 50 69 49 46 6 23 0 0 0
Arep Torba Vanualava English Government 21 17 19 15 13 14 11 13
Year 11 Year 12 Year 13
Secondary School Teachers
School Male Female Total
Province Government Mission School Council Other
Male Female
College de Rensarie Malampa 5 5 10 5 5 8 2
Lakatoro Malampa 4 3 7 3 3 5 2
Liro Malampa 4 1 5 1 4 1
Norsup Malampa 4 2 6 4 2 6
Orap Malampa 14 3 17 5 1 9 8
Ranon Malampa 4 4 3 1 4
Rensarie JSS Malampa 5 5 10 5 5 8 2
Sessivi Malampa 5 1 6 4 0 5 1
South West Bay Malampa 3 3 6 3 3 4 1 1
Vao Malampa 5 1 6 5 1 6
53 24 77 38 21 59 8 2 8
Ambaebulu Penama 4 3 7 3 5 6 1
Gambule Penama 2 1 3 1 1 2 1
Lini Memerial College Penama 4 5 9 1 4 7 2
Melsisi Penama 6 2 8 6 7 1
Navutiriki Penama 4 2 6 4 2 6
Ranwadi High School Penama 12 3 15 12 2 13 2
Tagaga Penama 4 2 6 4 2 6
Vatumauri Penama 3 3 1 3
Vureas Penama 22 4 26 17 3 21 5
61 22 83 49 19 68 7 2 6
Aore Sanma 15 7 22 11 7 22
College de Luganvillle Sanma 21 9 30 17 5 26 4
Hog Harbour Sanma 7 1 8 2 1 8
Home Community Sanma 5 2 7 7
Matevulu College Sanma 21 12 33 16 10 32 1
Molivalivu Sanma 5 2 7 1 2 6 1
Nandiutu Sanma 5 2 7 5 2 7
Natanara Sanma 1 3 4 4
Niwa Sanma 3 3 3
Saint Michel Sanma 12 6 18 12 6 14 4
Santo East Sanma 3 2 5 3 2 4 1
Tamolvanua Sanma 4 2 6 6
Turtle Bay Sanma 3 1 4 1 4
105 49 154 68 35 97 22 7 28
Burumba Shefa 4 4 4 4
Central Junior Shefa 1 3 4 1 3 4
Ecole Française Shefa 9 10 19 19
Epi High School Shefa 2 3 5 1 3 5
Lycée Shefa 29 16 45 29 16 45
Malapoa College Shefa 14 25 39 14 25 39
Montmartre Shefa 13 10 23 4 3 19 2 2
Napangasale Shefa 4 2 6 2 3 2 1
NTM (E) Shefa 7 5 12 2 3 12
NTM (F) Shefa 5 1 6 5 6
Onesua Shefa 3 3 6 3 5 1
Port-Quimie Shefa 5 5 5 5
Port-Vila International Shefa 2 2 2
Sorovanga Shefa 2 2 4 4
Ulei Shefa 4 4 8 4 4 8
Vila Christian College Shefa 1 3 4 4
Vila City College Shefa 12 2 14 1 12 14
115 91 206 75 69 132 29 9 36
College de Tafea Tafea 6 4 10 4 2 10
Ienaula Tafea 3 3 6 3 3 6
Imaki Tafea 5 2 7 3 5 1 1
Isangel Tafea 4 3 7 4 3 7
Lenakel Tafea 3 4 7 1 1 6 1
Lowanatom Tafea 6 2 8 2 5 3
North Tanna Christ Comm. Tafea 3 3 6 6
Tafea Christian School Tafea 3 2 5 1 5
Tafea JSS Tafea 6 3 9 6 3 9
39 26 65 24 12 48 7 5 5
Arep Torba 5 1 6 3 5 1
Total 378 213 591 257 156 409 73 25 84
Paid by
Statistical Questionnaire
STATISTICAL QUESTIONNAIRE
SECONDARY EDUCATION
YEAR 2002
I . IMPORTANT NOTE :
Policy and Planning Services is sending you two copies of 2002 Statistical questionnaires which 1 copy must be completed and returned to the PEO in your province before 22nd February, 2002 and the other must be kept by the school. To avoid inaccurate data or not adhering to time set which may lead to disciplinary action, Principals filling the forms are advised to ensure data is accurate and handed in on time.
It is very important for you to understand that each section of the questionnaire is very important and are analyzed and use as indicators for education development in the country.
General Information:
This section requires that you provide general administration of the school and it is important that new schools are given their year of establishment.
Enrolment: (tables)
We are collecting data for each school by Year, Sex and Age, which will help us determine; 1. Enrolment rates and ratios
2. Intake rates and ratios of pupils 3. Repetition and survival rates
4. Transfer of students from one school to another 5. The number of boarding students in each school
Teachers:
This information on teachers will help us find out; 1. The number of students per teacher
2. The number of trained and untrained teachers in the field 3. The number of teachers entering and leaving the filed.
Financial Statement:
It is important to know the financial statement for each school
3. To assist projects, planning and finance in the Department of Education
General Comment:
We are interested to have your comment on the administration of school or on how you think this questionnaire may be improved.
II. GENERAL INFORMATION:
1. Name of School :
Island:
Province:
Establishment Year:
2. Medium of Instruction :
English: French: Amalgamation tick in the appropriate box
3. Affiliation/ Administration
Government
Catholic
Protestant
SDA
Presbyterian
Other specify:………. Private
III. ENROLMENT :
Attrition:
Age M F M F M F M F M F M F M F M F M F T
10
11
12
13
14
15
16
17
18
19
20
Total
Year 7 Year 8 Year 9 Year 10 Year 11 Year 12 Year 13 Year 14 Total
M F M F M F M F M F M F M F M F M F T
Repeaters 02
Dropouts 01
Transfers in 2002
Transfers out 2002
Boarder s Day Boarders
Year 7 Year 8 Year 9 Year 10
Total Year
11
Year 12
Year 13
IV. STAFFING
Name of Principal:
Non teaching: Yes No “please circle the appropriate answer”
Give the number of Teachers in your school: Male: Female:
How many teachers are qualify to teach (eg, VTC Diploma): Male: Female:
How many of them are: Permanent: Probation: Voluntary:
How many of them are paid by: Government: Mission: School Council:
Other:
Applicable to new teachers only (Probation teachers)
Teachers Qualifications:
Teachers Qualifications:
Employer Surname Other Names M F DoB Citizenship Eg. Married Perm Prob Voluntary Eg. Govt
Sex Marital Status Employment Status
Highest Accademic Teaching Qualification Initial date Subject
V. GENERAL COMMENT:
We would appreciate if you could comment briefly on this year’s general administration of the schools
Please give your comment on how you think we can improve this questionnaire