Materials Processing
Article
Effect of Post Treatment on the Microstructure,
Surface Roughness and Residual Stress Regarding the
Fatigue Strength of Selectively Laser Melted
AlSi10Mg Structures
Wolfgang Schneller 1,* , Martin Leitner1 , Sebastian Pomberger2 , Sebastian Springer1, Florian Beter1and Florian Grün1
1 Montanuniversität Leoben, Department Product Engineering, Chair of Mechanical Engineering,
Franz-Josef-Straße 18, 8700 Leoben, Austria; martin.leitner@unileoben.ac.at (M.L.); sebastian.springer@unileoben.ac.at (S.S.); florian.beter@unileoben.ac.at (F.B.); florian.gruen@unileoben.ac.at (F.G.)
2 Christian Doppler Laboratory for Manufacturing Process Based Component Design, Montanuniversität
Leoben, Franz-Josef-Straße 18, 8700 Leoben, Austria; sebastian.pomberger@unileoben.ac.at
* Correspondence: wolfgang.schneller@unileoben.ac.at
Received: 24 September 2019; Accepted: 14 October 2019; Published: 16 October 2019
Abstract:This paper focusses on the effect of hot isostatic pressing (HIP) and a solution annealing post treatment on the fatigue strength of selectively laser melted (SLM) AlSi10Mg structures. The aim of this work is to assess the effect of the unprocessed (as-built) surface and residual stresses, regarding the fatigue behaviour for each condition. The surface roughness of unprocessed specimens is evaluated based on digital light optical microscopy and subsequent three-dimensional image post processing. To holistically characterize contributing factors to the fatigue strength, the axial surface residual stress of all specimens with unprocessed surfaces is measured using X-ray diffraction. Furthermore, the in-depth residual stress distribution of selected samples is analyzed. The fatigue strength is evaluated by tension-compression high-cycle fatigue tests under a load stress ratio of R =−1. For the machined specimens, intrinsic defects like pores or intermetallic phases are identified as the failure origin. Regarding the unprocessed test series, surface features cause the failures that correspond to significantly reduced cyclic material properties of approximately−60% referring to machined ones. There are beneficial effects on the surface roughness and residual stresses evoked due to the post treatments. Considering the aforementioned influencing factors, this study provides a fatigue assessment of the mentioned conditions of the investigated Al-material.
Keywords:fatigue; SLM; AlSi10Mg; post treatment; residual stress; surface roughness
1. Introduction
Selective laser melting (SLM) enables the manufacturability of complexly shaped and topographically optimized components. Additive manufacturing (AM) is contemplated to find significant application in demanding fields such as automotive, aviation and biomedical engineering [1–5]. Particularly in complex structures, post built machining is not always possible; hence, it is of upmost importance to investigate the influence of the unprocessed surface on the fatigue strength in conjunction with the effect of subsequent post treatments [6,7]. It is estimated that about 90% of all engineering failures are caused by fatigue-related damage mechanisms [8,9]. Along with Ni-based alloys, stainless steel and titanum, aluminum alloys, AlSi10Mg is especially a very commonly used material for powder-bed based AM and therefore causes the necessity of a proper as well as safe assessment
of the material qualification regarding fatigue [10]. Current studies on stainless and tool steels as well as titanimum alloys deal with the importance of surface quality, process parameters as well as post treatments and possible reasons for defects formations. For example, powder defects, insufficient energy and consequent partially melted powder particles or material vaporization impact static and cyclic material properties [11–16]. Additionally, the manufacturability of lattice structure by AM provides huge potential in terms of lightweight design and is subject to many research works. The interaction between the building direction, microstructure, and crack propagation is discussed in [11]. The microstructure is found to have great influence on the fatigue crack morphology and crack deflection effects. Fatigue crack initiation and the propagation rate play a major role in fatigue properties, whereby it is found that initiation is strongly linked with the surface roughness and the crack propagation rate with the microstructure and stress level [17]. Among others, hot isostatic pressing (HIP) and solution annealing (T6) are two common procedures to enhance material properties [18–20]. Given the fact that HIP leads to a reduction of the volume fraction of porosity and improved fatigue resistance for sand-casted aluminum components, an according HIP treatment may be beneficial to AM parts as well [21–23]. SLM structures generally exhibit an extremely fine microstructure due to high cooling rates [24]. A heat treatment above the solubility temperature of AlSi10Mg causes microstructural coarsening, since grain boundaries are dissolved as well as the precipitation of second phase particles [9,25–27]. These microstructural changes result in reduced fatigue properties, and therefore demand a subsequent age hardening process in order to counteract those unfavourable effects [28]. The exact post treatment parameters are set up incorporating the knowledge of the specimen manufacturer. The influence of the post treatments is further investigated in terms of the surface roughness and residual stresses. The fatigue strength of engineering components is decreased with increasing surface roughness. Elevated surface roughness tends to generate stress concentration factors and favors failure initiation [6]. In this study, the effect of the unprocessed surface is investigated and described using a notch effect factor referring to a machined condition [29,30]. The applicability of an endurance limit reducing factor is researched and validated with experimental results. The impact of residual stresses on the fatigue strength is studied as well within this work. It is of utmost importance to holistically assess material qualification, since a present residual stress state can significantly alter the stress condition at the failure initiating imperfection [31,32]. A post treatment also influences the residual stress condition in great measure. Neglecting residual stresses may lead to non-conservative designing of components, which is the reason for the conducted research work. It is of technical and economical relevance to investigate the influence of residual stresses and enhance existing concepts to properly as well as safe assess material qualifications regarding fatigue. This study provides a method how to assess the impact of surface features under consideration of residual stresses acting as mean stresses. The authors propose an approach to account for residual stresses in fatigue design and furthermore look at notch effects due to surface roughness independently, which allows a differentiated assessment of roughness features and residual stress effects.
2. Materials and Methods
Three different post treatment conditions are the subject of this work. Therefore, it was necessary to clearly distinguish between the test series. The following enumeration clarifies the abbreviations used in the present study and provides the applied treatments for each condition. A detailed description of the respective routines is given in Table1. The first column refers to the treatment, followed by temperature, pressure and time, which provides information about the minimum holding time of the respective treatment. The exact post treatment parameter is defined incorporating the knowledge of the specimen manufacturer, aiming to enhance material properties. For this reason, the used parameter sets are classified:
Table 1.Parameter of subsequent post treatments.
Treatment T (°C) P (MPa) Time (h)
Hot isostatic pressing above 500 above 100 2
Solution annealing above 500 - 6
Age hardening below 200 - 7
In order to quantify the impact of the surface roughness, each of the above-mentioned test series (AB, HIP and SA) consisted of two batches—one lot exhibiting a machined and polished surface—denoted as “M”, and a second set of specimens in as-built (not machined) surface condition—denoted as unprocessed “UP”. Therefore, in total, six test series were investigated. There were nine specimens that exhibited a polished surface and five specimens with unprocessed surfaces manufactured for each condition. The abbreviation for the surface condition was added before the post treatment e.g., M-HIP means machined surface and HIP treated or UP-SA stands for unprocessed surface and solution annealing.
The used AlSi10Mg powder for specimen manufacturing showed the chemical composition given by the powder manufacturer in Table2[33]. According to manufacturer specifications, the material corresponds to the standard DIN EN 1706:2010 [34].
Table 2.Chemical composition of the AM powder in weight %.
Material Si Fe Cu Mn Mg Al
AlSi10Mg 9.0–11.0 0.55 0.05 0.45 0.20–0.45 Balance
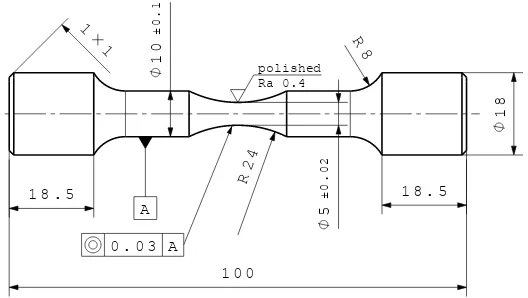
All specimens were built in a vertical direction on an EOS M290 system, using a Yb fiber laser with a power of 400 W. The beam diameter is set to 100µm. The standard parameter set provided by EOS is used for printing. To ensure all surface-related effects are eliminated for the investigation of the machined conditions, a respective number of specimens is manufactured with a certain machining allowance to subsequently remove the boundary layer. Following the manufacturing process, the respective post treatment was applied. Afterwards, the specific specimens for the machined test series were processed to the geometry by turning and polishing, shown in Figure1. The geometry of the specimen corresponds to no standard but is designed to minimize the stress concentration within the testing section caused by the narrowing shape. A numerical analysis reveals a maximum principal stress concentration of Kt= 1.045, hence 4.5% at the thinnest point. The same specimen geometry and
manufacturing parameter are used for previous work already published by the authors in [35].
1 0 0
1 8 . 5 1 8 . 5
1
0
±
0
.
1
1
8
8 R
5
±
0
.
0
2
1 1
24 R
Ra 0.4 polished
A
0 . 0 3 A
2.1. SEM Investigation
To characterize the impact of the respective post treatment on the microstructure, backscatter-SEM images of microsections were taken with a Carl Zeiss EVO MA 15 microscope in accordance with [36]. Both post treatments were conducted above the solubility temperature of the investigated material [37–39]. It is mentioned that the solution temperature of the cast alloy is above 450 °C, and therefore a subsequent age hardening at low temperatures leaves the microstructural evolution unchanged [40].
2.2. High Cycle Fatigue Assessment
For all test series, a modified staircase test method was utilized [41]. The high-cycle fatigue testing was carried out under a load stress ratio of R =−1 on an RUMUL Mikrotron resonant testing rig. The test frequency was in the region of 106 Hz. Specimens were gripped with collets at both ends. The test was aborted when total fracture occurred, or the run-out criterion of 1E7 load cycles was reached. In order to generate more data within the finite life region, conservatively not ruling out the possibility of pre-damaging at load levels below the fatigue limit, run-outs were reinserted [42]. In the following work, selected results referring to the AB and HIP conditions have been partially published within preliminary studies in [35]. All given stress values were normalized to the nominal ultimate tensile strength (UTS) of the base material without any post treatment, given by the powder manufacturer [33]. The fatigue strength at 1E7 load-cycles for a survival probability of 50% (σf) was
statistically determined by applying the arcsin√P-transformation, described in [43]. The assessment of the S/N-curve within the finite life region was done utilizing the ASTM E739 standard [44].
Mean stresses impact the fatigue strength whereby the endurance limit is decreased with growing mean stresses such as static loads along with cyclic loading [45]. The effect is usually depicted as fatigue strength amplitude plotted over mean stress. A large number of concepts have been developed in order to predict the fatigue strength for different mean stress states [46,47]. Two models, one according to Gerber [48] and another one developed by Dietman [49] were utilized within this work to consider a certain mean stress state caused by residual stresses and its impact on fatigue. Equations (1) and (2) serve as two models to correct the endured stress amplitude dependent on the present residual stress state. Both required the ultimate tensile strengthσutsfor the respective condition, which was
provided by the specimen manufacturer. The parabolic Gerber concept as well as the empirical Dietmann equation showed high statistical correlation with experimental data, which is why those two models were applied. In the following,σa(−1)stands for the stress amplitude at a load stress ratio
of R =−1, andσmrefers to the present mean stress. Considering this, the endurable stress amplitude
σa, at a certain mean stress, can be estimated:
σa =σa(−1)
h
1−σm
σuts 2i
, (1)
σa=σa(−1)
r
1− σm
σuts. (2)
2.3. Residual Stress Measurement Methodology
fatigue strength at 1E7 load cycles is of interest, one should be aware of a possible depletion of residual stress under tensile loading. For this reason, the validation of the cyclic stability of residual stresses is necessary in order to ensure the usability of the measured stresses in following work. Therefore, in situ residual stress measurements were conducted while fatigue testing. For the assessment of the cyclic stability of the present residual stresses, the fatigue testing was stopped, residual stresses were measured, and, afterwards, the testing is continued. In order to avoid falsifying of the results, the specimen remains clamped in the testing rig.
2.4. Surface Roughness Evaluation
An engineering approach to characterize the reduction of the fatigue strength due to the surface roughness includes the maximum depth of roughness valleys as well as the roughness valley radius. Based on a concept of Peterson, the unprocessed surface, exhibiting micro notches due to the building process, was characterized. Considering the localized stress concentration of such features, the consequent reduction of fatigue properties can be described by the notch effect factor Kt;
see Equation (3) [30]. This approximate solution for a shallow, assumed ideal elliptical notch, is only a function of the notch depth and radius of the curvature. Therefore, this concept incorporated the maximum surface deviation Stand the notch root radiusρ. Based on recommendations by the author, the support effect was not taken into account and set ton= 1 due to a conservative approach; for this reason, Ktequals Kf. This concept finds application within this study to predict the reduced endurable
stress amplitude of the unprocessed specimens, beginning with the fatigue strength of the machined ones, respectively, in mean (residual) stress free state:
Kt=1+2 s
St
ρ. (3)
Utilizing a light optical microscope and three-dimensional image processing, it was possible to determine the average maximum surface deviation (St) in a non-destructive way [54], shown in
Figure2. Since the specimen geometry is round and additionally possesses a curvature within the testing area, proper filtering of the captured surface topography is necessary. In a first step, the round specimen was partitioned into 12 sections that are individually captured and represent the entire surface. Exemplary, Figure3a pictures the primary profile, respectively the geometrical structure of one surface segment, detected by the digital optical microscope. The thereby generated three-dimensional datasets were processed within a user-defined routine, as described in [55]. By means of a second order robust Gaussian regression filter, the roughness profile is calculated applying a cut-off wavelengthλc
of 2.5 mm. The cut-off length was chosen as recommended by the authors in [55]. This results in the waviness profile as pictured in Figure3b and the associated roughness profile, see Figure3c, of the exemplified surface segment. The roughness profile now entirely reflects the surface topography as the waviness profile corresponds to the specimen geometry, respectively form. After areal roughness calculation, the evaluated area is separated into sub-areas, 1×1 mm2in size by means of the routine and plotted onto the measured surface image. An exemplary roughness map of the areal roughness parameter Stis shown in Figure2. Yellow areas mark high roughness values, and blue areas mark
low ones. Due to that, not only can local areal roughness parameters be linked to surface topography properties, such as notch depth, but also information about the location of the structures are gained.
(a) (b)
(c)
Figure 3. Surface roughness evaluation process. (a) Primary surface profile. (b) Waviness surface profile. (c) Surface roughness profile.
3. Results
3.1. Microstructural Analysis
In the untreated condition, see Figure4a, one can identify pores and grain boundaries, also detected in [56]. The post treated conditions differ from the as-built condition, as significant changes in the microstructure are detected. Grain boundaries are no longer clearly visible, and precipitates are formed within the microstructure. This is observed for both post treatments; see Figures4b and5. By virtue of the heat influence, the post treatment causes melt pool boundary softening, implying microstructural evolution and precipitation [57]. Additionally, the porosity and the maximum extension of pores are significantly decreased for the HIP condition, also detected in [58] and published within previous work on this topic in [35].
Grain boundaries
Pores
(a) (b)
Figure 4.Microstructural analysis. (a) Microstructure of the AB condition [35]. (b) Microstructure of the SA condition.
These microstructural features are also found in [27] for both the HIP and SA conditions. A performed EDX-analysis on a Fe-rich precipitate, the spot marked as ‘a’ in Figure5, shows a chemical composition
(Al70.24Si15.24Fe14.32) that calculates to Al5Si1.1Fe1.02and is similar to theβ-phase Al5SiFe, reported and
found in [60–62]. Due to the elevated temperature above the solubility temperature, silicon crystals are precipitated at the grain boundaries which grow to their respective size throughout the subsequent annealing [37,38,63]. An analysis at spot ‘c’ confirms the labelled agglomerations as Si-particles that are well reported in [64,65]. The detected microstructural features decelerate the long crack growth. The crack front interferes with these microstructural features, and the propagation is obstructed and forced to change its direction, whereby the overall resistance against fatigue crack growth is enhanced. The improved resistance against crack propagation is attributed to deflection and energy dissipation at the crack tip [25,66]. Within this study, this microstructural behavior is observed for the HIP and the SA condition; compare [35]. After the post treatment, the base material in area ’b’ shows a chemical composition of Al94.27Si5.73, which differentiates to the as-built matrix due to precipitation.
a
b c
Pores
Fe-rich precipitates
β-Al5SiFe
Si-particles
Figure 5.Microstructure in post treated condition including EDX analysis.
3.2. Residual Stress Measurement
3.2.1. Surface Residual Stresses and Cyclic Stability
For the unprocessed condition, it is highly necessary to know the residual stresses at the surface, since this is the location of the failure origin, and the condition within the failure initiation area is essential. The interaction between surface condition, residual stresses, and, furthermore, the microstructure as well as understanding the importance of their codependency is also reported in [67,68]. To ensure a proper assessment of the axial residual stresses at the surface, three measurements along the circumference in a distance of 120° are performed. The measurements are conducted before testing and clamping. For further analysis, the mean value is considered to serve as a base value with the scatter band representing a confidence level of 95%. The residual stress results are normalized to the UTS of the material and abbreviated asσres,ax,surf. This allows for quantifying the intensity of
is depicted by the two black lines in Figure6. However, increasing the tensile load above the fatigue limit either leads to a relaxation of residual stresses or failure before measurable changes to the residual stress state; see red lines in Figure6, occur. The findings therefore prove that residual stresses measured before testing are still present after testing at run-out level or remain even unchanged until failure. This enables to look at measured values before testing as permanent present mean stresses. All results are given in Table3, whereby all stress values are normalized to the surface stress before testing but after the specimen is clamped.
Table 3.Axial surface residual stress measurement results.
Condition Surface σres,ax,surf(0 LC) σres,ax,surf(1E7 LC) Difference
AB UP 0.107±0.027 0.106±0.023 −0.9%
HIP UP 0.049±0.023 0.054±0.024 +11.0%
SA UP 0.057±0.026
-10 -1 10 0 10 1 10 2 10 3 10 4 10 5 10 6 10 7 0.0 0.5 1.0 1.5 #1 #2 #2 Confidence level 90%
100 10 1 Specimens failed N o r m a l i z e d a x i a l s u r f a c e r e s i d u a l s t r e s s [ -]
Number of load-cycles [-]
UP-AB Tested at fatigue limit (run-out level) UP-AB Tested above fatigue limit
AlSi10Mg (As-built) R = -1
0
#1
Figure 6.Cyclic stability of residual stresses.
3.2.2. In-Depth Residual Stress Distribution
To characterize the residual stress state directly at the crack initiation site for the machined specimens, it is necessary to electrolytically polish into the depth in which the failure responsible defects lie. The determination of the residual stresses at the crack origin is essential since they are substantially involved in failure initiation and crack growth; the present stress is denoted in the following asσres,ax,surffor crack initiation at the surface andσres,ax,bulkfor failure from internal defects.
Surface of machined specimen Surface of unprocessed specimen
UP-AB UP-HIP
D
e
p
t
h
[
m
m
]
Normalized axial residual stress [-]
Area that is machined from unprocessed specimen
2
.
7
5
r
e
s
,
s
u
r
f
Figure 7.Normalized in-depth axial residual stress progression of AB and HIP conditions.
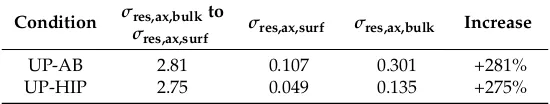
Table 4.Axial in-depth residual stress measurement results.
Condition σres,ax,bulkto
σres,ax,surf σres,ax,surf σres,ax,bulk Increase
UP-AB 2.81 0.107 0.301 +281%
UP-HIP 2.75 0.049 0.135 +275%
Considering the comparably high residual stresses at the crack initiation spot as an existing mean stress, they change the present mean stress state and affect the crack initiation, propagation and consequently the fatigue strength in great measure [69,70].
3.3. Surface Roughness Parameter Evaluation
For the application of the notch effect concept by Peterson, mean values of all gathered data of St
andρare taken into the calculation of Kt, since the most critical surface feature is a certain combination
of notch depth and notch valley radius. Since the aim is to non-destructively determine the reduction in fatigue strength, the values for Standρare taken from the optical surface assessment and not from a subsequently performed fracture surface analysis. Empirical investigations show that the mean value of the maximum valley depth of all 12 segments describes the critical surface roughness properly. For a suitable assessment of the area-based roughness parameter St, comparison, and validation of
the optical evaluation, the maximum surface deviation is also measured within the fractured surfaces. The non-destructive optical surface evaluation is in sound correlation with the mean values from measurements on fractured specimens. The average deviation of the two methods varies between 5.8% and 7.4%, which confirms the applicability of the used evaluation routine. The results for the surface roughness parameter Stare normalized to the mean value evaluated by the fracture surface analysis
and are summarized in Table5. It is observed that both post treatments have a beneficial impact on the surface roughness; Stis decreased by about 14%.
in the fractured surface since this would provide the notch radius within the wrong plane, namely perpendicular to the loading direction. The comparison of the investigated conditions reveals that the average roughness valley radius increases due to the post treatments, which mitigates the sharpness of the notch.
Figure 8.Surface notch valley radii measurement.
Table 5.Results of the surface roughness evaluation.
Condition Norm. Mean St (Frac. Surf.)
Norm. Mean St
(Optical Eval.) Deviation Averageρ
AB 1.000 (Basis) 0.926 (−7.4%) 7.4% 197.6µm HIP 0.868 (−13.2%) 0.804 (−19.4%) 6.2% 243.2µm SA 0.852 (−14.8%) 0.794 (−20.6%) 5.8% 245.5µm
3.4. High Cycle Fatigue Testing
The high-cycle fatigue test results for the HIP condition are displayed in Figure9. The solid lines denote the machined surface condition, whereby black with square markings represents the AB condition and blue with triangle markers is used for the HIP condition. Solely, the comparison of both machined HIP to AB conditions is published within a previous study in [35]. The dashed lines stand for the unprocessed surface condition. The displayed SN-curves are evaluated at a survival probability of 50%. All results are summarized in Table6. The finite life region is denoted as FLR, and the long life region is abbreviated as LLR. In order to obtain reasonable results and ensure testing within the linear-elastic region, the peak load level for testing is below the yield strength of the material.
Figure 9.S/N curves for the AB and HIP test series.
The following Figure10 shows the fatigue test results for the solution annealed condition. As described before, black lines and markings refer to the AB condition. Analogous to Figure 9, the green solid line presents the results for the machined, and the green dashed line the results of the unprocessed condition. Green circular markings are used to flag the test data. Solution annealing reveals the same trend as observed for the HIP condition. The fatigue strength of the machined SA condition lies 5.9% above the fatigue strength of the machined AB. In regard to the unprocessed surface condition, solution annealing enhances the fatigue strength by 25.3%. One can observe that the unprocessed surface again has a major impact on the fatigue behaviour, as machining leads to an improvement of +146%. The scattering between 10% and 90% survival probability is again decreased for the machined condition. The slope in the finite life region is again found to be less steep than for the AB condition.
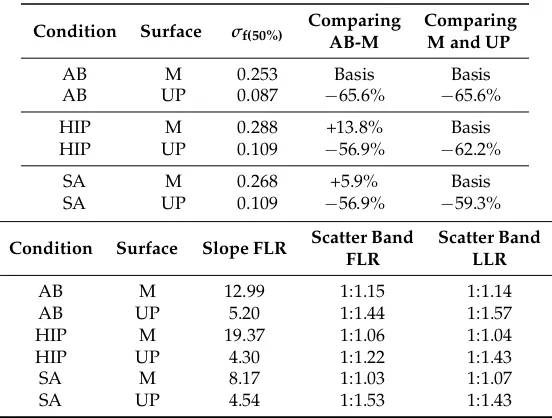
Table 6.High cycle fatigue test results.
Condition Surface σf(50%)
Comparing AB-M
Comparing M and UP
AB M 0.253 Basis Basis
AB UP 0.087 −65.6% −65.6%
HIP M 0.288 +13.8% Basis
HIP UP 0.109 −56.9% −62.2%
SA M 0.268 +5.9% Basis
SA UP 0.109 −56.9% −59.3%
Condition Surface Slope FLR Scatter Band FLR
Scatter Band LLR
AB M 12.99 1:1.15 1:1.14
AB UP 5.20 1:1.44 1:1.57
HIP M 19.37 1:1.06 1:1.04
HIP UP 4.30 1:1.22 1:1.43
SA M 8.17 1:1.03 1:1.07
SA UP 4.54 1:1.53 1:1.43
3.5. Fracture Surface Analysis
In order to holistically characterize the fatigue behaviour of the investigated material, a fracture surface analysis is carried out for every tested specimen. It is found that there are different mechanisms that cause the failure.
3.5.1. Failure from Intrinsic Imperfections
Investigating the fractured surfaces of the machined AB condition reveals that, in every case, surface-near pores are responsible for failure; see Figure11a. The size and location of the imperfection are the determining criteria in terms of the fatigue strength [72–74]. For the machined HIP test series, the failure initiates from microstructural inhomogeneities. The debonding of Si-crystals is responsible for crack initiation, which is depicted in Figure11b. This failure behaviour is already published within preliminary studies on this topic [35]. The post treatment of the SA condition is similar to the HIP treatment, which leads to a comparable microstructure. On the contrary, the fracture surface analysis displays a combined failure cause of microstructural inhomogeneities and porosity, as shown in Figure11d. The occurring porosity may be attributed to the lack of isostatic pressure during the SA treatment. To be sure about the failure mechanism, an EDX-Analysis is performed on the fractured surface. In regard to Figure11c, area ‘a’ shows a chemical composition of Al18.06Si65.41Mg16.53. Spots ‘b’
(a)
Debonding of Si-crystals Crack origin Crack propagation
Si-rich microstructural inhomogeneities
(b)
d a
b
c
(c)
Pores
Si-rich microstructural inhomogeneities
(d)
Figure 11.Fracture surface analysis of machined specimens. (a) Failure initiation spot of AB specimens. (b) Failure initiation spot of HIP specimens. (c) EDX analysis on the fractured surface of one HIPed specimen. (d) Failure initiation spot of SA specimens.
3.5.2. Failure from Surface Features
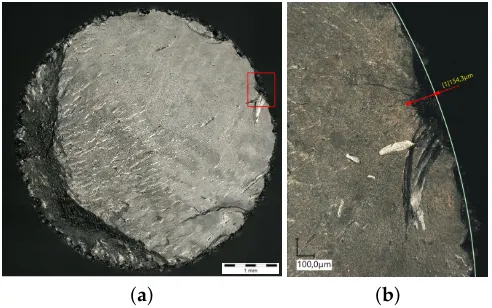
The main outcome of the fracture surface analysis for all test series and each specimen exhibiting an unprocessed surface is that the surface texture is in every case failure critical. The effect of the surface roughness dominates all other imperfections and microstructural features in terms of crack initiation and the consequential fatigue strength. This behaviour is also observed in [75]. Figure12a,b highlight the failure origin from a roughness valley. The substantive effect of the surface roughness on the fatigue strength is well reported in [76–78]. The given examples are from the unprocessed AB series. No evidence of pores or microstructural inhomogeneities is found in the surrounding area for any test series. In conclusion, one can distinctively determine the surface condition as the crucial feature, which overshadows all other failure reasons and are therefore neglectable in the presence of an unprocessed surface.
(a) (b)
3.6. Fatigue Assessment
3.6.1. Mean Stress Correction
Macroscopic residual stresses of the first order may be considered to overlay with load stresses and therefore act as mean stresses, encouraging a shift of the actual load stress ratio to an effective stress ratio Reff[79,80]. The intended testing is performed at a load stress ratio of R =−1, which means
that the mean stress is zero. Taking the effective mean stress caused by load and residual stresses into account, the load stress R-ratio is shifted to an effective R-ratio, according to Equation (4):
Re f f =
σmin+σres,ax
σmax+σres,ax. (4)
For the HIP condition, the present residual stresses lead to an effective stress ratio of Reff=−0.36
for the machined and to Reff=−0.38 for the unprocessed surface condition. The effective stress ratio
for the AB machined condition calculates to Reff= 0.09 and even to Reff= 0.1 with an unprocessed
surface. Hence, it is clearly shown that residual stresses alter the testing condition significantly. To independently assess the impact of the surface roughness, the stress amplitude is extrapolated to a ratio of R =−1. The aim is to eliminate all influencing factors but one, the surface roughness. This enables the independent quantification of it. This correction of the stress amplitude to a mean stress of zero accounts for the influence of residual stresses and simultaneously gives a conservative estimation of the endurable fatigue strength amplitude as if no residual stresses would be present. Figure13presents the mean stress corrected fatigue strength amplitude according to Gerber, which is denoted asσf,M,cor,Gin the following. The same procedure is applied for the correction according
to Dietmann, denoted asσf,M,cor,D, shown in Figure14. The results are also summarized in Table7.
Comparing both concepts, the model according to Gerber is more conservative than the Dietmann one in regard to the experimental resultsσf,exp. In conclusion, one can state that it is proven that the
residual stress state contributes in great measure to the fatigue resistance; this effect can be observed by the increase of the endurable fatigue strength amplitude for the AB and HIP condition.
The difference in the residual stress free state between AB und HIP may be attributed to beneficial microstructural changes and the different failure initiation modes for the HIP condition, as previously presented and published within [35]. Both concepts lead to similar results, estimating a benefit due to HIPing of approximately +5.8% for the machined and 23.9% for the unprocessed condition, see Table8.
0.0 0.1 0.2 0.3 0.4 0.0 0.1 0.2 0.3 0.4 0.110 0.088 0.281 0.299 M-HIP
R = 1 R = 0
Reduction of fatigue strength
due to surface roughness in residual stress free state
0.087 0.109 0.253 0.288 UP-AB M-AB
R = -1
R eff = 0.1 N o r m a l i z e d f a t i g u e s t r e n g t h a m p l i t u d e [ -]
Nomalized mean (residual) stress [-] R eff = -0.38 UP-HIP M e a n s t r e s s c o r r e c t i o n a c c o r d i n g t o G e r b e r
0.0 0.1 0.2 0.3 0.4 0.0 0.1 0.2 0.3 0.4 0.113 0.092 0.306 0.321 M-HIP
R = 1 R = 0
Reduction of fatigue strength
due to surface roughness in residual stress free state
0.087 0.109 0.253 0.288 UP-AB M-AB
R = -1
R eff = 0.1 N o r m a l i z e d f a t i g u e s t r e n g t h a m p l i t u d e [ -]
Nomalized mean (residual) stress [-] R eff = -0.38 UP-HIP M e a n s t r e s s c o r r e c t i o n a c c o r d i n g t o D ie t m a n
Figure 14.Haigh diagram with residual stresses accounted for according to Dietmann.
Table 7.Mean stress corrected fatigue strength values.
Condition Reff σf,exp σf,cor,G σf,cor,D
M-HIP −0.36 0.288 0.299 (+3.8%) 0.321 (+11.4%) UP-HIP −0.38 0.109 0.110 (+0.9%) 0.113 (+3.7%)
M-AB 0.09 0.253 0.281 (+11.1%) 0.306 (+20.9%) UP-AB 0.10 0.087 0.088 (+1.0%) 0.092 (+5.7%)
Table 8.Impact of the microstructure on the fatigue strength in residual stress free state.
Condition M-HIP to M-AB UP-HIP to UP-AB
σf,cor,G 1.064 (+6.4%) 1.250 (+25.0%)
σf,cor,D 1.052 (+5.2%) 1.228 (+22.8%)
3.6.2. Assessment of the Surface Roughness in Mean Stress Corrected State
The importance of the assessment of the surface roughness caused by the building process is obvious, since it is unequivocally found to be the fatigue strength determining factor. The fatigue test results as well as the fracture surface analysis emphasize the evaluation of the surface roughness and its influence. The results for the notch factor of all conditions are given in Tables9and10, in which the estimated fatigue strength based on the analytical model is abbreviated as σf,UP,mod, and the
experimental results are denoted asσf,UP,exp, respectively, for each unprocessed condition. As expected
based on the roughness parameters, the notch effect is more pronounced for the AB condition than for the post treated conditions. Beginning with the corrected fatigue strength of the machined condition
(σf,M,cor) and dividing it by the notch factor (Kt), which acts as a reduction factor accounting for the
surface roughness, estimates the fatigue strength of the unprocessed condition; see Equation (5):
σf,UP,mod=
σf,M,cor
Kt . (5)
stress freed state utilizing mean stress corrected values according to Gerber, see Table9and Dietmann, summarized in Table10.
Table 9.Assessment of the surface roughness on the fatigue strength after Gerber.
Condition σf,M,exp σf,M,cor,G Kt(UP) σf,UP,mod
AB 0.253 0.281 2.86 0.098
HIP 0.288 0.299 2.56 0.117
Condition σf,UP,exp σf,UP,cor,G σf,UP,modtoσf,UP,cor,G Difference
AB 0.087 0.088 1.114 +11.4%
HIP 0.109 0.110 1.064 +6.4%
Table 10.Assessment of the surface roughness on the fatigue strength after Dietmann.
Condition σf,M,exp σf,M,cor,D Kt(UP) σf,UP,mod
AB 0.253 0.306 2.86 0.107
HIP 0.288 0.321 2.56 0.125
Condition σf,UP,exp σf,UP,cor,D σf,UP,modtoσf,UP,cor,D Difference
AB 0.087 0.092 1.163 +16.3%
HIP 0.109 0.113 1.106 +10.6%
Both concepts present a minor non-conservative approach, but the scatter band (1:Ts) in the long life region of 1:57 for the UP-AB, and 1:43 for the UP-HIP condition, as given in Table6, needs to be considered as well. Consequently, the estimated mean fatigue strength is well within the scattering of the experimental results.
The above presented concept is utilized to predict the fatigue strength of the SA condition. Both of the others, AB and HIP, reveal in machined and unprocessed conditions the same effective stress ratio due to residual stresses because only the residual stresses in unprocessed SA conditions are measured, assuming the same R-ratio in machined conditions. Applying this procedure, the fatigue strength of the machined SA condition can be properly predicted with both concepts, denoted asσf,M,pred,G/D. The deviation from the experimental results is calculated to only +3.4%; see Table11.
Table 11.Fatigue strength assessment of the SA condition.
Condition Reff,M,UP σf,UP,exp σf,UP,cor,G σf,UP,cor,D Kt(UP)
SA −0.31 0.109 0.110 0.114 2.54
σf,M,cor,G σf,M,cor,D σf,M,pred,G σf,M,pred,D σf,M,exp
0.279 0.290 0.277 (+3.4%) 0.277 (+3.4%) 0.268 (Base)
4. Discussion
Based on the results presented in this paper, the fatigue strength of additively manufactured AlSi10Mg structures is altered by post treatments, the residual stress state and the surface condition. The fatigue strength is improved by HIPing and solution annealing, for a machined as well as a unprocessed surface, compared to the AB condition. This study also proves a beneficial effect of the investigated post treatments on the microstructure and consequently on fatigue.
the HIP process. The maximum roughness valley depth is decreased and furthermore the average roughness valley radius is mitigated compared to the AB condition. These beneficial changes to the surface topography contribute to an improved fatigue behaviour of +25.3% for both conditions compared to the AB condition.
This work leads to the conclusion that the residual stress state at the respective failure origin can be considered as a present mean stress, whereby a shift of the intended load stress ratio to an effective stress ratio occurs. Another finding of the conducted investigations is that, due to the heat influence of the post treatments, residual stresses are reduced by roughly 50%. An analysis of the in-depth progression reveals increased tensile residual stresses compared to the surface by a factor of almost three. By the means of the presented methodology, a prediction of the reduced fatigue strength of unprocessed specimen, in relation to the machined condition, is given. The developed model is shown to be well applicable to the investigated test series in a residual stress free state. Although the fatigue strength amplitude prediction is slightly non-conservative, the estimation is well within the scatter band of the the experimental results in the long life region.
Author Contributions: Conceptualization, W.S. and M.L.; methodology, W.S. and M.L.; validation, W.S. and M.L.; formal analysis, W.S.; investigation, W.S., S.P. and S.S.; resources, W.S.; data curation, W.S. and F.B.; writing—original draft preparation, W.S.; writing—review and editing, W.S. and M.L.; visualization, W.S.; supervision, M.L. and F.G.; project administration, M.L. and F.G.
Funding:This research received no external funding.
Acknowledgments: Special thanks are givento the Austrian Research Promotion Agency (FFG), who funded the research project by funds of the Federal Ministry for Transport, Innovation and Technology (bmvit) and the Federal Ministry for Digital and Economic Affairs (bmdw). Scientific support regarding the optical surface topography measurement and evaluation was provided in the course of the “Christian Doppler Laboratory for Manufacturing Process based Component Design”.
Conflicts of Interest:The authors declare no conflict of interest.
References
1. Leary, M.; Mazur, M.; Elambasseril, J.; McMillan, M.; Chirent, T.; Sun, Y.; Qian, M.; Easton, M.; Brandt, M. Selective laser melting (SLM) of AlSi12Mg lattice structures.Mater. Des.2016,98, 344–357. [CrossRef] 2. Brandt, M.; Sun, S.J.; Leary, M.; Feih, S.; Elambasseril, J.; Liu, Q.C. High-Value SLM Aerospace Components:
From Design to Manufacture. Adv. Mater. Res.2013,633, 135–147. [CrossRef]
3. Wang, X.; Xu, S.; Zhou, S.; Xu, W.; Leary, M.; Choong, P.; Qian, M.; Brandt, M.; Xie, Y.M. Topological design and additive manufacturing of porous metals for bone scaffolds and orthopaedic implants: A review.
Biomaterials2016,83, 127–141. [CrossRef] [PubMed]
4. Harun, W.; Kamariah, M.; Muhamad, N.; Ghani, S.; Ahmad, F.; Mohamed, Z. A review of powder additive manufacturing processes for metallic biomaterials. Powder Technol.2018,327, 128–151. [CrossRef]
5. Huynh, L.; Rotella, J.; Sangid, M.D. Fatigue behavior of IN718 microtrusses produced via additive manufacturing. Mater. Des.2016,105, 278–289. [CrossRef]
6. Koutiri, I.; Pessard, E.; Peyre, P.; Amlou, O.; de Terris, T. Influence of SLM process parameters on the surface finish, porosity rate and fatigue behavior of as-built Inconel 625 parts. J. Mater. Process. Technol. 2018,
255, 536–546. [CrossRef]
7. Vayssette, B.; Saintier, N.; Brugger, C.; Elmay, M.; Pessard, E. Surface roughness of Ti-6Al-4V parts obtained by SLM and EBM: Effect on the High Cycle Fatigue life. Procedia Eng.2018,213, 89–97. [CrossRef]
8. Campbell, G.; Lahey, R. A survey of serious aircraft accidents involving fatigue fracture. Int. J. Fatigue1984,
6, 25–30. [CrossRef]
9. Uzan, N.E.; Shneck, R.; Yeheskel, O.; Frage, N. Fatigue of AlSi10Mg specimens fabricated by additive manufacturing selective laser melting (AM-SLM).Mater. Sci. Eng. A2017,704, 229–237. [CrossRef] 10. Aboulkhair, N.T.; Maskery, I.; Tuck, C.; Ashcroft, I.; Everitt, N.M. Improving the fatigue behaviour of
a selectively laser melted aluminium alloy: Influence of heat treatment and surface quality. Mater. Des.2016,
11. Afkhami, S.; Dabiri, M.; Alavi, S.H.; Björk, T.; Salminen, A. Fatigue characteristics of steels manufactured by selective laser melting. Int. J. Fatigue2019,122, 72–83. [CrossRef]
12. Liu, Y.J.; Li, S.J.; Wang, H.L.; Hou, W.T.; Hao, Y.L.; Yang, R.; Sercombe, T.B.; Zhang, L.C. Microstructure, defects and mechanical behavior of beta-type titanium porous structures manufactured by electron beam melting and selective laser melting. Acta Mater.2016,113, 56–67. [CrossRef]
13. Dai, D.; Gu, D. Effect of metal vaporization behavior on keyhole-mode surface morphology of selective laser melted composites using different protective atmospheres. Appl. Surf. Sci.2015,355, 310–319. [CrossRef] 14. Gaytan, S.M.; Murr, L.E.; Medina, F.; Martinez, E.; Lopez, M.I.; Wicker, R.B. Advanced metal powder
based manufacturing of complex components by electron beam melting. Mater. Technol.2013,24, 180–190. [CrossRef]
15. Zhang, L.C.; Attar, H. Selective Laser Melting of Titanium Alloys and Titanium Matrix Composites for Biomedical Applications: A Review. Adv. Eng. Mater.2016,18, 463–475. [CrossRef]
16. Zhao, S.; Li, S.J.; Wang, S.G.; Hou, W.T.; Li, Y.; Zhang, L.C.; Hao, Y.L.; Yang, R.; Misra, R.; Murr, L.E. Compressive and fatigue behavior of functionally graded Ti-6Al-4V meshes fabricated by electron beam melting. Acta Mater.2018,150, 1–15. [CrossRef]
17. Liu, Y.J.; Wang, H.L.; Li, S.J.; Wang, S.G.; Wang, W.J.; Hou, W.T.; Hao, Y.L.; Yang, R.; Zhang, L.C. Compressive and fatigue behavior of beta-type titanium porous structures fabricated by electron beam melting.Acta Mater.
2017,126, 58–66. [CrossRef]
18. Ceschini, L.; Morri, A.; Sambogna, G. The effect of hot isostatic pressing on the fatigue behaviour of sand-cast A356-T6 and A204-T6 aluminum alloys.J. Mater. Process. Technol.2008,204, 231–238. [CrossRef]
19. Domfang Ngnekou, J.N.; Nadot, Y.; Henaff, G.; Nicolai, J.; Ridosz, L. Influence of defect size on the fatigue resistance of AlSi10Mg alloy elaborated by selective laser melting (SLM). Procedia Struct. Integr. 2017,
7, 75–83. [CrossRef]
20. Domfang Ngnekou, J.N.; Nadot, Y.; Henaff, G.; Nicolai, J.; Kan, W.H.; Cairney, J.M.; Ridosz, L. Fatigue properties of AlSi10Mg produced by Additive Layer Manufacturing. Int. J. Fatigue2019,119, 160–172. [CrossRef]
21. Lee, M.H.; Kim, J.J.; Kim, K.H.; Kim, N.J.; Lee, S.; Lee, E.W. Effects of HIPping on high-cycle fatigue properties of investment cast A356 aluminum alloys. Mater. Sci. Eng. A2003,340, 123–129. [CrossRef] 22. Wang, Q.; Apelian, D.; Lados, D. Fatigue behavior of A356-T6 aluminum cast alloys. Part I. Effect of casting
defects. J. Light Met.2001,1, 73–84. [CrossRef]
23. Wang, Q.; Apelian, D.; Lados, D. Fatigue behavior of A356/357 aluminum cast alloys. Part II – Effect of microstructural constituents.J. Light Met.2001,1, 85–97. [CrossRef]
24. Herzog, D.; Seyda, V.; Wycisk, E.; Emmelmann, C. Additive manufacturing of metals. Acta Mater.2016,
117, 371–392. [CrossRef]
25. Beretta, S.; Romano, S. A comparison of fatigue strength sensitivity to defects for materials manufactured by AM or traditional processes. Int. J. Fatigue2017,94, 178–191. [CrossRef]
26. Buffiere, J.Y. Fatigue Crack Initiation In addition, Propagation From Defects In Metals: Is 3D Characterization Important? Procedia Struct. Integr.2017,7, 27–32. [CrossRef]
27. Ngnekou, J.N.D.; Henaff, G.; Nadot, Y.; Nicolai, J.; Ridosz, L. Fatigue resistance of selectively laser melted aluminum alloy under T6 heat treatment.Procedia Eng.2018,213, 79–88. [CrossRef]
28. Brandl, E.; Heckenberger, U.; Holzinger, V.; Buchbinder, D. Additive manufactured AlSi10Mg samples using Selective Laser Melting (SLM): Microstructure, high cycle fatigue, and fracture behavior.Mater. Des.2012,
34, 159–169. [CrossRef]
29. Arola, D.; Williams, C. Estimating the fatigue stress concentration factor of machined surfaces. Int. J. Fatigue
2002,24, 923–930. [CrossRef]
30. Peterson, R.E.; Plunkett, R. Stress Concentration Factors.J. Appl. Mech.1975,42, 248. [CrossRef]
31. Webster, G.A.; Ezeilo, A.N. Residual stress distributions and their influence on fatigue lifetimes.Int. J. Fatigue
2001,23, 375–383. [CrossRef]
32. Zhuang, W.Z.; Halford, G.R. Investigation of residual stress relaxation under cyclic load. Int. J. Fatigue2001,
33. EOS GmbH—Electro Optical Systems. Data Sheet: EOS Aluminium AlSi10Mg; EOS GmbH—Electro Optical Systems: Krailling, Germany, 2014.
34. European Comittee for Standardization (CEN). Aluminium and Aluminium Alloys—Castings—Chemical Composition and Mechanical Properties; European Comittee for Standardization: Brussels, Belgium, 2010. 35. Schneller, W.; Leitner, M.; Springer, S.; Grün, F.; Taschauer, M. Effect of HIP Treatment on Microstructure
and Fatigue Strength of Selectively Laser Melted AlSi10Mg. J. Manuf. Mater. Process.2019,3, 16. [CrossRef] 36. ASTM.ASTM E1508-98 (2003), Standard Guide for Quantitative Analysis by Energy-Dispersive Spectroscopy;
ASTM: West Conshohocken, PA, USA, 2012.
37. Takata, N.; Kodaira, H.; Sekizawa, K.; Suzuki, A.; Kobashi, M. Change in microstructure of selectively laser melted AlSi10Mg alloy with heat treatments. Mater. Sci. Eng. A2017,704, 218–228. [CrossRef]
38. Li, W.; Li, S.; Liu, J.; Zhang, A.; Zhou, Y.; Wei, Q.; Yan, C.; Shi, Y. Effect of heat treatment on AlSi10Mg alloy fabricated by selective laser melting: Microstructure evolution, mechanical properties and fracture mechanism.Mater. Sci. Eng. A2016,663, 116–125. [CrossRef]
39. Tensi, H.M.; Hogerl, J. Influence of Heat Treatment on the Microstructure and Mechanical Behavior of High Strength AlSi Cast Alloys. InHeat Treating, Proceedings of the 16th Conference; Dossett, J.L., Luetje, R.E., Eds.; ASM International: Materials Park, OH, USA, 2010; pp. 243–247.
40. Cai, C.; Geng, H.; Wang, S.; Gong, B.; Zhang, Z. Microstructure Evolution of AlSi10Mg(Cu) Alloy Related to Isothermal Exposure.Materials2018,11, 809. [CrossRef]
41. Nicholas, T. High Cycle Fatigue: A Mechanics of Materials Perspective, 1st ed.; Elsevier: Amsterdam, The Netherlands, 2006.
42. Gänser, H.P.; Maierhofer, J.; Christiner, T. Statistical correction for reinserted runouts in fatigue testing.
Int. J. Fatigue2015,80, 76–80. [CrossRef]
43. Dengel, D. Die arc sin√P-Transformation—Ein einfaches Verfahren zur grafischen und rechnerischen Auswertung geplanter Wöhlerversuche. Mater. Werkst.1975,6, 253–261. [CrossRef]
44. ASTM International. Standard Practice for Statistical Analysis of Linear or Linearized Stress-Life (S-N) and Strain-Life (e-N) Fatigue Data; ASTM: West Conshohocken, PA, USA, 2015.
45. Bader, Q. Kadum, A. Mean Stress Correction Effects On the Fatigue Life Behavior of Steel Alloys by Using Stress Life Approach Theories.Int. J. Eng. Technol.2014,10, 50–58.
46. Dowling, N.E.; Calhoun, C.A.; Arcari, A. Mean stress effects in stress-life fatigue and the Walker equation.
Fatigue Fract. Eng. Mater. Struct.2009,32, 163–179. [CrossRef]
47. Pallarés-Santasmartas, L.; Albizuri, J.; Avilés, A.; Avilés, R. Mean Stress Effect on the Axial Fatigue Strength of DIN 34CrNiMo6 Quenched and Tempered Steel.Metals2018,8, 213. [CrossRef]
48. Gerber, H. Bestimmung der zulässigen Spannungen in Eisenkonstruktionen. Z. Bayrischen Arch. Ing. Vereins
1874,6, 101–110.
49. Dietman, H. Festigkeitsberechnung bei Mehrachsiger Schwingbeanspruchung. Konstruktion 1973, 25, 181–189.
50. Mercelis, P.; Kruth, J.P. Residual stresses in selective laser sintering and selective laser melting.
Rapid Prototyp. J.2006,12, 254–265. [CrossRef]
51. Wang, L.; Jiang, X.; Zhu, Y.; Ding, Z.; Zhu, X.; Sun, J.; Yan, B. Investigation of Performance and Residual Stress Generation of AlSi10Mg Processed by Selective Laser Melting. Adv. Mater. Sci. Eng.2018,2018, 1–12. [CrossRef]
52. ASTM. ASTM, E915-96(2002), Standard Test Method for Verifying the Alignment of X-ray Diffraction Instrumentation for Residual Stress Measurement; ASTM International: West Conshohocken, PA, USA, 2012. 53. ASTM.ASTM, E2860-12, Standard Test Method for Residual Stress Measurement by X-ray Diffraction for Bearing
Steels; ASTM International: West Conshohocken, PA, USA, 2012.
54. DIN. DIN EN ISO 4287: 2010-07, Geometrische Produktspezifikation (GPS)—Oberflächenbeschaffenheit: Tastschnittverfahren— Benennungen, Definitionen und Kenngrößen der Oberflächenbeschaffenheit; Beuth: Berlin, Germany, 2010. [CrossRef]
55. Pomberger, S.; Stoschka, M.; Leitner, M. Cast surface texture characterisation via areal roughness.Precis. Eng.
56. Tang, M.; Pistorius, P.C.; Narra, S.; Beuth, J.L. Rapid Solidification: Selective Laser Melting of AlSi10Mg.
JOM2016,68, 960–966. [CrossRef]
57. Dai, D.; Gu, D.; Zhang, H.; Zhang, J.; Du, Y.; Zhao, T.; Hong, C.; Gasser, A.; Poprawe, R. Heat-induced molten pool boundary softening behavior and its effect on tensile properties of laser additive manufactured aluminum alloy. Vacuum2018,154, 341–350. [CrossRef]
58. Islam, M.A.; Farhat, Z.N. The influence of porosity and hot isostatic pressing treatment on wear characteristics of cast and P/M aluminum alloys. Wear2011,271, 1594–1601. [CrossRef]
59. Bösch, D.; Pogatscher, S.; Hummel, M.; Fragner, W.; Uggowitzer, P.J.; Göken, M.; Höppel, H.W. Secondary Al-Si-Mg High-pressure Die Casting Alloys with Enhanced Ductility. Metall. Mater. Trans. A2015,
46, 1035–1045. [CrossRef]
60. Mulazimoglu, M.H.; Zaluska, A.; Gruzleski, J.E.; Paray, F. Electron microscope study of Al-Fe-Si intermetallics in 6201 aluminum alloy. Metall. Mater. Trans. A1996,27, 929–936. [CrossRef]
61. Zhou, L.; Mehta, A.; Schulz, E.; McWilliams, B.; Cho, K.; Sohn, Y. Microstructure, precipitates and hardness of selectively laser melted AlSi10Mg alloy before and after heat treatment.Mater. Charact.2018,143, 5–17. [CrossRef]
62. Maamoun, A.H.; Elbestawi, M.; Dosbaeva, G.K.; Veldhuis, S.C. Thermal post-processing of AlSi10Mg parts produced by Selective Laser Melting using recycled powder.Addit. Manuf.2018,21, 234–247. [CrossRef] 63. Prashanth, K.G.; Scudino, S.; Klauss, H.J.; Surreddi, K.B.; Löber, L.; Wang, Z.; Chaubey, A.K.; Kühn, U.;
Eckert, J. Microstructure and mechanical properties of Al–12Si produced by selective laser melting: Effect of heat treatment.Mater. Sci. Eng. A2014,590, 153–160. [CrossRef]
64. Fousová, M.; Dvorský, D.; Michalcová, A.; Vojtˇech, D. Changes in the microstructure and mechanical properties of additively manufactured AlSi10Mg alloy after exposure to elevated temperatures.
Mater. Charact.2018,137, 119–126. [CrossRef]
65. Chrominski, W.; Lewandowska, M. Precipitation phenomena in ultrafine grained Al–Mg–Si alloy with heterogeneous microstructure. Acta Mater.2016,103, 547–557. [CrossRef]
66. Gall, K.; Yang, N.; Horstemeyer, M.; McDowell, D.L.; Fan, J. The debonding and fracture of Si particles during the fatigue of a cast Al-Si alloy. Metall. Mater. Trans. A1999,30, 3079–3088. [CrossRef]
67. Edwards, P.; Ramulu, M. Fatigue performance evaluation of selective laser melted Ti–6Al–4V.Mater. Sci. Eng. A2014,598, 327–337. [CrossRef]
68. Biffi, C.A.; Fiocchi, J.; Tuissi, A. Selective laser melting of AlSi10 Mg: Influence of process parameters on Mg2Si precipitation and Si spheroidization. J. Alloys Compd.2018,755, 100–107. [CrossRef]
69. Withers, P.J.; Bhadeshia, H. Residual stress. Part 1—Measurement techniques. Mater. Sci. Technol.2013,
17, 355–365. [CrossRef]
70. Aigner, R.; Leitner, M.; Stoschka, M. On the mean stress sensitivity of cast aluminium considering imperfections. Mater. Sci. Eng. A2019,758, 172–184. [CrossRef]
71. Townsend, A.; Senin, N.; Blunt, L.; Leach, R.K.; Taylor, J.S. Surface texture metrology for metal additive manufacturing: A review. Precis. Eng.2016,46, 34–47. [CrossRef]
72. Masuo, H.; Tanaka, Y.; Morokoshi, S.; Yagura, H.; Uchida, T.; Yamamoto, Y.; Murakami, Y. Effects of Defects, Surface Roughness and HIP on Fatigue Strength of Ti-6Al-4V manufactured by Additive Manufacturing.
Procedia Struct. Integr.2017,7, 19–26. [CrossRef]
73. Romano, S.; Beretta, S.; Brandão, A.; Gumpinger, J.; Ghidini, T. HCF resistance of AlSi10Mg produced by SLM in relation to the presence of defects. Procedia Struct. Integr.2017,7, 101–108. [CrossRef]
74. Romano, S.; Brückner-Foit, A.; Brandão, A.; Gumpinger, J.; Ghidini, T.; Beretta, S. Fatigue properties of AlSi10Mg obtained by additive manufacturing: Defect-based modelling and prediction of fatigue strength.
Eng. Fract. Mech.2018,187, 165–189. [CrossRef]
75. Romano, S.; Brandão, A.; Gumpinger, J.; Gschweitl, M.; Beretta, S. Qualification of AM parts: Extreme value statistics applied to tomographic measurements.Mater. Des.2017,131, 32–48. [CrossRef]
76. Greitemeier, D.; Dalle Donne, C.; Syassen, F.; Eufinger, J.; Melz, T. Effect of surface roughness on fatigue performance of additive manufactured Ti–6Al–4V.Mater. Sci. Technol.2015,32, 629–634. [CrossRef] 77. Pegues, J.; Roach, M.; Scott Williamson, R.; Shamsaei, N. Surface roughness effects on the fatigue strength of
78. Da Silva, P.S.C.P.; Campanelli, L.C.; Escobar Claros, C.A.; Ferreira, T.; Oliveira, D.P.; Bolfarini, C. Prediction of the surface finishing roughness effect on the fatigue resistance of Ti-6Al-4V ELI for implants applications.
Int. J. Fatigue2017,103, 258–263. [CrossRef]
79. Wolfstieg, U.; Macherauch, E. Ursachen und Bewertung von Eigenspannungen.Chem. Ing. Tech. CIT1973,
45, 760–770. [CrossRef]
80. Kloos, K.H. Eigenspannungen, Definition und Entstehungsursachen. Mater. Werkst. 1979,10, 293–302. [CrossRef]