www.ocean-sci.net/12/633/2016/ doi:10.5194/os-12-633-2016
© Author(s) 2016. CC Attribution 3.0 License.
Technical note: Harmonising metocean model data via standard
web services within small research groups
Richard P. Signell1and Elena Camossi2
1USGS Woods Hole Coastal and Marine Science Center, Woods Hole, MA, USA
2NATO Science & Technology Organization, Centre for Maritime Research and Experimentation, La Spezia, Italy
Correspondence to: Richard P. Signell ([email protected])
Received: 17 July 2015 – Published in Ocean Sci. Discuss.: 5 November 2015 Revised: 22 February 2016 – Accepted: 21 March 2016 – Published: 4 May 2016
Abstract. Work over the last decade has resulted in standard-ised web services and tools that can significantly improve the efficiency and effectiveness of working with meteorological and ocean model data. While many operational modelling centres have enabled query and access to data via common web services, most small research groups have not. The pen-etration of this approach into the research community, where IT resources are limited, can be dramatically improved by (1) making it simple for providers to enable web service ac-cess to existing output files; (2) using free technologies that are easy to deploy and configure; and (3) providing standard-ised, service-based tools that work in existing research envi-ronments. We present a simple, local brokering approach that lets modellers continue to use their existing files and tools, while serving virtual data sets that can be used with standard-ised tools. The goal of this paper is to convince modellers that a standardised framework is not only useful but can be imple-mented with modest effort using free software components. We use NetCDF Markup language for data aggregation and standardisation, the THREDDS Data Server for data deliv-ery, pycsw for data search, NCTOOLBOX (MATLAB®) and Iris (Python) for data access, and Open Geospatial Consor-tium Web Map Service for data preview. We illustrate the effectiveness of this approach with two use cases involving small research modelling groups at NATO and USGS.
1 Introduction
Efficient and effective access to meteorological and ocean model data is essential for a wide range of applications, from global climate assessment to regional oceanographic studies. While systems such as Earth System Grid Federation (Bern-holdt et al., 2005) are in place for global climate projects, there are often no systems to search for and work with model data produced by smaller research groups. While these re-search groups may not produce the 10 s of petabytes of data produced by the climate community, they often have signifi-cant holdings in the 10–100 TB range, too much to be deliv-ered and handled by regional and national data centres. As they already store the data for local use, it makes sense to also serve these data to the public using standardised web services. Even for data that are not meant for public con-sumption, the use of a private service-based approach can make working with data within a research group more effec-tive. These data typically come from models using different conventions for specifying horizontal and vertical grid infor-mation, time units and variable attributes, requiring model-specific tools.
Observa-tion System of Systems (GEOSS) portal1 enables access to Earth observations collected worldwide and services for en-vironmental research focusing on societal benefit areas such as agriculture, biodiversity, climate, disasters, ecosystems, energy, health and water. Copernicus2, the European contri-bution to GEOSS, is an Earth observation system for high-quality harmonised data and models for land, marine, atmo-sphere, climate change, emergency management and secu-rity issues. The United States Integrated Ocean Observing System (IOOS) is another such system, directly contributing to the Global Ocean Observing System (GOOS), the marine component of GEOSS.
These systems facilitate data sharing at national, regional and global level, adopting a brokering approach that leaves resource providers free to use the model and data format they prefer, with data harmonised downstream of the service provider. This allows researchers to continue using their ex-isting custom data systems, while exploring the benefits of newer standardised approaches.
The same approach has been implemented by IOOS (Signell, 2010; Signell and Snowden, 2014) to achieve ocean data interoperability: IOOS standardises data models and ser-vices for ocean models across national and regional mod-elling centres by allowing a brokering approach to be im-plemented at the provider institution. This type of system, if made easy to install and learn, can be used effectively by small research groups.
Herein we present two use cases where the IOOS sys-tem is applied to modelling data which are primarily in-tended for in house use, and only certain data sets are meant to be accessible to the outside world. Even within a scien-tific group, the system enables search capability across mul-tiple investigator and collaborator data sets and uniformity of access, which empowers and simplifies scientific analysis workflows. It also allows a standard way to make data ac-cessible (with metadata) to the world, which can meet data publishing requirements of government agencies as well as plugging into an international network of data providers.
The main objectives of the paper are to (1) highlight the benefits of a standardised framework for ocean data, specif-ically in terms of facilitating scientists willing to share their data and enabling them to effectively access harmonised data and (2) demonstrate that a standardised framework can be implemented with modest effort integrating existing open source software components. For those seeking to imple-ment the framework, full details on downloading, installing, configuring and using the components are maintained on the IOOS GitHub site3.
We first describe the model data strategy used by IOOS, then describe the techniques and tools we have developed to make this strategy easier and more effective for smaller
1http://www.geoportal.org/ 2http://www.copernicus.eu/
3https://github.com/ioos/model-data-framework/
research groups. After presenting the use cases we discuss lessons learned and the need for future work.
2 The IOOS model data framework
The IOOS model data framework is built around commu-nity and international standards for data models and web ser-vices (de La Beaujardière et al., 2009; Howlett et al., 2014). The infrastructure requires that gridded data be delivered via the Open-source Project for a Network Data Access Protocol (OPeNDAP) service with climate and forecast (CF) conven-tions and for images of data, via the OGC Web Map Service (WMS). OPeNDAP is used because Open Geospatial Con-sortium (OGC) services are not currently capable of deliver-ing CF-compliant model data in a standardised way.
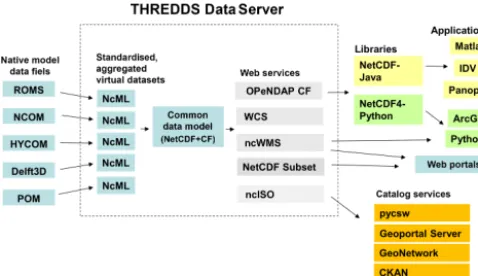
Although a variety of tools can be used to deliver OPeN-DAP and WMS services, one convenient method is to utilise the THREDDS Data Server (TDS) from Unidata4as a local broker, turning collections of non-standard data files from modellers into aggregated, standardised data sets delivered by web services (Signell, 2010; Bergamasco et al., 2012; Signell and Snowden, 2014). The transformation happens virtually, using NetCDF Markup Language (NcML), with XML templates created by specialists with knowledge of the standards, and then modified by modellers to suit their output. The data are represented internally in the TDS with a common data model aligned with the CF conventions that delivers the data through a variety of web services, including OPeNDAP, WMS and NetCDF Subset Service. It also in-cludes a ncISO service that generates an ISO 19115 compli-ant metadata record for each data set based on the attributes in the input files and the NcML (Fig. 1).
In addition to tools to provide standardised data distribu-tion and access, it is also useful to have tools that allow in-vestigators to search for data sets based on geospatial ex-tent, time range, keywords and other descriptors (e.g. vari-ables of interest). There are many catalogue systems that can ingest metadata from ISO records or other sources, and en-able searching across distributed geospatial data sets, includ-ing GeoNetwork5, Geoportal Server6, GI-cat7, CKAN8 and pycsw9.
3 A procedure for small research groups
The following is an approach for enabling model data in-teroperability for small research groups, utilising procedures
4THREDDS Data Server, available at http://www.unidata.ucar.
Figure 1. The IOOS model data framework. Collections of
non-standard NetCDF (or GRIB) files are transformed via NetCDF Markup Language (NcML) into aggregated, standardised data sets that can be represented internally in the THREDDS Data Server in a common data model. This data in common form can then be de-livered via a number of standard services, including map services (WMS), data services (OPeNDAP, WCS and NetCDF Subset Ser-vice) and metadata services (ncISO). This services in turn feed web portals, scientific analysis workflows in Python or MATLAB and catalogue services.
and a collection of technologies developed over a period of several years within the US IOOS program. We describe the components in the following order: data delivery, access, search and preview. We then present two test cases where this approach has been used: the first within the NATO Science and Technology Organization, Centre for Maritime Research and Experimentation (STO-CMRE); and the second within the USGS CMG Sediment Transport Modeling Group.
3.1 Data delivery
Delivery of data is accomplished with the TDS. The first step is to install the TDS, a Java Servlet application which can be installed in a few hours following the TDS administra-tion tutorial10, or even faster by using a Docker container11. The installation is a cookbook procedure not involving spe-cial knowledge or skills on the part of the system adminis-trator. Once installed, the TDS is configured to dynamically scan targeted directories for data of specified types. For ex-ample, the directory “/data/shared” could be scanned for files ending with “.nc, .cdf, .grib, .grb and .ncml”. This means that any file of these types that are placed in this directory, or in a subdirectory below this directory, are immediately accessible via the TDS.
The TDS can be installed on a server with modest com-putational resources, since the TDS does not actually do much work. It does, however, benefit from having a mod-erate amount of memory available (e.g. more than 4 GB). In
10http://www.unidata.ucar.edu/software/thredds/current/tds/
tutorial/index.html
11https://hub.docker.com/r/axiom/docker-thredds/
addition, because data requests to the TDS extract data in disk, users of the TDS will benefit from faster disk access (e.g. local disk over remotely mounted disk).
With the TDS configured with a datasetScan, modellers can create a subdirectory for their simulation, deposit the col-lection of NetCDF (or GRIB) files that make up the simula-tion and then add a single NcML file. The NcML is an XML file that contains the information the TDS uses to virtually aggregate the data and add or modify metadata to meet the CF conventions. When this NcML file is accessed through the TDS, the aggregated standardised data set can then be accessed through all the TDS web services, including OPeN-DAP, NetCDF Subset Service, WMS and the ncISO metadata service. If the data set has one-dimensional longitude, lat-itude and depth coordinates, it can also be delivered via the OGC Web Coverage Service (WCS). This NcML approach is convenient for model data providers as no reload or restart of the TDS is necessary. This is quite useful, as modellers often have a large collection of simulations that test the sensitiv-ity to changes in parameterisations, data assimilation tech-niques, boundary conditions, etc.
For forecast models, a slightly different approach is needed, as forecast time periods overlap and the files can-not be simply joined along the time dimension. In this case, the NcML Forecast Model Run Collection is used, which vir-tually creates a “best time series” and other data set views of the forecast collection. This type of NcML must be added to static TDS catalogues. While new forecast data can be added to forecast aggregation without reloading the server, any modification to the static catalogues requires a restart of the TDS. This is usually not a major issue as groups typically only have one or two forecast models running.
3.2 Data access
Typically, users access the data directly from their developer environment, e.g. MATLAB® or Python, using the OPeN-DAP service. This allows them to extract just the part of the data set they need directly into their workflow, without downloading any files. If the extracted data are to be used re-peatedly, however, a local copy of the extracted data can be saved as a NetCDF file using the TDS NetCDF Subset Ser-vice. Fortunately, both the MATLAB®and Python tools can open a remote OPeNDAP data set or a local NetCDF file us-ing exactly the same syntax, so users need only to learn one syntax for extracting data. Although we focus on MATLAB and Python here, any software that can read NetCDF files can open the URL of a remote OPeNDAP data set just as if it were a local NetCDF File. There is a list of over 50 soft-ware packages that can read NetCDF and OPeNDAP main-tained by Unidata, including ArcGIS, IDL, Mathematica and more12.
12Software for Manipulating or Displaying NetCDF Data,
For MATLAB®, NCTOOLBOX13 provides support for the CF conventions by leveraging the Unidata NetCDF–Java library behind a simple MATLAB®interface. For Python, the Iris package14from the British Met Office provides support for the CF conventions by leveraging the Unidata NetCDF C library behind a Python interface. Both of these tools allow users to work with any CF-compliant model without writ-ing any model-specific code: the user requests data from a specified time and geospatial extent, and the software auto-matically returns the longitude, latitude, depth and time co-ordinates in standard form, regardless of the variable naming conventions, time units and vertical coordinate system spec-ification in the original native model data files. This greatly facilitates model–model comparison and skill assessment, as users can bring in data from a variety of models without spe-cialised knowledge of any of them.
3.3 Data search
Although there are many free metadata catalogue systems that can enable geospatial and temporal searches across dis-tributed data, here we use pycsw, a lightweight system that provides an OGC-certified compliant catalogue with ser-vice for the web (CSW) search capability. It is easy to in-stall, configure and maintain via the command line, allowing easy scripting capability. The CSW service allows for com-plex queries to be constructed. These queries often include a geospatial bounding box, a temporal extent and specific text strings that should be either included or excluded. We popu-late the pycsw catalogue by ingesting ISO 19115 compliant metadata records that have been collected from selected TDS data sets.
The TDS data sets are selected by running a Python script that crawls a list of local or remote THREDDS catalogues, enabling filtering on specific types of data sets (see the code in Fig. 2). For example, we can specify for a specific THREDDS catalogue that only metadata from .ncml files should be harvested, while data from .nc files should be ig-nored. For hindcast data sets configured with the datasetScan approach described previously, this allows only the aggre-gated data sets to be harvested, and the underlining finer data sets to be ignored. For forecast data sets that update period-ically, we can run the Python script regularly using a sched-uler (e.g. Linux cron) so the metadata are updated accord-ingly.
3.4 Data preview
The WMS services included in the TDS are provided by the ncWMS package (Blower et al., 2013), which introduced
13NCTOOLBOX, A MATLAB®toolbox for working with
com-mon data model data sets, available at http://nctoolbox.github.io/ nctoolbox/
14Iris, A Python library for Meteorology and Climatology,
avail-able at http://scitools.org.uk/iris/
Figure 2. Snippet of Python code to crawl THREDDS catalogues.
This code crawls two catalogues that contain forecast model runs and glider data. ©2016 North Atlantic Treaty Organization. All rights reserved. Provided by STO-CMRE (www.cmre.nato.int).
some important extensions15to effectively create maps from large multidimensional arrays of data. The most important of these extensions is the ability to specify colour scale ranges. The OGC originally developed WMS to deliver static images in a variety of projections in response to queries that speci-fied a specific bounding box and time. The TDS ncWMS ex-tends this to deliver dynamically generated images that map data onto colour ranges specified by the user. This allows users, for example, to effectively explore spatial structure from global scale to local bays and from winter to summer conditions.
There are many clients that can consume WMS services, including GIS packages such as ArcGIS and QGIS, but these do not typically provide support for the custom extensions provided by ncWMS. Fortunately, the TDS also includes the Godiva2 WMS client which allows for simple preview of in-dividual data sets by providing a web-based GUI that inter-faces with the ncWMS services (Blower et al., 2009).
4 Use cases
We now describe two specific instances where the approach was implemented, discussing the issues and lessons learned, in order to improve the approach.
4.1 Centre for Maritime Research and Experimentation (CMRE)
The Centre for Maritime Research and Experimentation (CMRE) of NATO Science and Technology Organization is a research institution active in ocean science, underwater robotics, optics and acoustics. CMRE regularly conducts fo-cused oceanographic cruises in various regions of the ocean,
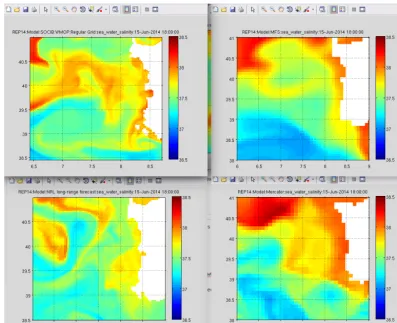
Figure 3. Comparison of surface salinity snapshots from four different models during REP14-MED field trial. By delivering data via web
services with CF conventions and using NCTOOLBOX which understands CF conventions, these figures were able to be made without any model-specific code.©North Atlantic Treaty Organization, all rights reserved. Provided by STO-CMRE.
involving multiple nations and research institutions, who gather to run experiments integrating data collected from het-erogeneous ocean observing networks comprising variegate assets, such as in situ sensors, remote sensing and numerical models.
During oceanographic experiments, real-time data are in-gested in the CMRE scientific data management infrastruc-ture, facilitating data sharing among CMRE scientists and partners. A continuous deployment service automatically ex-tracts metadata from data sets and populate the CMRE data repository and data catalogue, and newly acquired obser-vations and data products become available to CMRE re-searchers in near real-time through the catalogue interface. The CMRE data management infrastructure adopts open standards for data interoperability and OGC services for geospatial data, enforcing compliance to NATO (Allied Ge-ographical Publications, STANAGS) and international stan-dards for spatial data (ISO 19100 family, ISO/TC 211).
The first version of the data management infrastructure was heavily tailored on the data formats and the best prac-tice adopted for data within CMRE. It integrated Python scripts, a web-based scheduler (Jenkins) and versioning
soft-ware (Git) to extract metadata from data sets and populate the data repository, which combined a file storage and a data server (GeoServer). The GeoServer was used to implement OGC WCS and WMS services, while CKAN and GeoNet-work were used to provide a user-friendly interface for data search.
This version of the data management infrastructure, lever-aging OGC services, worked well for observed data, but lim-ited services were in place to access model data. Because both observed and model data are required for model skill assessment, modellers were not using the existing infrastruc-ture for these activities. They stored NetCDF files on local hard drives and for visualisation and analysis, ran model-specific routines for each type of model, mainly written in MATLAB®. Moreover, exchange of data with other scien-tists was mainly done via FTP or via exchange of physical media. As a result, duplication of files and loss of data were frequent.
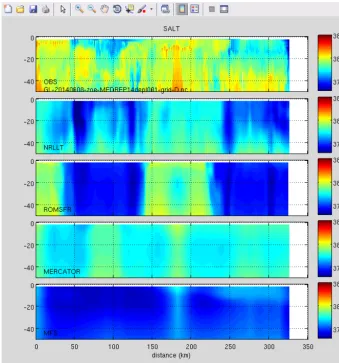
Figure 4. Vertical sections of salinity data from an ocean glider compared with virtual glider paths through four numerical models. Use of CF
conventions and NCTOOLBOX allowed the vertical coordinates from these four different models to be computed without any model-specific code.©North Atlantic Treaty Organization, all rights reserved. Provided by STO-CMRE.
approach. We installed a TDS and setup NcML for each of the collection of files that represented a REP14-MED model simulation. Although a different NcML file is required for each collection of files, NcML files for a particular type of model (e.g. ROMS), differ only in the specifics of the sim-ulation (e.g. title, abstract, principal investigator, etc.), mak-ing it possible to use an example NcML file as a template for other simulations. Knowledge on standard conventions is re-quired to create the initial NcML file, but then it can be hand off to modellers to copy, modify and use on their own. The same approach was used also for observations, in particular to enforce CF compliance for glider data.
In both cases, no modification of the original data was nec-essary, because the NcML transformations were applied on the fly when accessing the data through OPeNDAP. Since the original data generation workflow was not affected in any way, legacy software could continue to access the data us-ing the original formats. However, the integration in the data
management infrastructure of the OPeNDAP service empow-ered the scientists with a powerful alternative for accessing data, letting them free to access only the subset of data they really needed, avoiding to download huge files on they local hard drives. Moreover, to share the data it is now sufficient to share the URL pointing to the data set, avoiding unnecessary duplications and use of external media. This is a key advan-tage of the approach, in particular when, as in this case, such data are used as an input source of information by several users and services.
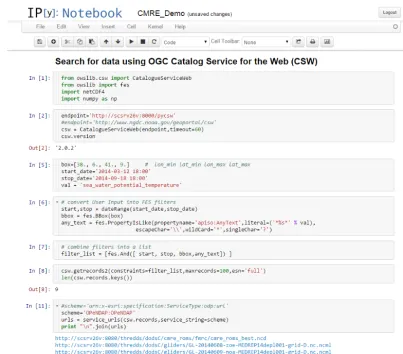
GeoNet-Figure 5. A snippet from an IPython Notebook demo, demonstrating a geospatial, temporal and free-text search for data using the owslib
package to construct CSW queries and parse the results. Nine records are found, and the OPeNDAP data endpoints are then selected, from which data can be extracted in a common way, since CF conventions are used.©North Atlantic Treaty Organization, all rights reserved. Provided by STO-CMRE.
work. Compared with the original approach used for meta-data extraction, ncISO metameta-data generated from TDS have the advantage to describe better some data set features, such as variable ranges. Other features, such as cruise informa-tion, can be customised through NcML and the Extensible Stylesheet Language schema which is used for configuring ncISO outputs.
With the data sets standardised via NcML, accessible via OPeNDAP, and ISO 19115 compliant metadata that can be published via pycsw, the last task needed was to de-velop a simple CSW search capability for MATLAB®users. Python users had the powerful OWSLib16 library, but noth-ing existed for MATLAB®. To meet this need, we developed a simple CSW search function for MATLAB® that takes a bounding box, temporal extent and a keyword on input, and retrieves all OPeNDAP data URL that match the criteria.
16https://geopython.github.io/OWSLib/
Figure 6. Another snippet from the IPython Notebook demo, extracting data from one of the discovered OPeNDAP URLs using the Iris
package.©North Atlantic Treaty Organization, all rights reserved. Provided by STO-CMRE.
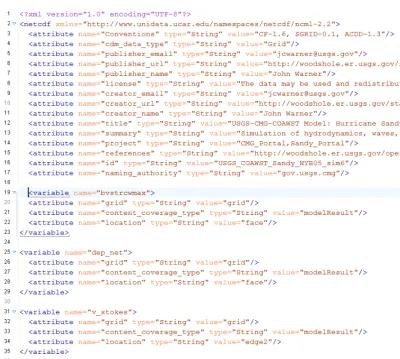
Figure 7. Example of a YAML file, created by the modeller and used to specify simulation-specific parameters. This YAML file is converted
Figure 8. A sample NcML file produced by the yaml2ncml.py Python script. Although these files can be created by hand using a text editor,
getting validated NcML has proven difficult for modeller, and the yaml2ncml pathway has been found to be less error prone. This NcML file not only specifies attributes but also contains a regular expression that specifies which NetCDF files should be part of this aggregated data set (not shown).
Although MATLAB®was the environment used by most modellers at CMRE, an IPython Notebook server was also installed17, so that CMRE researchers could explore standards-based access to the same data sets via Python. The IPython Notebook was particularly convenient because it uses a client–server model, with a standard web browser as client. This allowed researchers to test out Python browsing, access and visualisation using only a browser, and no instal-lation of software was necessary on the local machine (cf. Figs. 5 and 6).
The installation and configuration of the system took place while the first author was visiting CMRE under the Visit-ing Researcher Programme. The prototype was integrated in the production data management environment during another cruise in 2015. During that cruise, model data and glider ob-servations where ingested automatically in TDS, which
cur-17IPython Notebook http://ipython.org/notebook.html was also
installed.
rently integrates the data repository, by the continuous de-ployment service. The same service that uploads the data sets in TDS also takes care of generating customised NcML files and xsl descriptions for generating enriched ISO meta-data using the ncISO service. These metameta-data includes cus-tomised descriptions of data sets as defined by data produc-ers, but contain more precise information on the specific data sets as presented by TDS.
4.2 USGS Coastal and Marine Geology (CMG) Program Sediment Transport Group
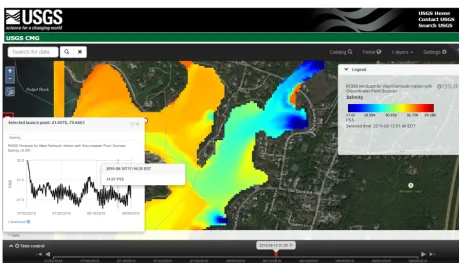
Figure 9. Viewing a USGS CMG data set in the CMG_Portal web application. The map is made by a dynamic request to the WMS service
provided by the THREDDS Data Server. The user has clicked a location on the map, which extracts a time series at that location using the WMS getFeatureInfo response.
Figure 10. Viewing a discovered USGS CMG data set in the Data.gov built-in Map Viewer application. The Map Viewer is requesting this
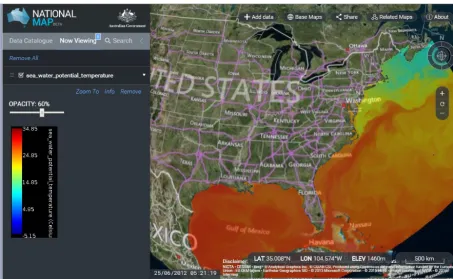
Figure 11. USGS CMG data set displayed on the Australian National Map application, which is build on the TerriaJS framework. This map
application is requesting the image from the WMS service provided by the THREDDS Data Server.
are performed as part of a sensitivity study, varying differ-ent forcing and configuration parameters to determine their importance. Each simulation typically produces a collection of NetCDF files that are not completely CF compliant.
As in the CMRE case, we used the TDS server configured with the datasetScan option, so that researchers could simply add NcML files that allowed the data to be accessed as stan-dardised, aggregated data sets. Although NcML files can be edited with a text editor starting from supplied templates, the cut-and-paste manual editing of NcML files is prone to er-ror, such as copying NcML from an existing simulation and not removing the attributes for a variable that was no longer being output. In addition, there is a lot of repetitive attribute information that needs to be added for each variable, which varies from simulation to simulation.
To solve this problem, we simplified the editing task by having modellers edit a simple YAML18input file which con-tained only simulation-specific information. Then we pro-vided researchers with a Python script that reads the YAML input file and produces a valid NcML file. The Python script was developed for the COAWST/ROMS models, but could easily be expanded to cover other model types. It is not spe-cific to USGS, and could be used to simplify the generation of NcML at CMRE or within any modelling group.
18http://www.yaml.org/about.html
Because modellers wanted selected model runs to be dis-played in the official USGS CMG portal, we provided a sim-ple mechanism where they specify CMG_Portal as a project attribute in the metadata. This information is automatically included in the ISO metadata, and becomes queryable via the CSW service. An example of the YAML input file and the resulting output NcML file are shown in Figs. 7 and 8. Thus the portal developer (a third-party external to the USGS) need only to query the CSW service for records where the project attribute matches CMG_Portal and then utilise the WMS viewer to enable preview of the data in the browser (Fig. 9). This means that the USGS modellers control which simulations appear in the portal without any involvement of the portal developers.
5 Discussion
The two use cases presented in the previous section proved valuable in several ways. By testing the approach with spe-cific workflows and data sets, we identified gaps and weak-nesses in the tested technologies, but also in the documen-tation, training and support material. All these factors are important for the successful implementation of these ap-proaches by the scientific community.
with common formats and conventions. The installation and configuration of the systems can be complex, supported by substantial IT infrastructure.
At smaller research institutions, researchers use individual workflows when producing model data and the models they use differ according to their research needs and experiences, resulting in variegate data formats and conventions. In addi-tion, IT infrastructure supporting research is often overex-tended. It is not surprising that for small research groups to adopt a new approach, the approach must be easy to in-stall, configure and maintain. It is also useful if the approach integrates into the workflows they already use: distributing data using files they already create, and searching for and accessing data in analysis systems they already use (e.g. MATLAB®, Python). It was clear from both use cases, how-ever, that documentation needs to be improved. Users both at CMRE and USGS requested more online documentation and instructional videos.
Both use cases demonstrate that there are many collateral benefits to the standardised approach, beyond improving the local delivery, access, search and preview. For smaller re-search groups, the automatic generation of ISO metadata and delivery via standard services may help them meet mandated data publication requirements. US Federal Data, for example, are supposed to be available via data.gov. ISO 19115 compli-ant metadata automatically generated from simulations and completed with standard web service endpoints can be har-vested directly into data.gov and instantly become discover-able and viewdiscover-able by the data.gov map viewer (Fig. 10).
Another benefit of the approach is that standardised data sets can be incorporated into an increasing number of appli-cations being developed around the world. The WMS ser-vices, for example, can be drag-and-dropped into applica-tions like the Australian National Map (Fig. 11), which lever-ages the open-source TerriaJS19library.
The standardised approach also has benefit to software de-velopers: when you solve a problem to address a need in a specific application, you solve it for the whole community. For example, the CSW support we needed for the CMRE MATLAB®users was added to NCTOOLBOX on GitHub, making CSW queries possible for any MATLAB®user. The development of a common syntax for CSW bounding box re-quests in MATLAB®helped not only MATLAB®users but all users of CSW, regardless of language.
Finally, a note on supporting tools in the environ-ments scientists use: although most oceanographers still use MATLAB®, Python is gaining in popularity, especially among younger researchers. Globally, Python is the fastest growing language over last 5 years20 and is now the top teaching language at universities21. We therefore developed
19https://github.com/TerriaJS/terriajs 20http://pypl.GitHub.io/PYPL.html 21http://www.pcworld.com/article/2451880/
python-bumps-off-java-as-top-learning-language.html
tools in both MATLAB® and Python, so that users could query CSW or access data from OPeNDAP data with CF conventions effectively without needing to learn a new lan-guage. We believe this is critical for the adoption of the ap-proach by scientists. This should be extended in the future to R22, another popular environment used in data science, and for future languages as they become popular in the commu-nity.
6 Conclusions
We have developed an approach using procedures and soft-ware tools that make it easy for small research groups to transform their heterogeneous collections of non-standard files into a standardised web services framework that allows interoperable data delivery, search, preview and access.
This framework enables researchers to spend less time on data manipulation tasks, which allows more time for science. Users are able to query for data sets in MATLAB®or Python, extract just the data they need from the discovered endpoints and analyse the extracted data without model-specific code. This greatly facilitates model–model and model–data com-parison. Because services are used to extract data, users can execute their analysis and visualisation workflows not only on their computers in the office but using their laptop in a hotel room, or anywhere. This also means workflows shared with colleagues will work without modification. Although reading data with services is slower than reading data from a disk, obtaining just the data you need via a service is faster than downloading an entire data set and then reading the file locally. If data obtained via services needs to be read repeat-edly, it can be saved to local disk for faster subsequent access. The framework also allows data to be selectively dis-tributed to the public, assists data publication requirements, allows data to be explored with a variety of new tools and also to be connected to larger systems of standards-based data, such as IOOS, data.gov and GEOSS.
The use cases were particularly useful for gathering feed-back on how the approach could be improved, but also for introducing a larger section of the community to a standards-based approach. At CMRE, it is hoped that the rotational sci-entists will further spread the approach when they return to their home countries.
Although the use cases here involved meteorological and oceanographic model data, the framework could be applied to any structured grid model data (e.g. surface and ground water modelling). Work is currently underway to extend this framework to work seamlessly with unstructured (e.g. triangle-based) grids and staggered grids (cf. the sci-wms project23).
Acknowledgements. The authors acknowledge CMRE for the
use of data collected during the REP14-MED trial described in Sect. 4.1. Thanks to John Caron and the Unidata Program Center for their development of the THREDDS Data Server, and to Tom Kralidis of the Meteorological Service of Canada for leading the development of the pycsw and OWSLib Python packages. Any use of trade, firm, or product names is for descriptive purposes only and does not imply endorsement by the United States Government. Edited by: S. Carniel
References
Bergamasco, A., Benetazzo, A., Carniel, S., Falcieri, F. M., Min-uzzo, T., Signell, R. P., and Sclavo, M.: Knowledge discovery in large model datasets in the marine environment: the THREDDS Data Server example, Advances in Oceanography and Limnol-ogy, 3, 41–50, doi:10.1080/19475721.2012.669637, 2012. Bernholdt, D., Bharathi, S., Brown, D., Chanchio, K., Chen, M.,
Chervenak, A., Cinquini, L., Drach, B., Foster, I., Fox, P., Garcia, J., Kesselman, C., Markel, R., Middleton, D., Nefe-dova, V., Pouchard, L., Shoshani, A., Sim, A., Strand, G., and Williams, D.: The Earth System Grid: supporting the next gen-eration of climate modeling research, P. IEEE, 93, 485–495, doi:10.1109/JPROC.2004.842745, 2005.
Blower, J. D., Haines, K., Santokhee, A., and Liu, C. L.: GODIVA2: Interactive visualization of environmental data on the Web, Phi-los. T. R. Soc. A, 367, 1035–1039, doi:10.1098/rsta.2008.0180, 2009.
Blower, J. D., Gemmell, A. L., Griffiths, G. H., Haines, K., Santokhee, A., and Yang, X.: A Web Map Service imple-mentation for the visualization of multidimensional gridded environmental data, Environ. Modell. Softw., 47, 218–224, doi:10.1016/j.envsoft.2013.04.002, 2013.
de La Beaujardière, J., Beegle-Krause, C., Bermudez, L., Han-kin, S., Hazard, L., Howlett, E., Le, S., Proctor, R., Signell, R., Snowden, D., and Thomas, J.: Ocean and Coastal Data Management, Proceedings of OceanObs’09: Sustained Ocean Observations and Information for Society (Vol. 2), Venice, Italy, 21–25 September 2009, edited by: Hall, J., Harri-son, D. E. and Stammer, D., ESA Publication WPP-306, doi:10.5270/OceanObs09.cwp.22, 2009.
Howlett, E., Snowden, D. P., Signell, R. P., Knee, K. R., and Wil-son, D.: Data management update for the Integrated Ocean Ob-serving System (IOOS®), Oceans – St. John’s 14–19 September 2014, 1–10, doi:10.1109/OCEANS.2014.7003284, 2014. Signell, R.: Model data interoperability for the United States
Inte-grated Ocean Observing System (IOOS), Estuarine and Coastal Modeling, 221–238, doi:10.1061/41121(388)14, 2010.