DGA Interpretation for Increasing the Percent
of Accuracy by Bayesian Network Method
Comparing IEC TC 10 Database
Shalaka Bhimrao Wanjare#1, P. S. Swami #2, Dr.A.G.Thosar#3
#1
M.E. Electrical Power System, Government College of Engineering, Aurangabad, India.
#2
Assistant Professor, Electrical Department, Government College of Engineering, Aurangabad, India.
#3
Professor, Electrical Department, College of Engineering, Pune, India.
Abstract
Dissolved gas analysis (DGA) is a method of estimating the presence of dissolved gases in oil of transformer. The health of transformer majorly depends on the state of transformer oil. The percentage of gases dissolve in oil may lead to different faults on transformer. Various methods are used to analyse the faults in transformer like Rogers Ratio Method (RRM), Doernenburgs Ratio Method (DRM), Duval Triangle Method (DTM), Duval Pentagon Method (DPM), and IEC Ratio Method (IRM). Various gases are evolved in transformer. The amount of dissolve gases liberated in transformer oil produces different faults. In transformer oil, usually the gases which are evolved are hydrogen (H), methane (CH4), ethylene (C2H6), acetylene (C2H2),
carbon monoxide (CO), carbon dioxide (CO2),
nitrogen (N2) and oxygen (O2). This paper proposes
DGA interpretation for increasing the per cent of accuracy by Bayesian network.
Keywords — Dissolved Gas Analysis (DGA), transformer fault prediction, graphical user interface (GUI).
I. INTRODUCTION
The main part of power system is power transformer. There are various aspects in power transformer taken into account to maintain the health of power transformer [1]. There are various fault occur in transformer which depends on various factors. One of the main reasons of it is gases formation in the transformer oil [3]. Various factors are responsible for the gaseous breakdown in transformer oil. The transformer oil is inspected and supervises to detect and maintain the proper condition of power transformer. The manufacturing cost of power transformer is very high so the reinvestment in it so is not possible therefore to maintain the good health or proper condition is important.
The reasons for occurring of faults in transformers are of two types’ external fault and internal fault.
• External faults are occurring due to following reasons; External short circuit in power transformer, high voltage disturbance power transformer, power frequency over voltage.
• Internal faults in power transformer as follow; insulation breakdown among winding and earth, insulation breakdown in between different phases, insulation breakdown in between adjacent turns, transformer core fault.
• Internal earth fault in power transformer as follow: internal earth faults in a star connected winding with neutral point earthed through impedance.
The decomposition of gases occurs in oil tank of transformer responsible for the number of fault occurs in it. The gases from oil are removing by different method like
a) Partial degassing (single-cycle vacuum extraction)
b) Total degassing (multi-cycle vacuum extraction)
c) Stripping by flushing the oil with another gas
d) By the headspace technique.
Dissolved gas analysis (DGA) is technique used to recognize the fault in transformer. The normally fault is generated due to corona or partial discharge, thermal heating, arcing. For the dissimilar temperature level the different gasses are produces.
II. SUPERVISION OFOILCONDITION
The power transformer is filled with oil. The main purpose of oil is to maintain the temperature as cool as possible and other important reason is to give insulation to the transformer windings. The oil which present in transformer tank is come in contact with the internal part of transformer. In many situation come in transformers where due to some abnormal condition the various gases are evolved within oil tank. By calculating the amount, properties of gases the fault in the transformer is categories. There are many reasons for production of gases and their breakdown. The supervision of transformer oil is takes place by various tests. The tests or maintenance work is taken place in daily, weekly, monthly according to the fault generation. The DGA took place by four steps.
c) Analysis of the extracted gas mixture by gas Chromatograph, gas chromatography.
d) Interpretation of the analysis.
By following above steps the oil in transformer tank is supervise and amount of gases produce in it are detected.
List of gases produce in transformer oil tank- • Hydrogen-H2
• Methane-CH4
• Ethylene-C2H4
• Ethane-C2H6
• Acetylene-C2H2
• Propene-C3H6
• Propane-C3H8
• Carbon monoxide-CO • Carbon dioxide-CO2
• Oxygen-O2
• Nitrogen-N2
1. TABLE
FAULTS DETECTABLE BY DGA
Sr. no. Symbol Fault
1 PD Partial Discharges
2 D1 Discharges of low
energy
3 D2 Discharge of high
energy
4 T1 Thermal fault,
Temp<3000C
5 T2 Thermal
fault,300<Temp<7000C
6 T3 Thermal fault,
Temp>7000C
2. TABLE
GUIDELINES AND STANDARD FOR DGA
Standard Description
IEEE Std
.C57.104.2008
IEEE Guide for the analyzing of gases evolved in transformer IEEE
Std.C57.12.80-2002
Terminology for power and distribution transformer
IEEE 60599-2007-05 Mineral oil infused electrical equipment in service
IEC 60599-2007-05 reference to Duval Triangle
III.PROPERTIES OFOIL
The oil gets polluted with water and some foreign particles. The other aspect is the continuous ageing of the oil. Apart from these protecting properties these oxidation products also cause accelerated deprivation of the cellulose insulation. The number of tests is carried out to detect the properties of oil as below.
1 Electrical properties
1.1 Breakdown voltage (IEC 60156)
The ability of the oil to resist electrical stress is very imperative. The low breakdown voltage is due to contamination of oil.
1.2 Dielectric dissipation factor (IEC 60247) This property gives the idea about dielectric losses in the oil. It gives the indication about metal ions and acids.
2 Chemical properties 2.1 Water content (IEC 60814)
The reason of moisture evolution is aging of oil. The leakage of water also occurs in transformer tank. Due to high water presence the lower breakdown voltage occurs. The proportion of aging of insulation paper is due to high water content.
2.2 Acidity (IEC 62021)
Acids are form due to oxidation in oil. The potassium hydroxide is use to neutralize the acids.
2.3 Inhibitor content (IEC 60666)
To slow down the oxidation of oil inhibitors are added. It does not allow chain reaction in the oxidation. Due to inhibitor the oil normally age very slowly. The oxidation takes place very rapidly due to lack of inhibitor. So the monitoring of inhabitation content is very important.
3 Physical properties 3.1 color (ASTM D1500)
Color is not that much important property. But it gives the idea about the aging of oil. And also for chemical analysis it is very important.
3.2 Interfacial tension (IFT ASTM D 971-99) The amount of polar pollutants and dilapidation products accounts to interfacial tension between oil and water. It is important to indicate aging and it is also predisposed by non-acidic oxidation products.
3.3 Corrosive sulphur (IEC 62535)
Due to copper sulphide in the cellulosic insulation many problems arrived in equipment. Other problems are arriving due to corrosive sulphur components in oil. Apart from ASTM D1275 or DIN 51353 new tests developed which have higher sensitivity for detecting mechanical failure.
IV.DGASTANDARDDIAGNOSISMETHODS A. Duval Triangle Method (DTM)
In the Duval Triangle one technique fault diagnosis is done by two ways, the classical way is by using three gases such as CH4, C2H4 and C2H2 they are form
by difference in energy. The Duval triangle 4 methods use H2, CH4 and C2H6 gases to diagnose
faults of low energy or temperature. Duval triangle 4 catalogue first with Duval triangle 1 faults like PD, T1, and T2. It never detects electrical faults like D1 or D2. Duval triangle 4 is commonly discriminate between stray gassing of oil, overheating at below 2500c, possible carbonization of paper at above 3000C, corona partial discharge. Duval triangle 5 uses gases CH4, C2H4 and C2H6 for fault detection of high
B. Duval Pentagon method (DPT)
In this method five main hydrocarbons gases ratio use to identify faults. The hydrocarbon gases are H2,
CH4, C2H6, C2H4 and C2H2. In this method five gas
ratios in a pentagon representation the faults forming in oil filled equipment’s.
C. IEC Ratio method (IRM)
IEC ratio method used advance technique to identify different faults. The faults are classified in seven types partial discharge (PD), low energy discharge (D1), high energy discharge (D2), thermal faults (T1), thermal fault (T2), thermal faults (T3). In this method state assessing uses restrictions for various gases and three dissimilar gas ratios is evaluated.
3. TABLE
GUIDELINES AND STANDARD FOR DGA
Gas Limit (external OLTC)
Limit (Internal OLTC)
H2 60-150 75-150
CH4 40-110 35-130
C2H2 3-50 80-270
C2H4 60-280 110-250
C2H6 50-90 50-70
CO 540-900 400-850
CO2 5100-13000 5300-12000
D. Doernenburg Ratio method (DRM)
In Doernenburg Ratio method four different gases are used to evaluate three different faults. This method has limitations for each gas which is described as below table. If the gas limit increase beyond the limitation the ratio will be change which has different value when fault is diagnose.
4. TABLE
DOERNENBURG RATIO LIMITS
Fault diagnosis CH4/
H2
C2H2/
C2H4
C2H2/
CH4
C2H6/
C2H2
Thermal Decomposition
>1.0 <0.75 <0.3 >0.4
Corona <0.1 - <0.3 >0.4
Arcing
0.1-1.0
>0.75 >0.3 <0.4
E. Key gas method
In key gas method identification of key gases is done. And fault is diagnoses which are recommended by IEEE C57.104 [3]. The quantity of gas is calculated in standings as total inflammable gases. The drawback of this technique is that the analysis by the definite gases is tough in preparation since each embryonic fault produce dashes of other gases in accumulation to the key gas of such fault.
F. Rogers Ratio method (RRM)
Rogers ration method evaluates six types of fault conditions. In this method takes ratio of three gases
5. TABLE ROGER’S RATION LIMITS
Case Fault diagnosis
C2H2/C2
H4
CH4/
H2
C2H4/C
2H6
0 Unit
Normal
<0.1 0.1-1.0 <1.0
1 Low
Energy density arcing
<0.1 <0.1 <1.0
2 High
Energy Discharge Arcing
0.1-3.0 0.1-1.0 >3.0
3 Low
Temperatur e
<0.1 0.1-1.0 1.0-3.0
4 thermal
faults
<7000C
<0.1 >1.0 1.0-3.0
5 Thermal
faults
>7000C
<0.1 >1.0 >3.0
V. BAYESIANNETWORK
Bayesian networks usage stochastic graphical representations to explain reliance between arbitrary variables [7]. They are represented as graphs which are known as directed acyclic graphs (DAG).The structure of BN model is interpretable as every stage will be calculated as the fault condition or any abnormality which occur in the power transformer. In the BN model nodes are formed which depends on the parent nodes. There are various rules which have to satisfy for the evaluation of the form nodes. Bayes’ theory states that the subsequent probability can be predictable by multiplying the opportunity and the previous probability and standardizing with the probability of evidence. Thus the evidence based software has delivered guidelines for leading systematic procedure for operation.
The Bayesian network methods offer an accepted statistical framework to substantiation based decision making by integrating a unified summary of the existing evidence and linked hesitantly through the valuation of utilities.
In BN model variables are represented as nodes. In specific given model structure we calculate the joint probability circulation both qualitative and quantitative characteristics need to be contemplate when constructing a BN. The quantitative phase on the other side deals with approximating the limitations such as particle prior and obstructive probability tables in unconditional cases, the computational of a chance of interest is termed interference.
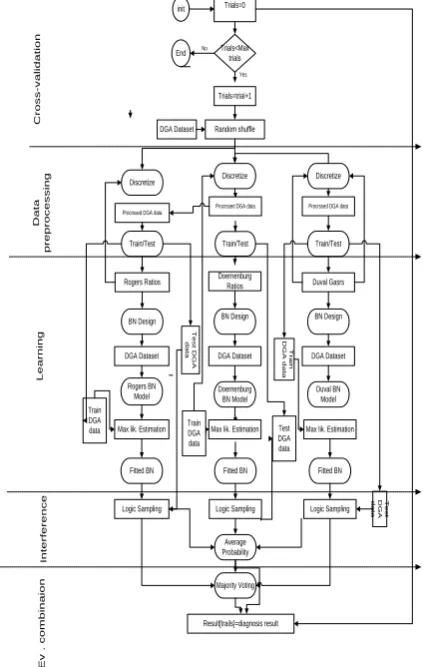
1. Cross-validation: in the cross-validation stage the validation and assess are simplify to an independent dataset. It start with the trail counter 0 which followed by randomly shuffled the available data and feed the data for the next stage. but it the trials are less than the maximum trials than increase the trial counter by 1. Otherwise particular mean and standard deviations of the store diagnosis result.
2. Data pre-processing: the actual gas contains values are taken which are different for different gases. And the data is reshuffled and pass for the next process.
3. Parameter learning and interference through BN: in this stage the presses data is individually by each method. Every case is examined by three methods and classification ratio is calculated by each method and final decision is made about fault generation of each method. After this BN theory is applied next stage is implementation of the parameter learning. According to IEEE standard the decision is made. The fault with the maximum probability is the final judgment of the model.
4. Evidence Combination: by above data decision is made with the maximum confidence in is accuracy, But sometimes conflicts are form due to difference in decision. With the help of BN model the conflicts are resolve by taking maximum probability answer as a final result with increase accuracy.
Trials=0 init Trials<Max trials Discretize Discretize Train/Test Train/Test
BN Design BN Design BN Design
Rogers BN
Model Duval BN Model
Doernenburg BN Model
Fitted BN Fitted BN Fitted BN
Average Probability Majority Voting Result[trails]=diagnosis result End Train DGA data T e s t D G A d a ta DGA Dataset T e s t D G A d a ta T r a in D G A d a ta No Yes Trials=trial+1 Random shuffle
Procrssed DGA data Procrssed DGA data
Rogers Ratios Doernenburg Ratios Duval Gasrs
DGA Dataset DGA Dataset DGA Dataset
Max lik. Estimation Max lik. Estimation Max lik. Estimation
Logic Sampling Logic Sampling Logic Sampling Discretize
Train/Test Procrssed DGA data
Train DGA data Test DGA data C r o s s -v a li d a ti o n D a ta p r e p r o c e s s in g L e a r n in g In te r fe r e n c e E v . c o m b in a io n
Fig 1: Bayesian network framework
6. TABLE
FAULT CODES REPRESENTATION IN GUI
Representation Fault Type
N Normal Operation
T1 Thermal Fault t<3000C
T2 Thermal Fault
3000C<t<7000C
T3 Thermal Fault t>7000C
PD Partial Discharge
D1 Arching(low intensity)
D2 Arching(high intensity)
UN Unpredictable
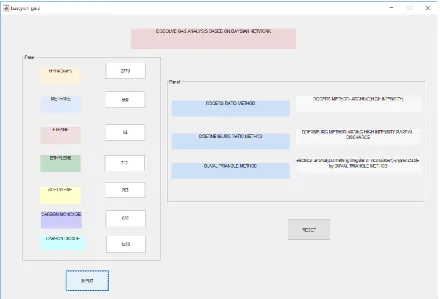
Fig 2.Fault codes representing in GUI
VI.RESULT
In this paper a graphical user interference (GUI) based on MATLAB is developed to get the proper fault analysis of the transformer. In GUI point and click based application software is developed. In GUI there is no need of learning any command or program to run the application. In below figure screen shot of transformer fault analysis using GUI in MATLAB is shown.
Many data input such as specification of transformer gases (hydrogen, acetylene, ethylene, methane, ethane, carbon dioxide, carbon monoxide) are form during various abnormal condition. The data is feed and analysis of fault condition at
Fig 2: Output of GUI Window
7. TABLE
CALCULATION OF RESULTS BY USING DGA DATA [13]
Sr No .
Hydrog en
Methan e
Ethane Ethylene Acetylene Carbon Monoxide
Carbon Dioxide
RRM DRM DTM IEC Result
Pr edi cti on
1 37800 1740 249 8 8 56 197 PD PD PD PD PD
2 305 100 33 161 541 440 3700 D1 D1 D1 D1 D1
3 440 89 19 304 751 299 1190 D1 D1 D1 D1 D1
4 1270 3450 520 1390 8 483 44500 T1 T3 T3 T3 T3
5 8800 64064 72128 95690 0 290 90300 T1 T3 T3 T3 T.3
6 9340 995 60 6 7 60 620 PD UN PD PD PD
7 543 120 41 411 1880 76 2800 D1 D1 D1 D1 D1
8 2850 89 19 304 757 299 1190 D1 D1 UN D1 D1
9 360 610 1500 6990 33 573 4640 T1 T3 T3 T3 T3
10 1100 1600 221 2010 26 0 1430 T1 T3 T3 T3 T3
11 36036 4704 554 5 10 6 347 PD UN PD PD PD
12 645 86 13 110 317 74 114 D1 D1 D1 D1 D1
13 13500 6110 212 4510 4040 8690 1460 D1 UN D1 D1 D1
14 960 4000 1290 1560 6 15800 50300 T1 T3 T3 T3 T3
15 40280 1069 1060 1 1 1 0 PD PD PD PD PD
16 6870 1028 79 900 5500 29 388 D1 D1 D1 D1 D1
17 3090 5020 323 3800 2540 270 400 T1 UN D1 D1 D1
18 480 1075 298 1132 0 454 1000 T1 T3 T3 T3 T3
19 860 1670 30 2050 40 10 690 T1 T3 T3 T3 T3
20 26788 18342 2111 27 0 704 0 N UN PD PD PD
21 120 25 1 8 40 500 1600 D1 N D1 D1 D1
22 535 160 16 305 680 172 338 D1 D1 UN D1 D1
23 4000 400 70 600 6 800 218 UN PD T3 T3 T3
24 1550 2740 816 5650 184 1140 9360 T1 T3 T3 T3 T3
8. TABLE
COMPARISON OF DGAMETHODS
Methods Right prediction
(cases25)
wrong prediction
(cases25)
unpre dictabl
e decisio
n (cases
25)
Roger’s Ratio Method
13 11 1
Duval’s Triangle Method
18 5 2
Doerneb urg’s Ratio Method
22 1 2
VII. CONCLUSION
In this paper numerous fault in the transformer are analysis, which gives the idea about the health condition of power transformer. The work in the graphical user interface (GUI) in MATLAB is mainly focus on the calculating the exact occurring fault at the point of time. MATLAB graphical user interface (GUI) based program relate the results obtained mathematically and using the program and analysis the result as per the standard
.
DGA is a method that concentrates on the amount of dissolved gases at that period of time. Classical methods like RRM, DRM, and DTM are used here for the design making of fault produce at the different concentration of gases. This method is proposed so as to improve the precent of accuracy. So that the diagnostic result of proposed model is a deterministic probability value and relate it with the obtain data. This may overcome the conflicts about the decision of the fault by individual methods, due to this Bayesian method the decision is made by maximum probability.
The result obtained in this paper can be used as comparison by IEC TC 10 dataset [13].according to this the fault can be classified as partial discharge (PD), normal operation (N), thermal fault (T1, T2, T3), arching (D1, D2) etc. according to this BN model method the accuracy can be achieved up to 88.9%.
REFERENCES
[1] Shalaka Bhimrao Wanjare, “DGA interpretation for increasing the percent of accuracy by different methods: A Review,28 March 2018.
[2] Barin G. Steward, Jose Ignacio Aizpurua, Stephen D. J. McArthur, and Victoria M. Catterson, “ Improving the Accuracy of Transformer DGA Diagnosis in the Presence of Conflicting Evidence,” Electrical insulation conference (EIC), Baltimore, MD,USA.
[3] M. Duval, "A review of faults detectable by gas-in-oil analysis in transformers," IEEE Electr. Insul. Mag., vol. 18, pp. 8-17, 2002.
[4] R. R. Rogers, "IEEE and IEC Codes to interpret incipient faults in transformers, using gas in oil analysis," IEEE Trans. Dielectr. Electric Insul. Vol. EI-13, pp. 349-354, 1978.
[5] "IEEE Guide for the Interpretation of Gases Generated in Oil-Immersed Transformers," IEEE Std C57.104-2008, pp. 1-36, 2009.
[6] K. Spurgeon, W. H. Tang, Q. H. Wu and G. Moss, "Dissolved gas analysis using evidential reasoning," IEE Proceedings - Science, Measurement and Technology, vol. 152, pp. 110-117, 2005.
[7] M. Duval "Interpretation of gas-in-oil analysis using new IEC publication 60599 and IEC TC 10 databases," IEEE Electr. Insul. Mag., vol. 17, pp. 31-41, 2001
[8] H.-C. Sun and C.-M. Huang, "A Review of Dissolved Gas Analysis in Power Transformers," Energy Procedia, vol. 14, pp. 12201225, 2012
[9] A. Abu-Siada and S. Islam, "A new approach to identify power transformer criticality and asset management decision based on dissolved gas-in-oil analysis," Dielectrics and Electrical Insulation, IEEE Transactions on, vol. 19, pp. 1007-1012, 2012.
[10] M. Duval and J. Dukarm, "Improving the reliability of transformer gasin-oil diagnosis," Electrical Insulation Magazine, IEEE, vol. 21, pp. 2127, 2005.
[11] S. Corporation, "Serveron White Paper : DGA Diagnostic Methods," 2007.
[12] M. Duval, "New techniques for dissolved gas-in-oil analysis," Electrical Insulation Magazine, IEEE, vol. 19, pp. 6-15, 2003.