Published online February 20, 2014 (http://www.sciencepublishinggroup.com/j/ijnfs) doi: 10.11648/j.ijnfs.20140302.15
Assessment of mineral deficiencies among grazing areas
in Uasin Gishu County, Kenya
Shisia K. Silvanus
1, *, Ngure Veronica
2, Nyambaka Hudson
3, Jumba Isaac
4, Oduor Fredrick
41
Department of Chemistry, Laikipia University, Kenya 2
Department of Biological Sciences, Laikipia University, Kenya 3
Department of Chemistry, Kenyatta University, Kenya 4
Department of Chemistry, University of Nairobi, Kenya
Email address:
shisia2003@yahoo.com (S. K. Silvanus)
To cite this article:
Shisia K. Silvanus, Ngure Veronica., Nyambaka Hudson., Jumba Isaac., Oduor Fredrick. Assessment of Mineral Deficiencies among Grazing Areas in Uasin Gishu County, Kenya.International Journal of Nutrition and Food Sciences. Vol. 3, No. 2, 2014, pp. 44-48. doi: 10.11648/j.ijnfs.20140302.15
Abstract:
A study conducted in the major grazing areas of Uasin Gishu involved twenty-eight (28) soils, twenty-eight (28) forage and forty-two (42) serum samples collected in six divisions at different sites. The purpose of the study was to determine the macro-and trace elements in soils, forages and animal serum, and compare to the recommended standards so as to identify those that could be presenting deficiencies in the area. Soils were extracted for available macro-minerals; Sodium (Na), Potassium (K), Calcium (Ca) magnesium (Mg) and trace elements; Iron (Fe), Manganese (Mn), Copper (Cu) and Zinc (Zn; the forage samples were assayed for the same elements plus phosphorus as total concentration on dry matter (DM) basis while blood serum was analyzed for the same forage elements plus molybdenum (Mo). Atomic absorption spectrophotometer (AAS) and UV/visible spectrophotometer were used to analyze the metal elements and molybdenum respectively. Soil and Forage analysis of samples from southern region including Kesses and Ainabkoi revealed lower levels in both macro and trace elements analyzed. Serum samples from grazing areas situated in southern region revealed similar deficiencies in most minerals. The factors responsible for the variations as soil pH, forage species and cattle breed were investigated using correlation analysis.Keywords:
Grazing Areas, Assessment, Sample Analysis, Mineral Deficiencies, Uasin Gishu County1. Introduction
The nutrition of grazing animals is a complicated interaction of soils, plants, and animals [1, 2]. Cattle sometimes deteriorate in spite of an abundant feed supply because mineral requirements depend on the level of productivity [3]. Many factors affect mineral requirements, including nature and level of production, age, level and chemical form of elements, interrelationship with other nutrients, mineral intake, breed and animal adaptation [2, 3]. Mineral deficiencies in soils and pastures may be responsible for low production and reproductive problems among grazing animals in the tropics. Plants grown on tropical soils have been shown to be highly deficient in a number of major and trace minerals needed by grazing animals [3, 4]. Mineral deficiencies in grazing animals are associated with specific regions and are directly related to soil characteristics. The trend toward complete confinement
and absence of pastures for grazing cattle has greatly increased the incidence of mineral and other nutrient deficiencies [3, 4. 5]. Mineral nutrition disorders range from severe mineral deficiencies or toxicities characterized by well-marked clinical signs and obvious signs of disease to mild and temporary conditions difficult to diagnose and expressed as a vague ill health or unsatisfactory growth and production [5, 6]. Clinical signs of mineral deficiencies, pathological and biochemical examinations, along with mineral analyses of soil, water, plant and animal tissues and fluids have all been used, with varying degrees of success to establish mineral deficiencies and excesses, but the most reliable method of confirming mineral deficiencies is in the response from specific mineral supplementation [7, 8].
but none could be singularly relied upon; that no comprehensive study of mineral imbalance had been made in Uasin Gishu County, Kenya. Under pasture systems, animals depend on forages to satisfy all of their nutritional requirements but unfortunately, forages often do not provide all of the needed minerals, which animals require throughout the year. Many incidences of mineral inadequacies in forages and soils have been reported, which are principal causes of reproductive failure and low production rates [8, 9, 10]. Mineral deficiencies likely to affect production of grazing livestock on pastures in most of the world regions include those of the major elements Ca, P, Mg, Na, S, and the trace elements Co, Cu, I, Mn, Se, and Zn [11, 12].
There is scanty information on the mineral nutritive potential of forages in different tropical regions of the world including those of the county of Uasin Gishu, Kenya. The forages from these areas are important components of feed for livestock during the critical dry seasons.
Furthermore, very little has been done to establish levels of minerals of these feed resources. This study deals with the extent of the minerals in forages available and their potential in meeting the animal needs and maintaining their health status in the next decades in the Uasin Gishu County, Kenya. Knowledge on mineral composition of forages would form base-line data on mineral status of available feed resources for enhanced nutrition of grazing ruminants in these areas. The purpose of this investigation is to use soil and plant analyses as indicators of likely mineral deficiencies of grazing livestock during different seasons in Uasin Gishu County, Kenya.
2. Materials and Methods
Sampling was done in six major farms 1-6 in three different regions of the County. The central region around Eldoret had farms 1, 3 and 5, the northern region had farms 4 and 6 while the southern region had farm 2 (Fig 1).
Figure 1. Sampling sites in Uasin Gishu County, Kenya
The actual locations and altitude of the sampled sites was obtained using Global Mapping System (GPS) Model Magellan Map 410. Forage samples were cut at grazing stage from several points within sampling sites and thoroughly sub-sampled according to species [13, 14]. Soils were sampled by auger at 5 random positions within the 4x4 metre square sampling sites by the quartering procedure [15]. Blood from each animal was collected in clean vials using 15 Gauge “California” bleeding needles by puncture of the jugular vein. The blood was transferred to heparinised vials to ensure clot-free preservation [16]. Blood samples from each farm were classified on the basis of breed (Fresian, Ayshire or Fresian/Ayshire). A Chem Tech computerized Analytical AAS fitted with a monitor (CTA 2000 Model) was used with an appropriate air/acetylene flame burner. Colorimetric determinations were performed on a Pye Unicam spectrophotometer model SP150 using 10mm path length quartz cells with a
background correction system. Measurements of pH were done using Pye Unicam 292 MK2 Model pH meter with glass electrodes. Sample solutions, calibrating standards and blanks were diluted further to give a suitable working concentration range of 0-10 mg/l for Na and K and 0-5 mg/l for Ca, Mg, Fe, Mn, Cu and Zn. Dilutions for soil extracts were made using the appropriate extracting solution while that of forage digests were made with 1M HCl. The metals were determined by AAS using an air/acetylene flame and manufacture’s recommended instrumental settings. For Ca and Mg analysis, standards and samples were enriched with La3+ at a concentration of 0.31 % eliminate phosphate interference during analysis [16]. To 5 ml of working standard and unknown extract
containing up to 0.2 mg P, 0.5 ml of 60% HClO4 was added
followed by 1 ml stock vanado-molybdate reagent (50:50
mixture of 0.25% ammonium metavanadate in 33% HNO3
Molybdenum in serum was determined spectrophotometrically [17, 18]. The data were analyzed by Analysis of Variance using a split-plot design [19]. For those variables, which were significant (p≤0.05), the means were separated using Fisher’s Least Significant Difference test (LSD).
3. Results and Discussion
The central region had lower levels in mineral Na (88.00), Ca (667.00), Mg (330.00) mg/kg DM (Table 1.1). These concentrations however were above recommended levels [1].
Table 1.1. The mean concentrations and range of macro elements in soils (mg/kg DM)
Parameter Mean ±SD (n=28)
Range (n=28)
Central ±SD (n=16)
North ±SD (n=8)
South±SD (n=4)
Na 101.00±32.00 58.13-155.00 88.00±22.30 109.00±36.52 135.00±27.39
K 709.00±24.40 189.10-1135.00 709.00±20.77 756.00±38.68 614.00±181.04
Ca 720.00±33.30 280.00-1840.00 667.00±40.83 805.00±105.07 765.00±148.85
Mg 330.00±11.90 161.30-627.70 317.00±90.84 332.00±94.11 381.00±104.26
The southern region recorded lower levels in Fe (412.00), Mn (525.00) and Zn (4.10) mg/kg DM (Table 1.2). 14% and 4% of soil samples were lower in Cu and Zn although
the three regions had mean trace element concentrations also above recommended levels of 2.0 [20].
Table 1.2. The mean concentrations and range of trace elements in soils (mg/kg DM)
Parameter Mean ±SD (n=28)
Range (n=28)
Central ±SD (n=16)
North ±SD (n=8)
South±SD (n=4)
Fe 551.00±22.80 228.30-1198.30 598.00±115.46 526.00±103.80 412.00±107.29
Mn 630.00±3450 239.70-1583.50 703.00±180.37 536.00±139.27 525.00±109.65
Cu 3.30±0.90 1.60-5.13 3.00±0.89 3.80±O.67 3.5±1.50
Zn 6.70±0.40 1.97-22.06 8.00±3.52 5.50±2.43 4.10±1.90
Forages recorded lower levels in southern region mainly in K (10.50), Mg (1.18) and P (4.23) g/kg DM (Table 1.3).
Generally forages had no deficiencies in any of the macro elements analyzed.
Table 1.3. The mean concentrations and range of macro elements in forages (g/kg DM)
Parameter Mean ±SD (n=28)
Range (n=28)
Central ±SD (n=16)
North ±SD (n=8)
South±SD (n=4)
Na 1.00±0.30 0.55-2.12 0.92±0.17 0.94±0.22 1.47±0.60
K 11.80±5.00 3.73-20.53 11.08±5.50 14.00±4.34 10.50±3.60
Ca 0.57±0.19 0.15-1.17 0.56±0.19 0.54±0.08 0.72±0.29
Mg 1.35±0.72 0.10-3.13 1.36±0.50 1.42±0.81 1.18±0.90
P 6.34±3.22 1.83-14.41 6.69±3.02 6.69±2.07 4.23±1.51
Central regions recorded lower levels in Fe (50.00) and Cu (4.95) while Northern region recorded lower levels of Mn (85.5) and Zn (17.20) (Table 1.4). Forages however
recorded deficiencies in Cu and Zn with 14% and 4% deficiencies respectively [21].
Table 1.4. The mean concentrations and ranges of trace elements in forages (mg/kg DM)
Parameter Mean ±SD (n=28)
Range (n=28)
Central ±SD (n=16)
North ±SD (n=8)
South±SD (n=4)
Fe 56.00±0.53 10.25-231.00 50.00±10.36 57.16±26.60 80.56±20.59
Mn 105.00±0.58 38.25-246.50 119.00±30.65 85.59±21.07 89.63±30.80
Cu 5.32±2.84 2.00-15.50 4.95±1.09 5.56±2.06 6.31±2.15
Zn 19.50±8.26 8.30-39.78 20.12±7.59 17.20±6.70 21.65±10.01
Serum analysis revealed lower levels of all macro elements in grazing cattle from northern region (Table 1.5). Lower levels of trace elements were discovered in central
Table 1.5. The mean concentrations and ranges of macro elements of serum (g/l) in lactating cows
Parameter Mean ±SD (n=24)
Range (n=2418)
Central ±SD (n=14)
North ±SD (n=7)
South±SD (n=3)
Na 2.38±0.61 1.13-4.04 2.56±0.62 1.99±0.54 2.44±0.21
K 0.39±0.06 0.28-0.58 0.39±0.07 0.38±0.03 0.44±0.04
Ca 0.81±0.32 0.49-2.16 0.84±0.41 0.75±0.11 0.78±0.06
Mg 0.02±0.01 0.003-0.04 0.02±0.01 0.02±0.01 0.03±0.01
P 0.15±0.05 0.07-0.22 0.15±0.05 0.13±0.05 0.13±0.04
Table 1.6. The mean concentration and ranges of trace elements in lactating cows (µg/ml)
Parameter Mean±SD
(n=24) Range (n=24)
Central±SD (n=14)
North±SD (n=7)
South±SD (n=3)
Fe 2.43±1.53 0.40-6.10 1.86±1.20 3.13±1.92 3.43±0.08
Mn 0.26±0.14 0.10-0.70 0.28±0.15 0.27±0.12 0.17±0.05
Cu 0.60±0.17 0.20-1.00 0.56±0.17 0.61±0.08 0.77±0.20
Mo 0.36±0.35 0.07-1.31 0.33±0.03 0.56±0.13 0.07±0.00
Zn 3.71 ± 1.63 0.65-6.84 4.04±0.43 2.84±1.87 4.23±1.43
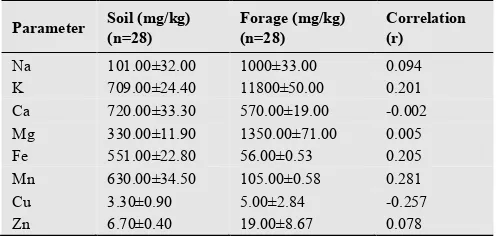
The results show that the mineral availability in soils was affected by pH values which were fairly acidic ranging from 5.1-7.2. Alkaline metals are usually soluble in acidic medium, a condition that increases their availability. High levels of Ca, Fe and Al usually influence availability of Zn, Cu and P through Ca-Zn, Fe-Cu and A1-PO43- interactions
(Ashraf et al, 2005). Correlation coefficients (r) between soil and forage element concentrations (Table 1.7) were mainly positive with their differences being significant (P<0.05). This shows that an increase in soil mineral concentration leads to an increase in plants’ concentration.
Table 1.7. Correlation analyses between mean mineral concentrations of soils and forages
Parameter Soil (mg/kg) (n=28)
Forage (mg/kg) (n=28)
Correlation (r)
Na 101.00±32.00 1000±33.00 0.094
K 709.00±24.40 11800±50.00 0.201
Ca 720.00±33.30 570.00±19.00 -0.002
Mg 330.00±11.90 1350.00±71.00 0.005
Fe 551.00±22.80 56.00±0.53 0.205
Mn 630.00±34.50 105.00±0.58 0.281
Cu 3.30±0.90 5.00±2.84 -0.257
Zn 6.70±0.40 19.00±8.67 0.078
4. Conclusion
Based on this investigation it is concluded that there was severe deficiency of most minerals in forages in the three regions sampled since these macro minerals were not much higher than the required range for ruminants grazing therein. Southern region’s soils in Uasin Gishu County revealed lower levels in Fe and Cu in 14% and 4% of samples. On the other hand, the central region recorded lower levels Na, Ca and Mg in soil although they were above recommended levels. The forage samples from southern region were deficient in K, Mg, and P but with no serious deficiencies in relation to requirements for grazing cattle. Central region
recorded lower levels of Fe and Cu. In animal serum, the central region presented the same trend in deficiencies of Fe and Cu as was in forage but northern region had lower levels of macro elements. This could be attributed to Ca-P and Mg-P antagonisms. This means that grazing areas of southern region as Ainabkoi and Kesses; and in central region as areas around Eldoret town are experiencing deficiencies in macro and trace elements respectively. Soil pH and mineral interrelationships within samples, were main factors influencing mineral concentrations in the
study area. These deficiencies require possible
supplementation trials for confirmation before long-term remedies can be set.
References
[1] Z. I. Khan, A. Hussain, M. Ashraf and L.R. McDowell. (2006). Mineral Status of Soil and Forages in South Western Punjab, Pakistan. Asian-Australian Journal of Animal Sciences, 19: 1139-1147.
[2] M. S. Bhat, M. Shaheen, R. Zaman and A. Muhee (2011): Mineral Inter-relationship among Soil, forage and Dairy cattle in Kashmir, India. Vet. World, 2011, Vol.4(12):550-553 RESEARCH
[3] NRC, National research council, (2001): Nutrient requirements of domestic animals. Nutrient requirements of dairy cattle. 7th Rev. Ed.Natl. Academy of sciences. Washington, DC
[4] L.W. Greene (2000): Designing mineral supplementation of forage programs for beef cattle. J ANIM SCI 2000, 77:1-9.
[5] E. J. Underwood, (1981): The mineral nutrition of livestock. 2nd Ed. Commonw. Agric. Bur. London
[7] M.A. Grusak and Dellapenna (1999). Improving the nutrient composition of plants to enhance human nutrition and health.Annu.Rev.Plant Physiol.Mol.Biol.,50:133-161.
[8] J. E. Sprinkle, S. P. Cuneo, H. M. Frederick, R. M. Enns, D. W. Schafer, G. E. Carstens, S. B. Daugherty, T. H. Noon, B. M. Rickert and C. Reggiardo (2006): Effects of a long-acting, trace mineral, reticulorumen bolus on range cow productivity and trace mineral profiles; J ANIM SCI, 84:1439-1453.
[9] I.O. Jumba, N.F. Suttle, E.O Hunter and S.O. Wandiga (1995a). Effects of soil origin mineral composition and herbage species on the mineral composition of forages in the mount Elgon region of Kenya. I. Calcium, phosphorus, magnesium and sulphur. Tropical Grasslands, 29, 40-46.
[10] O.Jumba , N.F. Suttle ,E.O.Hunter and S.O. Wandiga (1995b): Effects of soil origin, mineral composition and herbage species on the mineral composition of forages in mount Elgon region of Kenya. I. Calcium, phosphorus, magnesium and sulphur. Tropical Grasslands, 29, 40-46.
[11] Z.I. Khan, M. Ashraf, A. Hussain and L.R. McDowell (2005). Seasonal variation of trace elements in a semiarid veld pasture. Communications in soil science and plant analysis, 37:1471-1484.
[12] N.F. Suttle, (1988). Predicting the risk of mineral deficiencies in grazing animals. S. Afri. J. Anim.Sci. 18(1). Pp 15-21.
[13] Ndebele, N. J.P. Mtimuni, I.D.T. Mpofu, S. Makuza and P. Mumba (2005). The status of selected minerals in soils, forage and Beef Cattle tissues in a semi-arid region of Zimbabwe. Tropical Animal Health and Production, 37: 381-393.
[14] B. Dumont, J. P. Garel, C. Ginane, F. Decuq, A. Farruggia, P.
Pradel, C. Rigolot and M. Petit (2007): Effect of cattle grazing a species-rich mountain pasture under different stocking rates on the dynamics of diet selection and sward structure. Animal , 1:7, pp 1042–1052 & The Animal Consortium 2007, doi: 10.1017/S1751731107000250
[15] P.R. Hesse (1971). A text of soil chemical analysis. John Murray Ltd.London
[16] F. D. O. Oduor (2002), Identification of the mineral deficiencies on soils, forages and animal tissues as constraints to cattle production in Mt. Elgon region of western Kenya. PhD Thesis, University of Nairobi
[17] T. Tamada (2003). An indirect spectrophotometric method for the determination of silicon in serum, whole blood and erythrocytes. Anal Sci. 2003 Sep;19(9):1291-6.
[18] Z. I. Khan, M. Ashraf, I. Javed and S. Ermidou-Pollet (2007): Transfer of sodium from soil and forage to sheep and goats grazing in a semiarid region of Pakistan. Influence of the seasons. Trace Elements and Electrolytes, 24:49-54.
[19] R. G. D. Steel and J.H. Torrie (1986). Principles and Procedures of Statistics, 2nd Ed. McGraw Hill Book Co. Inc., New York: pp. 336-354.
[20] R. D. Rhue and G. Kidder (1983). Analytical procedures used by the IFAS extension soil testing laboratory and the interpretation of the results. Gainesville: Soil Sci. Dept., University of Florida.
[21] L. R. McDowell, J.H. Conrad, and F. Hembrey (1993). Mineral for grazing ruminants in tropical regions. 2nd Ed. Animal science department, Univ. of Florida, Gainesville.