http://www.sciencepublishinggroup.com/j/ajese doi: 10.11648/j.ajese.20190301.11
ISSN: 2578-7985 (Print); ISSN: 2578-7993 (Online)
Effect of Nutrients on Bioremediation of Crude Oil-Polluted
Water
Christiana Edward Anih, Akindele Okewale, Nsidibe-Obong Ekpe Moses
Department of Chemical Engineering, Federal University of Petroleum Resources, Effurun, Nigeria
Email address:
To cite this article:
Christiana Edward Anih, Akindele Okewale, Nsidibe-Obong Ekpe Moses. Effect of Nutrients on Bioremediation of Crude Oil-Polluted Water. American Journal of Environmental Science and Engineering. Vol. 3, No. 1, 2019, pp. 1-7. doi: 10.11648/j.ajese.20190301.11
Received: November 8, 2018; Accepted: December 19, 2018; Published: January 24, 2019
Abstract:
Crude oil pollution has been a common challenge in the Niger Delta region of Nigeria. The use of biological remediation has helped to detoxify and restore the ecosystems damaged by crude oil spillage. Nutrient addition has been proven to be an effective strategy to enhance oil biodegradation, as they could utilize crude oil as the source of carbon and energy and give a reasonably high biodegradation rate. The effect of biostimulants on the bioremediation of crude oil-polluted water was investigated in this study. Four samples, each having crude oil to water ratio of 1:4 was used. Three sets of samples were each inoculated with microbial load 1x 10⁶cfu/ml of Aspergillus Niger, and Pseudomonas Aeruginosa as microbial consortium. All the samples, including the controls, were closely observed for a period of seven weeks at one-week interval for the physiochemical parameters such as pH, Dissolved Oxygen (DO), Biochemical Oxygen Demand (BOD), Total Hydrocarbon Content (THC), turbidity, and total microbial count. Of all these parameters, only BOD, DO, turbidity, and THC were seen to decrease generally with time of remediation for all the samples. Maximum reductions in value of 94.04%, 97.45%, and 99.09% were achieved for turbidity, BOD, and THC respectively at the microbial consortium load of 1x 10⁶cfu/ml.Keywords:
Bioremediation, Water, Crude oil, Aspergillus Niger and Pseudomonas Aeruginosa, NPK (Nitrogen, Phosphorus, and Patassium), Urea1. Introduction
The need for a cleaner environment cannot be overemphasized. The pollution of our environment poses a threat to both human life, plants, animals and on materials. A large source of these contaminants is attributed to oil spills on land and sea. The most notable oil spills at sea involve large tankers, such as Exxon Valdez, which spilled thousands of tonnes of oil [2, 16]. The most responsible for these contaminations are refineries and petrochemical companies, service stations, garages, scrap yards, waste treatment plants, saw mills and wood impregnation plants [17]. Petroleum hydrocarbons contamination of the environment associated with exploration, development and production operations is a common feature in oil producing nations around the world, especially in a developing country like Nigeria where the incidence of facilities sabotage, operational failures, accidental discharges, pipeline vandalization and leakages, bunkering and artisanal refining is very common [5]. The host community in the Niger Delta Region of Nigeria is the
most affected. Crude Oil is a complex mixture of hydrocarbons and other organic compounds, including some organometallic constituents [8]. It contains hundreds of thousands of aliphatic, branched and aromatic hydrocarbons [18, 22], most of which are toxic to living organisms.
Based on the toxic level of contaminants and the risk they pose to the environment, a suitable remediation technique which brings the contamination level well below the regulatory toxic limit is selected [11]. Techniques for remediating polluted water and soil include biological, chemical, physical, electrical and thermal treatment technologies. Sometimes these methods can be used in combinations. The biological treatment techniques include
microbial bioremediation, mycoremediation and
metals. It has also proven useful with other kinds of xenobiotics, such as polycyclic aromatic hydrocarbons, pesticides, dyes etc. [1]. The chemical treatment techniques include ozone and oxygen gas injection, chemical precipitation, membrane separation, ion exchange, carbon absorption, aqueous chemical oxidation, and surfactant enhanced recovery which are expensive and require sophisticated equipment. Some chemical techniques may be implemented using nanomaterials. This technology is unconventional and emerging for remediation of heavy metals and trace elements from contaminated sites [19]. Physical treatment techniques include, but are not limited to, pump and treat, air sparging, and dual phase extraction. This technique is practically possibly only if the spatial extent and depth of the contaminated region is small. It is time consuming and in most cases, it requires further processing of contaminated water using standard chemical and biological treatment [11]. Electrical method applies electrical principles for decontaminating a particular site. The procedure is more effective for granular type of soils contaminated with heavy metals such as uranium, mercury etc. [11]. Thermal methods include incineration, electrical pyrolysis, and in-situ vitrification and are mostly useful for contaminants with high volatilization potential [11]. The main drawback of the physicochemical approaches has been owed to the high cost, low competence, limited versatility, and intrusion by other wastewater components and the handling of the excesses generated [23]. Currently, there are limited approaches to cleaning up oil spill which have spread over a large area of surface and groundwater. Some of these methods, like in situ burning or the use of dispersal agents, do a lot of harm themselves [6].
The biotic action of contaminated environment is an economically and ecologically attractive alternative to the present physicochemical methods of treatment [17, 23]. Bioremediation remains one known non-mechanical method to remove oil from an affected area without harming the area. Microbial bioremediation is the use of microbes to clean up contaminated soil and ground water. Microbes are very small organisms that may not be visible to the naked eyes, such as bacteria, that live naturally in the environment. The fundamental principle behind microbial bioremediation is biodegradation of oils: that is, the use of microorganisms to break down crude oil spill and to change the structure of the oil from large, harmful molecules to smaller, harmless substances such as fatty acids or carbon dioxide. In order to enhance the effects of natural biodegradation, certain substances are added to the crude oil spill to encourage the growth of microorganisms and therefore increase the rate of oil breakdown [21].
The two main methods to oil-spill bioremediation are bioaugmentation (that is the addition of oil-degrading bacteria to supplement the existing microbial population) and biostimulation (the addition of nutrients or other growth limiting co-substrates to stimulate the growth of indigenous oil degraders). Venosa [21] reported that, bioaugmentation has never been shown to have any long-term beneficial effects in shoreline clean-up operations.
When an oil spill occurs, it results in a huge influx of carbon into the affected environment. The elimination of a range of contaminant from the environment requires an in-depth knowledge of the relative importance of different pathways and regulatory networks to carbon influx in particular environments and for particular compounds, which will enhance the development of bioremediation technologies. For the indigenous microorganisms to be able to convert this carbon into more biomass, they need significantly more nitrogen and phosphorus than is normally present in the affected environment. These elements are essential ingredients of protein and nucleic acids of living organisms.
Bioremediation is a technology that is simply the addition of materials such as nutrients, microbial products or microorganisms and aeration to contaminated areas [9]. The use of microorganisms for remediation purposes is thus a possible solution for hydrocarbon pollution since it includes sustainable remediation technologies to rectify and re-establish the natural condition of groundwater.
Demonstrating the effectiveness of oil spill bioremediation technologies in the field is difficult because the experimental conditions cannot be controlled as well as is possible in the laboratory [21]. This study performed in the laboratory, aims to investigate the bioremediation-effects of nutrients such as: NPK (Nitrogen, Phosphorus and Potassium) and Urea fertilizers on crude oil-polluted water.
2. Materials and Methods
2.1. Micro-Organisms
The fungi (Aspergillus Niger) and bacteria (Pseudomonas Aeroginosa) consortium were used as the oil degrading micro-organisms for this study. These micro-organisms were cultured in the laboratory at FO Petrol Station, opposite Eddy Grace Petrol Station, Isiohor, Edo State, Nigeria. The micro – organisms were stored in a refrigerator at 4°C until it was to be used. The Thom’s chamber was used to determine the concentration of the microbial consortium (numbers of cells in 1 mL of a suspension) [4].
2.2. Preparation of Samples and Bioremediation Studies
The simulated crude oil-polluted water used in this study was obtained by spilling some quantities of Escravos light crude on portable water. The crude oil was collected from an Oil Refining Company in the Niger delta region of Nigeria. The properties of the crude oil sample were: API gravity (35.3 APIo), specific gravity (0.85), viscosity at 40°C (3.28 cSt), sulphur content (0.15 wt. %).
Table 1. Samples used and their constituents.
Sample Constituents
A (control) crude oil and water only
B (control) crude oil, water, Aspergillus Niger, & Pseudomonas Aeroginosa (microbial consortium)
C crude oil, water, Aspergillus Niger, Pseudomonas Aeroginosa, and NPK (15 – 15 – 15) fertilizer (biostimulant) D crude oil, water, Aspergillus Niger, Pseudomonas Aeroginosa, and urea fertilizer (biostimulant)
50 mL of 1x 10⁶cfu/ml concentration was inoculated as microbial load for the consortium of microbes into samples labelled B, C and D each. Samples labelled C and D were further amended by the addition of 60 g of nutrients (bio-stimulant) to 1L of each mixture of the samples. All the vessels for the experimental set-up was stored at 30°C and agitated twice daily for aeration and mixing to increase contact between the microbial consortium, nutrients and contaminated water. Samples from each vessel were analyzed at day zero and subsequently at every seven days’ interval for forty-nine (49) days. The following bioremediation indicating parameters in the polluted water were checked in the study of remediation; Biochemical Oxygen Demand (BOD5), Turbidity, Total Hydrocarbon Content (THC), pH,
Total Microbial Count (TMC), and Dissolved Oxygen (DO).
2.3. Methods Used in Analytical Studies
2.3.1. Determination of pH
The pH values were obtained at the site of collection, by using a pocket pH meter, Jenway model [7].
2.3.2. Determination of Turbidity
Distilled water (25 mL) was poured into the cuvette and readings obtained at zero in the spectrophotometer (Hach DR2010, model) with wavelength of 450 nm. Another 25 mL of the polluted water sample was poured into another cuvette with readings obtained using the spectrophotometer at 450nm.
2.3.3. Determination of Dissolved Oxygen (Jenway Model)
The display reading was set at zero using the zero-control button. The probe was immersed in solution that has been set to zero for about 10 minutes so as to polarize the probe. The probe was removed from solution and inserted into a beaker filled with 100 mL distilled water. The probe was held about 1 cm above the water. The display reading was adjusted to display 100 using the slope control. The probe was subsequently immersed in the water sample and stirred gently all the time. The dissolved oxygen content was then taken in mg/l.
2.3.4. Determination of BOD
The water sample was thoroughly aerated. The Dissolved Oxygen (DO1) was determined on a suitable portion of the
water sample. The screw – topped incubation bottle was filled to the brim with distilled water. This was sealed and incubated in the dark for 5 days at 20°C. Dissolved oxygen (DO5) was determined from a suitable portion of the
incubated sample. BOD is the difference between the two determined DO levels (DO1 and the DO5).
2.3.5. Determination of RHC (Residual Hydrocarbon Content)
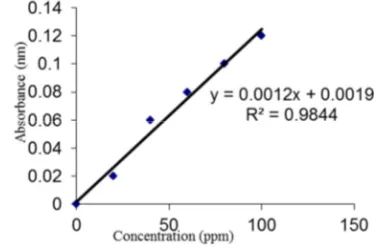
A volume of 50 mL water sample was measured into 150 mL separating funnel. 10 mL of n-hexane was added to the solution and was shaken manually for 2 minutes. The stopper was removed and the solution was allowed to settle down for 20 minutes. The water layer was drained off, the hexane layer was collected, and reading taken at 460 nm wavelength using spectrophotometer. The standard THC curve was obtained with hexane used as blank. The THC was calculated using Equation (1):
! " # (1)
The slope of the THC curve can be read from Figure 1 as 0.0012 and used in Equation (1) above to calculate the THC in parts per million (ppm).
Figure 1. Standard THC curve.
2.3.6. Determination of TMC
3. Results and Discussions
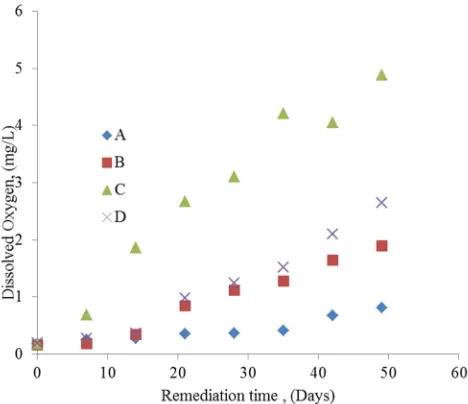
Figure 2 shows the dissolved oxygen variations with respect to remediation time for the polluted water samples in the four vessels. It is obvious that, dissolved oxygen increases with time of remediation for all samples. But the least amount was noted with sample labelled A which had neither nutrient nor microbes added to it, followed by the sample labelled B which had microbes but no nutrient in it.
The highest value of dissolved oxygen was observed in the sample labelled C; this can be attributed to remediation process stimulated by the presence of NPK fertilizer, the bio-stimulant. The dissolved oxygen level is directly related to good water quality and vice versa.
Figure 2. Variation of Dissolved Oxygen with remediation time.
Figure 3. Turbidity variation with remediation time.
Figure 3 shows the variations in the value of turbidity for the various samples with respect to remediation time. It can be seen that, turbidity value decreases with remediation time as a result of biodegradation induced by the indigenous and exogenous microbes present in the crude oil-polluted water. The same trend of a general decrease in turbidity values with remediation time was reported [13]. It is observed from
Figure 3 that, samples labelled A and B (both controls) which were not stimulated with nutrient had the highest values of turbidity, which indicates higher light penetration. In addition, a 94.04% reduction in turbidity was achieved in sample labelled C stimulated with NPK fertilizer at the end of remediation process. This was the highest reduction in the value for turbidity for all the samples. Turbidity levels of water are an indication of suspended particles that may not be visible to the eyes. This implies that values of turbidity are inversely proportional to the quality of water. Thus, sample C gave the best water quality.
Figure 4. Variation of BOD with remediation time.
The effect of remediation time on BOD of the samples is shown in Figure 4. It was observed that the BOD of the crude oil-polluted water samples decreased with time for each of the sample from the start to the end of the bioremediation process. The BOD of the samples labelled A, B, C, and D decreased by 49.82%, 94.41%, 98%, and 97.45% respectively. This reduction indicates observable degree of bioremediation. The BOD reduction might be credited to the activities of the indigenous and bio-stimulated microbial consortium present in the wastewater which converts the crude oil into less toxic substances such as CO2, H2O and
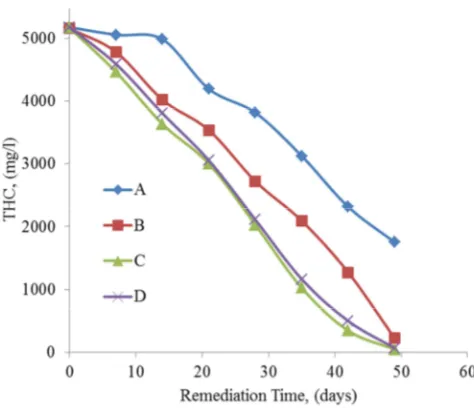
Figure 5. Variation of THC with remediation time.
The Total Hydrocarbon Content (THC) is otherwise called the Residual Hydrocarbon Content (RHC) at the end of the remediation process. From Figure 5, the values of the RHC generally decreased with remediation time. This indicates a measure a bioremediation in all four samples but to different extents. This may be due to the presence of indigenous microbes in crude oil-polluted water samples feeding on the hydrocarbons.
The efficiency of the process can be expressed in percent (%) as:
% clean-up observed = [(Initial THC value – Final THC value) / Initial THC value] x 100%
For sample labelled Control-A,
% clean-up observed = [(5175-1754)/5175] x 100% = 66.11%
For sample labelled Control-B,
% clean-up observed = [(5155-225)/5155] x 100% = 95.64% For sample labelled C,
% clean-up observed = [(5165-47)/5165] x 100% = 99.09% For sample labelled D,
% clean-up observed = [(5175-68)/5175] x 100% = 98.69% The highest reduction of 99.09% for Residual Hydrocarbon Content (RHC) was achieved inthe sample labelled C that comprised NPK fertilizer as the bio-stimulant which is an indication of bioremediation process. It was observed that the control sample labelled A which had neither microbes nor nutrients added to it had the least reduction in hydrocarbon content to 66.11% RHC. In a study of the effect of Aspergillus Niger stimulated with 0.2M sodium nitrate and 0.2M single superphosphate fertilizers (as nutrients) on hydrocarbon polluted water [10], it was shown that the control sample had the lowest drop of 52.16% for RHC whereas other samples with nutrients had reductions in RHC of 78.62% and 72.5% when stimulated with sodium nitrate and superphosphate respectively. This confirms that bioremediation processes are better when amended with nutrients.
Figure 6. Total microbial count variation with remediation time.
From Figure 6, the graph for control sample labelled A is horizontal since there were no microbes inoculated into the vessel. The microbes present were the naturally occurring microbes in the synthesized water and crude oil mixture. Whereas the Total Microbial Count (TMC) for other samples were higher due to the addition of a consortium of microbes (bio-augmentation) as well as the nutrients added to stimulate their growth. The trend observed in control sample labelled B showed a decrease in TMC owing to the fact that it was not stimulated with any nutrient. This buttresses the fact that microbes require nutrients to thrive while they function to remediate water polluted sites.
Figure 7. pH variation with remediation time.
bioremediation. This increase in pH values revealed that the pollutant (crude oil) in the water was degraded to products that are less acidic and less toxic. [4, 14] reported similar results for bioremediation of crude oil polluted-water using Aspergillus Niger and Psuedomonas Aeruginosa
4. Conclusion
The effect of nutrients (NPK 15 – 15 – 15 and Urea fertilizers) on the bioremediation of crude oil-polluted water was investigated in this study. Both bio-stimulants showed capability of enhancing the remediation process to different degrees. The use of a consortium of microbes also enhanced the process of bioremediation as reported elsewhere. However, the combination gave a better result as compared to using only a consortium of microbes. The BOD generally decreased with remediation time. The total microbial count was observed to increase with remediation time. There was a slight increase in pH. The maximum remediation was observed when the NPK (15 – 15 – 15) fertilizer was used as bio-stimulant with a 99.09% clean-up of crude oil-polluted water after 49 days. The control sample without microbial consortium and bio-stimulants had the least remediation capability. Therefore, microbial bioremediation is a recommended technique for the removal of crude oil contamination from crude oil-polluted water because, it is safe (ecologically friendly: since the products are not harmful), cheap (economically attractive) as it does not require sophisticated equipment and it can be carried out under mild environmental conditions.
References
[1] Adriana O. B, Jorge Luis F. M, Veronica L. R, Maria D. S, Ramon B. G., 2018. Phytoremediation and Fungi: An Underexplored Binomial: The New Era of Environmental Microbiology and Nanobiology. Research Gate. DOI: 10.1007/978-3-030-02369-0_5.
[2] Albaiges, J., Morales-Nin, B. and Vilas, F., 2006. The prestige Oil Spills: A scientific response. Mar. Pollution. Bull., 53: 205-207.
[3] Amenaghawon A. N, Asegame, P. A, Obahiagbon, K. O., 2013. Potential Application of Urea and NPK 15:15:15 Fertilizers as Biostimulants in the Bioremediation of Domestic Wastewater. American Journal of Environmental Protection. 2013, vol.1 No. 4, 91-95.
[4] Amenaghawon A. N, Obahiagbon, K. O, Osamuyimen O., 2014. Impact of Nutrients, Aeration and Agitation on the Bioremediation of crude Oil polluted water using mixed microbial culture. doi: 12983/ijsres-2014-p0043-0048. [5] Aniefiok E. I, Thomas A. H, Clement O. O, Ekpedeme R. A,
Iniemem J. I ., 2018. Petroleum Hydrocarbon Contamination of Surface water and Groundwater in the Niger Delta Region of Nigeria. Journal of Environment Pollution and Human Health. 2018, 6(2), 51-61. DOI: 10.12691/jephh-6-2-2.
[6] Anonymous, 2016. Bioremediation of Oil Spills: How Does It Work? Available at: https://greentumble.com/bioremediation-of-oil-spills-how-does-it-work/ accessed 18/11/2018.
[7] Bates G. Roger, 1973. Determination of pH; theory and practice. Publisher: New York, Wiley (1973) 2nd ed.
[8] Butler, C. S. and Mason, J. R., 1997. Structure and functional analysis of the bacterial aromatic ring-hydroxylating dioxygenases. Adv. Microb.Physio.,38:47-84.
[9] Chuma C. Okoro, 2010. Enhanced Bioremediation of Hydrocarbon Contaminated Mangrove Swamp in the Nigerian Oil Rich Niger Delta using Seawater Microbial Inocula amended with Crude Biosurfactants and Micronutrients. Nature and Science Journal. 2010; 8(8) pp2.
[10] Efeovbokhan V. E., Anawe, P. A. L., Makinde F. A., Odunmbaku O.: Comparison of the efficiency of sodium nitrate and superphosphate as nutrients in the bioremediation of petroleum hydrocarbon polluted water “ American journal of scientific and industrial research” 2011, 2(2): 278-282. [11] Guwahati Iit, 2012. NPTEL: Contaminated site remediation.
Available at https://nptel.ac.in/courses/105103025/20 accessed 12/12/2018.
[12] Kshirsagar A. D, 2013. Application of bioremediation process for wastewater treatment using aquatic fungi. International Journal of Current Research, vol 5, issue 7, pp 1737-1729. [13] Obahiagbon, K. O, Agbonghae, E. O, Amenaghawon N. A,
2014. Effect of microbial load of Aspergillus niger and Psuedomonas aeruginosa on the bioremediation of crude oil polluted water.
[14] Obahiagbon, K. O, Aluyor, E., 2009. Comparison of the efficiency of sodium nitrate and sodium nitrite as nutrients in the bioremediation of petroleum hydrocarbon polluted water. Sci.Res.Essays 732, pp4.
[15] Otokunefor, T. V, Obiukwu, C., 2010. Efficacy of inorganic nutrients in bioremediation of a refinery effluent. Vol 9 (No.1), pp111-125.
[16] Paine, R., Ruesink, J., Soulanille, E., and Wonham, M., 1996. Trouble on oiled waters: Lesson from the Exxon Valdez Oil Spill. Annu. Rev. Ecol. Syst., 27: 197-235.
[17] P. K. Jain, V. K. Gupta, R. K. Gaur, M. Lowry, D. P. Jaroli and U. K. Chauhan, (2011). Bioremediation of Petroleum Oil Contaminated Soil and water. Research Journal of Environmental Toxicology, 5:1-26 DOI: 10.3923/rjet.2011.1.26. [18] Prince, R., 1993. Petroleum Spill bioremediation in Marine
Environments. Crit. Rev. Microbial., 19: 217-224.
[19] Ruchita Dixit, Nasiullah, Deepti Malaviya, Kuppusamy Pandiyan, Udai B. Singh, Asha Sahu, Renu Shukla, Bhanu P. Singh, Jai P. Rai, Pawan Kumar Sharma, Harshad Lade and Diby Paul (2015). Bioremediation of heavy metals from soil and aquatic environment: An Overview of Principles and Criteria of Fundamental Processess. Sustainability 2015,7,2189-2212; doi: 10.3390/su7022189.
[20] Satyawali, Y. and Balakrishnan, M., 2008. Wastewater treatment in molasses-based alcohol distilleries for COD and color removal: a review, Journal of Environmental Management, 86(3), 481-497. 2008.
[21] Venosa A. D., 2013. NRT fact sheet: bioremediation in oil spill response. Online:
[22] Wang, Z., Fingas, M., Blenkinsopp, S., 1998. Comparison of oil composition changes due to biodegradation and physical weathering in different oils. J. Chromatograph A., 809:89-107.