INTERNATIONAL JOURNAL OF PHARMACEUTICAL, CHEMICAL AND BIOLOGICAL SCIENCES
Available online at
www.ijpcbs.com
A NEW AND PRECISE BIO-ANALYTICAL METHOD DEVELOPMENT
AND VALIDATION FOR THE ESTIMATION OF EFAVIRENZ IN
HUMAN PLASMA BY RP-HPLC
KS. Sumanth
1*, A. Srinivasa Rao
2and D. Gowri Shankar
31
Department of Pharmaceutical Analysis, Sri Vasavi Institute of Pharmaceutical
Sciences, Andhra Pradesh, India.
2
Department of Pharmaceutical Analysis, Shri Vishnu College of Pharmacy,
Andhra Pradesh, India.
3
University College of Pharmaceutical Sciences, Andhra University,
Visakhapatnam, Andhra Pradesh, India.
INTRODUCTION
Efavirenz1,2 (6-chloro- 4 - (2 – Cyclopropyl – 1 -
ethynyl) – 4 – trifluoro methyl (4S) - 1, 4 – dihydro - 2H – benzo [D] [1,3] oxazin - 2-one) is a non-nucleoside reverse transcriptase inhibitor (NNRTI) and is used as part of highly active antiretroviral therapy (HAART) for the treatment of a human immunodeficiency virus (HIV) type 1. For HIV infection that has not previously been treated, Efavirenz and Lamivudine in combination with Zidovudine or Tenofovir is the preferred NNRTI-based regimen. Efavirenz is also used in combination with other antiretroviral agents as part of an expanded post exposure prophylaxis regimen to prevent HIV transmission for those exposed to
materials associated with a high risk for HIV transmission3,4 (Fig. 1)
The present study is to develop a RP-HPLC method for the determination of EFA in human plasma. The Literature survey reports different analytical methods for EFA based on UV5-7,
HPTLC8, HPLC9-15, stability indicating HPLC16-19,
Bio-analytical20,21, LC-MS22,23 were reported.
However there were few methods reported for the determination of EFA in huan plasma, the present aim is to develop a more precise, accurate, simple and RP-HPLC method for the estimation of EFA in human plasma and validate according to USFDA guidelines. The molar absorptivity of EFA was found maximum at 247 nm. The validated method will be used for the
Research Article
ABSTRACT
A new, simple, rapid and accurate RP-HPLC method was developed for the estimation of Efavirenz (EFA) in human plasma and validated. The method was developed on SHISEIDO C18 column (250 x 4.6 mm i.d, 5µ) using Acetonitrile : 20 mM phosphate buffer (pH 3.0). The wavelength used for detection of EFA is at 247 nm. The flow rate used for the elution is 1 ml/min. sample preparation for
the extraction of drug was done using solid phase extraction method by Phenomenex STRATA® C18
sorbent, a 24 station SPE vacuum extraction assembly is used for the entire method. Methyl prednisolone was used as internal standard, the retention time of Efavirenz and internal standard were found to be 5.7 and 3.7 min respectively. Linearity was established in the range of 0.43 – 8.60 µg/ml and the coefficient of regression (R2) value was found to be 0.995, having 0.037 as slope. The method was precise with %RSD < 2 for both intraday and interday precision. The accuracy of the method was performed over three levels of concentration and the recovery was in the range of 98-102%. The method can be successfully applied for quantifying the drug in human plasma for bioavailability and bioequivalence studies.
quantification of EFA in bioavailability and bioequivalence studies.
Fig. 1: Chemical structure of EFA
MATERIALS AND METHODS Chemicals and reagents
Efavirenz (EFA) working standards was procured from Aurobindo pharma Ltd. Hyderabad. Tablets were purchased from the local Pharmacy of Tadepalligudem. HPLC grade water was purchased from Thermo Fisher
Scientifics Ltd., Mumbai. HPLC grade
Acetonitrile, Methanol and Orthophosphoric acid were procured from Merck specialties Pvt. Ltd., Mumbai.
Instrumentation and analytical conditions
RP-HPLC method was performed on the HPLC system (Shimadzu) consisting of binary gradient pump with UV detector (LC-20AD). Rheodyne injector with 20 µl fixed loop was used for injecting samples on SHISEIDO C18 column (250 x 4.6 mm i.d, 5µ) in the present study.
Preparation of solutions
Preparation of Efavirenz (drug) Stock solution
Accurately weighed 10 mg of Efavirenz working standard and transferred to 10 ml volumetric flask. Added 5.0 ml of Methanol : Water (50 : 50) and sonicated to aid dissolution. Make up the volume up to the mark with Methanol : Water (50 : 50) stopper the flask and shaken gently to mix the contents.
Preparation of Methylprednisolone [IS] stock solution
Accurately weighed 10 mg of
Methylprednisolone working standard and transferred to 10 ml volumetric flask. Add 5.0 ml of Methanol : Water (50 : 50) and sonicated to aid dissolution. Make up the volume to the mark with Methanol : Water (50 : 50) stopper the flask and shaken gently to mix.
Drug intermediate stock solution
Aliquoted 1 ml of drug stock solution into 10 ml volumetric flask to get the concentration 100 µg/ml. Added required volume of diluent [50 : 50 v/v Methanol : Water] and sonicated to aid
dissolution. Make up the volume to the mark with diluent. Stopper the flask and shaken gently to mix.
Internal standard intermediate stock solution
Aliquoted 1 ml of internal standard stock solution into 10 ml volumetric flask to get the concentration 100 µg/ml. Added required volume of diluent [50 : 50 v/v Methanol : Water] and sonicated to aid dissolution. Make up the volume to the mark with diluent. Stopper the flask and shaken gently to mix.
Preparation of Spiked Plasma Calibration Curve
and Quality Control samples
Prepared the CC standards in the range of 0.43, 0.86, 2.15, 3.2, 4.3, 6.4, 7.5 and 8.6 µg/ml by spiking CC spiking solutions and QC standards in the range of 0.43, 1.075, 4.3, 8.6 µg/ml by spiking QC spiking solutions in to screened human plasma.
The calibration curve standards were prepared by ailquoting 43, 86, 215, 320, 430, 640, 750 and 860 µl of drug intermediate stock solution into a 10 ml volumetric flask and make up the volume with the diluent to get the concentrations 0.43, 0.86, 2.15, 3.2, 4.3, 6.4, 7.5, and 8.6 µg/ml. The QC standards were prepared by ailquoting 43, 86, 430 and 860 µl of drug intermediate stock solution into a 10 ml volumetric flask and make up the volume with the diluent to get the concentrations 0.43 (LLOQ), 0.86 (LQC), 4.3 (MQC) and 8.6 (HQC) µg/ml.
Aliquoted 20 µl of each CC standards, QC sample, 20 µl of internal standard solution (1 µg/ml) into pre-labelled Eppendorf tubes containing 50 µL of plasma and capped them tightly. Stored CC standard, QC samples, standard blank and standard zero samples in deep freezer [below – 80°C].
Sample Preparation
The plasma sample used for the developed method was K2-EDTA. The plasma was taken out
from the refrigerator and thawed. It is then spiked with required concentration of sample. For 50 µl of plasma, 20 µl of sample solution and 20 µl internal standard were added and vortexed for 5 min.
All the samples were prepared by using solid phase extraction (SPE) method. The SPE cartridges were purchased from phenomenex India Pvt. LTD. The cartridges were contained with C18 stationary phase. The cartridges must
Step 1
SPE cartridges (strata C18-E from Phenomenex) are conditioned with 0.5 ml of methanol. Care should be taken that adsorbent bed should not be dry, methanol should be present upto the level of adsorbent bed.
Step 2
Then the cartridges were loaded with 0.5 ml of vortexed plasma sample. By applying vacuum the plasma should be drained off. The drug will be attached to the adsorbent.
Step 3
The Cartridges are washed with HPLC water to liberate polar impurities.
Step 4
Finally the cartridges were loaded with 0.5 ml of mobile phase to elute the drug from the adsorbent. This eluent was collected in to the Eppendorf tubes by applying vacuum.
After analysis all the plasma samples were stored in refrigerator at -70°C.
Preparation of the mobile phase
The elution was done using mobile phase consisting of Acetonitrile and 20 mM phosphate buffer pH-3 (30:70 v/v). The buffer was prepared by dissolving 6.8g of potassium dihydrogen orthophosphate in 1000 ml water adjusted the pH with 0.1 M ortho phosphoric acid up to 3.0 ± 0.1. The buffer was filtered through a 0.5 μ nylon membrane filter before prior to use. Column was equilibrated for at least 30 min with mobile phase flowing through the system.
Optimized chromatographic conditions
Mobile phase used : Acetonitrile:
Phosphate buffer pH 3.0 ± 0.1
Mobile phase ratio : 30 : 70 v/v
Flow rate : 1.0 ml/min
Column : SHISEIDO C18 (250 ×
4.6 mm, 5 μm)
Detector wavelength : 247 nm using SPD 20-AD Dualwavelength detector
Data station : Lab solutions
Column temp : Ambient
Injection volume : 20 μL
Diluent : Methanol : Water
Ratio : 50 : 50
Internal standard : Methyl prednislone
Retention times : Methylprednisolone
3.7 min and Efavirenz 5.7 min
Tailing factor : Methylprednisolone
1.1 and Efavirenz 1.2
Theoretical plates : Methylprednisolone
4256 and Efavirenz 5964
METHOD VALIDATION24
The objective of validation of a Bioanalytical procedure is to demonstrate that it is suitable for its intended purpose. Bio Analytical Method validation is the process of demonstrating that analytical procedures ae suitable for their
intended use” [US Food and Drug
Administration Draft Guidance for Industry, 2000].
Performed the experiments involved in method validation as discussed below.
System Suitability
Processed aqueous standard at MQC level and ran the chromatographic device with injecting six consecutive from aqueous standard. Calculated the mean, standard deviation [SD] and coefficient of variation [CV] for response ratio and retention time of drug and IS.
Acceptance Criteria
Coefficient of variation [CV] for Response ratio should be ≤ 5% and retention time of drug and IS should be ≤ 2%.
Selectivity and Specificity
Prepared and processed six blank matrix and six LOQ standards using six different lots of plasma from six individual healthy donors receiving no medication. Analyzed the samples on a chromatographic device for the assessment of potential interferences with endogenous substances. Evaluated the interference at the Retention time of analyte and internal standard [IS] by comparing the response in blank matrix against the mean response of the extracted LOQ standard.
Acceptance criteria
1. Response of the interfering peaks at the retention time of the analyte[s] should not be more than 20 % of the mean LOQ response.
2. Response of the interfering peaks at the retention time of internal standard should not be more than 5 % of mean of internal standard response.
3. At least 80 % of the screened matrix lots should meet the above-mentioned acceptance Criteria. If the criteria for selectivity are not met then repeat the evaluation or modify/change the method to eliminate interference.
Sensitivity Limit of detection
substance (a blank value) with a stated confidence level (generally 99%).
Limit of quantification
LOQ is the lowest concentration at which the analyte can not only be reliably detected but at which some predefined goals for bias and imprecision are met. The LOQ may be equivalent to the LOD or it could be at a much higher concentration it cannot be lower than the LOD.
Acceptance Criteria
The analyte S/N should be 3:1 for LOD and 10:1 for LOQ.
Linearity
Evaluated at least three calibration curves generated using spiked samples to establish linearity. The matrix based standard curve consisted of minimum of eight standard points excluding blanks. The organization of calibration curve is given below
Calculated the mean concentrations, S.D, CV and % nominal for all calibrants of the three calibration curves using the chosen regression algorithm. Not included standard blank and standard zero in the calibration curve. However, included the accepted standard from calibration curve. Tabulated the results of calibration curve parameters e.g. slope, intercept and coefficient of correlation.
Acceptance criteria
1. Consider the first run of STD-1 and STD-8. If first run fails for the acceptance criteria, consider the second one. Never consider both the values of duplicate standards for calculation.
2. At least 75 % non-zero standards
should meet the following criteria, including the LLOQ [lower limit of quantitation] & the ULOQ [upper limit of quantitation].
3. Deviation of the LOQ standard from nominal concentration should not be more than ± 20%.
4. Deviation of standards other than LOQ from nominal concentration should not be more than ± 15 %.
Accuracy and Precision
Prepared calibration standards and quality control samples. Processed the batch of CC
Standards and QC samples as per the method. Determined the mean concentrations, standard deviation, accuracy and precision at each LQC, MQC and HQC concentration level. Assessed both within and between-run accuracy and precision by analysing three validation batches. Intra-day accuracy and precision were evaluated by analysis of quality control samples at four different levels [n = six at each level] on the same day. These levels were chosen to demonstrate the performance of the method and to determine the lower limit of quantification of the method. The upper limit of quantification was given by the highest level of
the calibration curve. Samples with
concentration above this upper limit of quantification should be diluted prior to reanalysis. To assure the inter-day accuracy and precision, the intra-day assays were repeated on three different days. The overall performance was calculated.
Acceptance Criteria
Acceptance criteria should be met for three validation batches including ruggedness batch for within and between batch accuracy and precision.
Stock Solution Stability
Prepared stock solution of analyte[s] and internal standard. Diluted this stock solution with reconstitution solution or any other suitable solvent to appropriate concentration at LQC, MQC and HQC level. Evaluated analyte[s] and internal standard separately as given below for short term and long-term stability conditions.
Short Term Stability
Long Term Stability
Stored the stock solutions of analyte[s] and internal standard in refrigerator [2-8ºC] for at least 3 weeks. On the recommended period of storage, removed the stability samples i.e. Analyte[s] and IS and allowed them to reach room temperature and prepared their
appropriate dilution [stability sample].
Recorded the time of withdrawal refrigerator. Consecutively prepared fresh stock of analyte and Internal Standard followed by their dilution
[comparison sample]. Acquired six consecutive injections for stability and comparison sample with the help of chromatographic device and recorded their peak responses.
Evaluated the long-term stability of stock by comparing the mean response of freshly prepared stock solution after applying correction factor of concentration of analyte[s] or IS [comparison sample] versus stored stock [stability sample].
Acceptance criteria
Percent stability of drug and IS stocks should be within the range of 90 -110 % for both short term and long-term stock stability.
Dry Extract Stability
Retrieved six replicates of each LQC and HQC from the deep freezer and allowed them to thaw at room temperature, processed and stored them in the refrigerator below 8ºC for a period of 24 hrs or any other recommended period. Labelled them as dry extract stability samples with appropriate sample Labels. On the completion of recommended period, analyzed the dry extract samples using freshly processed calibration curve and QC samples. This stability experiment was carried out, whenever the sample processing involves evaporation before injecting on chromatographic device. Stability duration is calculated as difference between the storage time in refrigerator and reconstitution time of stability sample.
Evaluated the Dry extract stability by comparing the mean of back calculated concentration of stability sample against the mean of back calculated concentration of comparison sample.
Acceptance Criteria
The percent stability of the analyte[s] should be within 85-115 %.
Bench Top Stability in Matrix
Retrieved six samples each of LQC, MQC and HQC from freezer (-70°) and allowed them to thaw at room temperature or in water bath at room temperature for 6.0 to 8.0 hrs. After 6.0 to 8.0 hrs taken another set of QCs and CCs from deep freezer and thawed these samples. Processed all the sets of low and high QC samples and analysed using freshly processed calibration curve along with QC samples. Evaluated the stability by comparing the mean of back calculated concentrations of stability
samples against mean of back calculated concentrations of freshly processed comparison samples.
Acceptance criteria
The percent stability of the analyte[s] should be within 85-115%.
Freeze Thaw Stability in Matrix
Acceptance Criteria
The freeze-thaw stability should be within the range of 85- 115% at LQC & HQC levels.
Long Term Stability in Matrix
Performed the long-term stability at –80ºC or as per protocol requirement for a required period. Following an appropriate storage period, removed six replicates of LQC & HQC samples from deep freezer and allowed the samples to thaw. Processed and analysed them against freshly spiked calibration standards and QC samples [comparison sample] as per method. Evaluated the long-term stability by comparing the mean of back calculated concentration for stability samples to the mean of back calculated concentration of comparison sample. The long term stability duration is calculated as the difference between the date of analysis of QC samples [stability samples] and the date of preparation of spiked stability QC samples i.e. date of spiking.
Acceptance criteria
Percent stability of analyte[s] in matrix should be within the range of 85 %-115 %.
Recovery
Withdraw six aliquots of spiked quality control samples of three different concentrations corresponding to LQC, MQC and HQC [low, medium and high-quality control samples] from freezer. QC samples of P&A batches used for recovery experiments. Processed and analysed the QC samples as per the method and recorded their absolute chromatographic peak responses. Simultaneously prepared aqueous spiked standards of concentrations corresponding to LQC, MQC and HQC and analysed them as per
method and recorded their absolute
Chromatographic peak response. Calculated the mean response of each concentration level of the extracted standard and aqueous spiked standard. Compared mean response of spiked standards [LQC, MQC and HQC] with respect to the mean response obtained from each concentration level of the aqueous spiked standard. Determined the percentage recovery for each batch of LQC, MQC and HQC by using the formula
Calculated the mean % of recovery, standard deviation [SD] and coefficient of variation [CV] for each concentration of LQC, MQC and HQC. Also calculated the global mean recovery.
Ruggedness
Evaluate the Ruggedness of the method by analysing one batch of accuracy and precision using a different column. [Same type] with a
different analyst employing the same
instrument or another instrument.
Acceptance criteria
Same as mentioned in linearity [point-8.5.5.4], accuracy and precision [point-8.5.5.5].
Matrix Effect
Prepared and processed four different lots of biological matrices at a concentration equivalent LQC and HQC in triplicate. Analysed the samples on a chromatographic device along with one set of CC standards prepared from a different lot of screened plasma. Calculated the mean concentration of QC samples against CC curve for individual lots.
Acceptance criteria
The accuracy at LQC & HQC levels of at least three different lots [75% of screened Lots] should be ±15% of the nominal value and precision should be less than 15%.Matrix effect is not observed if it meets the acceptance criteria.
Anticoagulant Effect
Spiked HQC and LQC in plasma containing different anticoagulant other than used for validation. Aliquoted into different pre-labelled polypropylene tubes and stored them in deep freezer below –80ºC. Processed and analysed six aliquots of LQC, MQC & HQC [in EDTA Plasma or any anticoagulant] and injected along with CC and QCs [CPDA Plasma]. Calculated mean % Nominal for LQC, MQC & HQC prepared with EDTA [or any anticoagulant] plasma.
Acceptance criteria
RESULTS AND DISCUSSION Selectivity/ Specificity
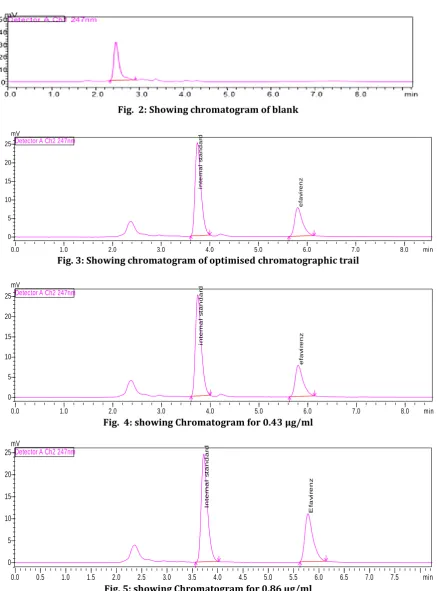
A method is said to be specific when it produces a response only for a single analyte. Method selectivity is the ability of the method to produce a response for the analyte in the presence of other interferences. In order to prove that the method chosen was specific and selective the following two sets of samples were processed and injected into the HPLC using the extraction procedure.
1. Blank sample of biological matrix (plasma
containing sodium citrate (11%) as
anticoagulant. (Fig.2: Showimg chromatogram of blank).
2. Samples from the same biological matrix
mentioned in step 1 spiked with the analyte at the lower limit of quantification (LLOQ) of the calibration curve and with the internal standard at the concentration level in the study. (Fig. 3: Showing chromatogram of optimised chromatographic trail).
System suitability
System suitability parameters such as
asymmetric factor, resolution factor, theoretical plates, LOD and LOQ were evaluated from the chromatogram. (Table 1: Showing System suitability studies)
Sensitivity
The Limit of Detection for Efavirenzwas 66 ng/ml.
The Limit of Quantification for Efavirenzwas 346 ng/ml.
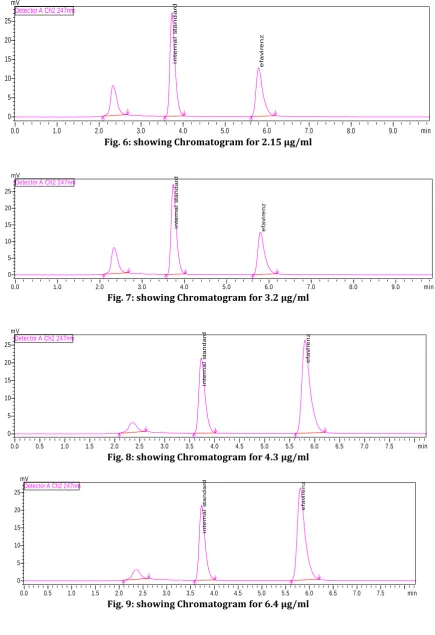
Linearity
Linearity and range of the method was analysed by preparing calibration curves using different concentrations of the standard solution containing the internal standard. The calibration curve was plotted using response factor and concentration of the standard solutions.
Linearity was estsblished according to Cmax19 of
Efavirenz. It was 4.3 µg/ml and the concentratons of Efavirenz were prepared as 10, 20, 50, 75, 100, 150, 175 and 200% of Cmax. The approximate concentrations were 0.43, 0.86, 2.15, 3.2, 4.3, 6.4, 7.5, and 8.6 µg/ml. Linearity was established over the range of (0.43 to 8.6 µg/ml for efavirenz) using the weighted least square regression analysis.
PRECISION AND ACCURACY
The precision and accuracy of the method was determined by analysing two batches each consisting of one set of calibration curve with six replicates of quality control samples at four concentration levels [Quality Control samples at
the lower limit of quantification (LLOQ), Low (LQC), Middle (MQC) and High(HQC)].
A. PRECISION
Precision is expressed as the percentage coefficient of variation (%CV) which is calculated as per the following expression: CV = (Standard Deviation /Mean) x 100
Intra-run precision
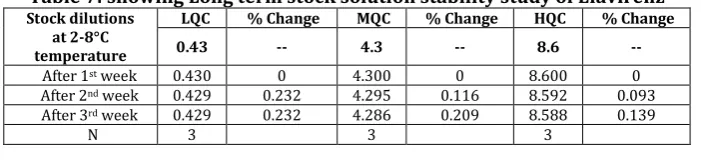
Intra-run precision was determined by calculating the percentage coefficient of variation (% CV) of the results obtained in the same run. (Table 3: showing Precision study for Efavirenz (Intra run))
ACCURACY
Accuracy is reported as % nominal of the analysed concentration which is calculated as % Nominal = (Measured Concentration /Actual Concentration) x 100
Accuracy was determined by calculating the
percentage nominal of the calculated
concentration from the actual values for quality control samples at each concentration level analyzed in a single run and the mean of percentage nominal at each level was reported (Table 4: showing Accuracy of Efavirenz).
Stock solution stability
Short term stock dilution stability at room temperature
Acceptance Criteria
% stability should be within 90 to 110% or the % change should be ± 10%.
%Stability = (Mean response of stability samples / Mean response of comparison samples) × 100%.
%Change = 100 – (Mean response of stability samples / Mean response of Comparison samples × 100)
(Table 5: showing Short term stock solution study of Efavirenz).
Short term stock dilution stability in refrigerator
Acceptance Criteria: % change should be ± 10%. %Stability = (Mean response of stability
samples/Mean response of comparison
samples) × 100%.
%Change = 100 – (Mean response of stability samples / Mean response of Comparison samples × 100)
(Table 6: showing short term Stability study of Efavirenz).
Long term stock solution stability
%Stability = (Mean response of stability samples / Mean response of comparison samples) × CF x 100%
%Change = 100 – (Mean response of stability samples / Mean response of comparison samples) × CF × 100%. (Table 7: showing Long term stock solution stability study of Efavirenz).
Dry Extract Stability
Retrieved six replicates of each LQC, MQC and HQC from the deep freezer (-70°C) and allowed them to thaw at room temperature, processed and stored them in the refrigerator below 8ºC for a period of 24 hrs. Labelled as dry extract stability samples and analyzed using freshly processed calibration curve and QC samples. (Table 8: showing dry extract stability study of Efavirenz).
Bench Top Stability in Matrix
Percentage stability of the QC samples were determined after 6 to 8 hours of thawing at room temperature. (Table 9: showing Bench top stability in matrix).
Freeze thaw stability
Six quality control samples each at LQC, MQC and HQC concentrations stored below – 70°C for at least 24 hours were removed from the deep freezer and were allowed to thaw at least for three cycles. (Table 10: showing Stability study of Efavirenz)
Long-term (LT) stability
The stability of the analyte was evaluated by comparing each of the back calculated concentrations of stability Quality Control sample (QCs) with the Mean concentrations of the respective QCs freshly prepared. (Table 11: showing Stability study of Efavirenz).
Recovery
% Recovery of analyte at each level was calculated using the following expression
{[Individual analyte peak area of extracted QCs x Concentration of analyte added (unextracted sample)] / [Mean analyte peak area of aqueous QCs x Concentration of analyte added (extracted sample)]} x 100
(Table 12: showing recovery (change in mobile phase) study for Efavirenz).
Robustness
Robustness of the method was studied by injecting the standard solutions with slight variations in the optimized conditions namely, ± 1% in the ratio of acetonitrile in the mobile phase, varying pH range ±1 and ± 0.1 ml of the flow rate. (Table 13: showing Ruggedness (change in flow rates) study for Efavirenz and Table 14: showing Ruggedness (change in mobile phase) study for Efavirenz)
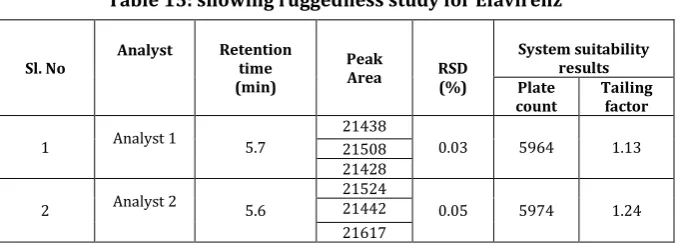
Ruggedness
Ruggedness of the method was studied by changing the experimental conditions such as operators, instruments, source of reagents, solvents and column of similar type. (Table 15: showing ruggednes study for Efavirenz).
Matrix Effect
The drug was spiked in plasma, serum and urine matrices and injected into HPLC after SPE preparation in three replicates. The system
suitability parameters were calculated
accordingly. (Fig. 13: Spiked drug and internal standard in plasma and Fig. 14: Spiked drug and internal standard in serum). (Table 16: showing matrix effect of Zidovudine).
Observation
The chromatogram in serum showed no much difference when compared to plasma. So this method can applied for the estimation of Zidovudine in serum samples. No peak was observed in urine.
Table 1: Showing System suitability studies S.No Parameters Drug
1 Theoretical Plates 5964
2 Resolution factor 7.566
3 Asymmetric factor 1.203
4 Tailing factor 1.2
5 LOD(ng/ml) 66
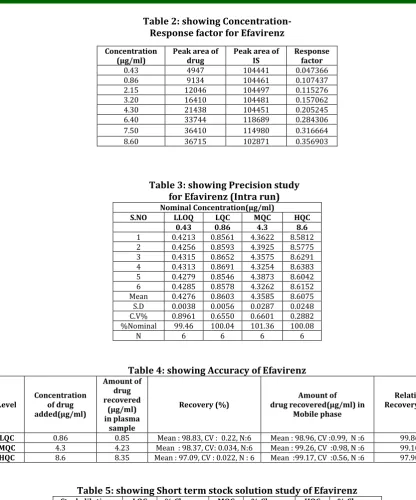
Table 2: showing Concentration- Response factor for Efavirenz
Table 3: showing Precision study for Efavirenz (Intra run) Nominal Concentration(µg/ml)
S.NO LLOQ LQC MQC HQC 0.43 0.86 4.3 8.6
1 0.4213 0.8561 4.3622 8.5812
2 0.4256 0.8593 4.3925 8.5775
3 0.4315 0.8652 4.3575 8.6291
4 0.4313 0.8691 4.3254 8.6383
5 0.4279 0.8546 4.3873 8.6042
6 0.4285 0.8578 4.3262 8.6152
Mean 0.4276 0.8603 4.3585 8.6075
S.D 0.0038 0.0056 0.0287 0.0248
C.V% 0.8961 0.6550 0.6601 0.2882
%Nominal 99.46 100.04 101.36 100.08
N 6 6 6 6
Table 4: showing Accuracy of Efavirenz
Level Concentration of drug added(µg/ml)
Amount of drug recovered
(µg/ml) in plasma
sample
Recovery (%) drug recovered(µg/ml) in Amount of Mobile phase
Relative Recovery (%)
LQC 0.86 0.85 Mean : 98.83, CV : 0.22, N:6 Mean : 98.96, CV :0.99, N :6 99.86
MQC 4.3 4.23 Mean : 98.37, CV: 0.034, N:6 Mean : 99.26, CV :0.98, N :6 99.10
HQC 8.6 8.35 Mean : 97.09, CV : 0.022, N : 6 Mean :99.17, CV :0.56, N :6 97.90
Table 5: showing Short term stock solution study of Efavirenz Stock dilutions
at room temperature
LQC % Change MQC % Change HQC % Change
0.43 -- 4.3 -- 8.6 --
After 1hr 0.43 0 4.3 0 8.6 0
After 2hr 0.429 0.232 4.289 0.255 8.582 0.209
After 3hr 0.428 0.465 4.276 0.303 8.578 0.255
N 3 3 3
Table 6: showing short term Stability study of Efavirenz Stock dilutions
at 2-8°C temperature
LQC % Change MQC % Change HQC % Change
0.43 -- 4.3 -- 8.6 --
After 1hr 0.430 0 4.300 0 8.600 0
After 2hr 0.429 0.232 4.295 0.116 8.592 0.093
After 3hr 0.429 0.232 4.286 0.209 8.588 0.139
N 3 3 3
Concentration
(µg/ml) Peak area of drug Peak area of IS Response factor
0.43 4947 104441 0.047366
0.86 9134 104461 0.107437
2.15 12046 104497 0.115276
3.20 16410 104481 0.157062
4.30 21438 104451 0.205245
6.40 33744 118689 0.284306
7.50 36410 114980 0.316664
Table 7: showing Long term stock solution stability study of Efavirenz Stock dilutions
at 2-8°C temperature
LQC % Change MQC % Change HQC % Change
0.43 -- 4.3 -- 8.6 --
After 1st week 0.430 0 4.300 0 8.600 0
After 2nd week 0.429 0.232 4.295 0.116 8.592 0.093
After 3rd week 0.429 0.232 4.286 0.209 8.588 0.139
N 3 3 3
Table 8: showing dry extract stability study of Efavirenz
Table 9: showing Bench top stability in matrix
Table 10: showing Stability study of Efavirenz
Table 11: showing Stability study of Efavirenz
Table 12: showing recovery (change in mobile phase) study for Efavirenz Concentration
Level
Concentration of Spiked sample (ng/ml)
(extracted)
Concentration of aqueous sample (un extracted)
Peak area of
extracted sample extracted sample Peak area of un Recovery
Level-I 0.43 0.43 4947 5241 94.39
Level-II 4.3 4.3 21438 22348 95.92
Level-III 8.6 8.6 36715 38926 94.31
Dry extract
Stability 0.43 LQC % Change -- MQC 4.3 % Change -- HQC 8.6 % Change -- After 24 hrs* 0.404 6.04 4.061 5.55 8.172 4.97
Bench Top
Stability in Matrix 0.43 LQC % Change -- MQC 4.3 % Change -- HQC 8.6 % Change --
After 6 hrs* 0.393 8.60 3.946 8.23 7.886 8.30
Freeze and thaw 0.43 LQC % Change -- MQC 4.3 % Change -- HQC 8.6 % Change -- Cycle 1 0.429 0.2325581 4.285 0.3488372 8.575 0.29069767
Cycle 2 0.427 0.6976744 4.274 0.6046512 8.552 0.55813953
Cycle 3 0.425 1.1627907 4.258 0.9767442 8.495 1.22093023
Mean 0.427 4.272 8.540
S.D (+/-) 0.002 0.0135 0.0411
C.V. (%) 0.4683 0.3177 0.4822
%Nominal 99.30 99.35 99.31
N 3 -- 3 -- 3 --
Long Term plasma Sample at -70º
LQC % Change MQC % Change HQC % Change
0.43 -- 4.3 -- 0.86 --
After 1st week 0.425 1.1627907 4.258 0.9767442 8.494 1.23255814
After 2nd week 0.421 2.0930233 4.234 1.5348837 8.445 1.80232558
After 4th week 0.418 2.7906977 4.212 2.0465116 8.415 2.15116279
Mean 0.421 4.234 8.451
S.D (+/-) 0.0035 0.0230 0.0398
C.V. (%) 0.8335 0.5433 0.4718
%Nominal 97.98 98.48 98.27
Table 13: showing Ruggedness (change in flow rates) study for Efavirenz
Table 14: showing Ruggedness (change in mobile phase) study for Efavirenz
Table 15: showing ruggedness study for Efavirenz
Table 16: showing matrix effect of Zidovudine Sl. No Flow rate
(ml/ min)
Retention time (min)
Peak
Area RSD (%)
System suitability results Plate
count Tailing factor
1 Less Flow (0.9) 5.8 21438 21444 0.03 5974 1.23
21428
2
Actual Flow
(1.0) 5.7
21538
0.02 5964 1.13
21437 21624
3 More Flow (1.1) 5.6
21457
0.30 5944 1.13
21463 21455
Sl. No
Mobile Phase
Retention time (min)
Peak
Area RSD (%)
System suitability results Plate
count Tailing factor
1 Organic Less
(75:25) 5.8
21438
0.05 5969 1.24
21508 21428
2 Normal (65:35) 5.7
21424
0.89 5964 1.13
21442 21417
3 Organic More
(60:40) 5.6
21526
0.09 5979 1.27
21501 21441
Sl. No Analyst Retention time (min)
Peak
Area RSD (%)
System suitability results Plate
count Tailing factor
1 Analyst 1 5.7
21438
0.03 5964 1.13
21508 21428
2 Analyst 2 5.6
21524
0.05 5974 1.24
21442 21617
Sl. No Matrix
Retention time (min)
Peak
Area RSD (%)
System suitability results Plate
count Tailing factor
1 Plasma 5.7 21525 0.6 5968 1.02
2 Serum 5.7 21438 0.8 6025 1.02
Fig. 2: Showing chromatogram of blank
Fig. 3: Showing chromatogram of optimised chromatographic trail
Fig. 4: showing Chromatogram for 0.43 µg/ml
Fig. 5: showing Chromatogram for 0.86 µg/ml
Datafile Name:LINERITY 1.1 1.lcd Sample Name:LINERITY 1.1 1 Sample ID:shesiedo ph 3 B 30 : acn 70
0.0 1.0 2.0 3.0 4.0 5.0 6.0 7.0 8.0 min
0 5 10 15 20 25 mV
Detector A Ch2 247nm
in
te
rn
a
l
s
ta
n
d
a
rd
e
fa
v
ir
e
n
z
Datafile Name:LINERITY 1.1 1.lcd Sample Name:LINERITY 1.1 1 Sample ID:shesiedo ph 3 B 30 : acn 70
0.0 1.0 2.0 3.0 4.0 5.0 6.0 7.0 8.0 min
0 5 10 15 20 25 mV
Detector A Ch2 247nm
in
te
rn
a
l
s
ta
n
d
a
rd
e
fa
v
ir
e
n
z
Datafile Name:LINERITY 2.1 1.lcd Sample Name:LINERITY 2.1 1 Sample ID:shesiedo ph 3 B 30 : acn 70
0.0 0.5 1.0 1.5 2.0 2.5 3.0 3.5 4.0 4.5 5.0 5.5 6.0 6.5 7.0 7.5 min
0 5 10 15 20 25 mV
Detector A Ch2 247nm
In
te
rn
a
l
s
ta
n
d
a
rd
E
fa
v
ir
e
n
Fig. 6: showing Chromatogram for 2.15 µg/ml
Fig. 7: showing Chromatogram for 3.2 µg/ml
Fig. 8: showing Chromatogram for 4.3 µg/ml
Fig. 9: showing Chromatogram for 6.4 µg/ml
0.0 1.0 2.0 3.0 4.0 5.0 6.0 7.0 8.0 9.0 min
0 5 10 15 20 25
mV
Detector A Ch2 247nm
in
te
rn
a
l
s
ta
n
d
a
rd
e
fa
v
ir
e
n
z
Datafile Name:LINERITY 3.2 1.lcd Sample Name:LINERITY 3.2 1 Sample ID:shesiedo ph 3 B 30 : acn 70
0.0 1.0 2.0 3.0 4.0 5.0 6.0 7.0 8.0 9.0 min
0 5 10 15 20 25 mV
Detector A Ch2 247nm
in
te
rn
a
l
s
ta
n
d
a
rd
e
fa
v
ir
e
n
z
Datafile Name:LINERITY 6.4 1.lcd Sample Name:LINERITY 6.4 1 Sample ID:shesiedo ph 3 B 30 : acn 70
0.0 0.5 1.0 1.5 2.0 2.5 3.0 3.5 4.0 4.5 5.0 5.5 6.0 6.5 7.0 7.5 min 0
5 10 15 20 25
mV
Detector A Ch2 247nm
in
te
rn
a
l
s
ta
n
d
a
rd
e
fa
v
ir
e
n
z
Datafile Name:LINERITY 6.4 1.lcd Sample Name:LINERITY 6.4 1 Sample ID:shesiedo ph 3 B 30 : acn 70
0.0 0.5 1.0 1.5 2.0 2.5 3.0 3.5 4.0 4.5 5.0 5.5 6.0 6.5 7.0 7.5 min 0
5 10 15 20 25 mV
Detector A Ch2 247nm
in
te
rn
a
l
s
ta
n
d
a
rd
e
fa
v
ir
e
n
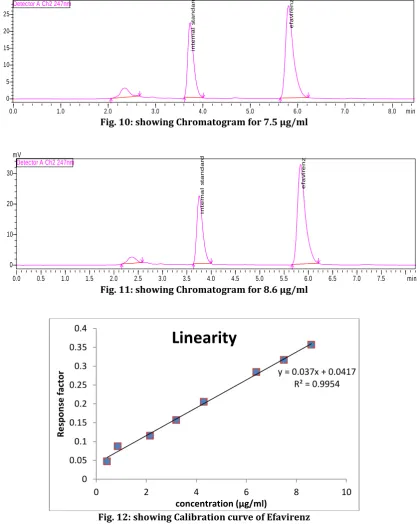
Fig. 10: showing Chromatogram for 7.5 µg/ml
Fig. 11: showing Chromatogram for 8.6 µg/ml
Fig. 12: showing Calibration curve of Efavirenz
Fig. 13: Spiked drug and internal standard in plasma
0.0 1.0 2.0 3.0 4.0 5.0 6.0 7.0 8.0 min
0 5 10 15 20 25
mV
Detector A Ch2 247nm
in
te
rn
a
l
s
ta
n
d
a
rd
e
fa
v
ir
e
n
z
Datafile Name:LINERITY 8.6 1.lcd Sample Name:LINERITY 8.5 1 Sample ID:shesiedo ph 3 B 30 : acn 70
0.0 0.5 1.0 1.5 2.0 2.5 3.0 3.5 4.0 4.5 5.0 5.5 6.0 6.5 7.0 7.5 min 0
10 20 30
mV
Detector A Ch2 247nm
in
te
rn
a
l
s
ta
n
d
a
rd
e
fa
v
ir
e
n
z
y = 0.037x + 0.0417 R² = 0.9954
0 0.05 0.1 0.15 0.2 0.25 0.3 0.35 0.4
0 2 4 6 8 10
R
e
sp
o
n
se
fact
o
r
concentration (µg/ml)
Linearity
Datafile Name: precision 8.6 3.lcd Sample Name:precision 8.6 3 Sample ID:shesiedo ph 3 B 30 : acn 70
0.0 0.5 1.0 1.5 2.0 2.5 3.0 3.5 4.0 4.5 5.0 5.5 6.0 6.5 7.0 7.5 min
0 10 20 30
mV
Detector A Ch2 247nm
In
te
rn
a
l
s
ta
n
d
a
rd
E
fa
v
ir
e
n
Fig. 14: Spiked drug and internal standard in serum
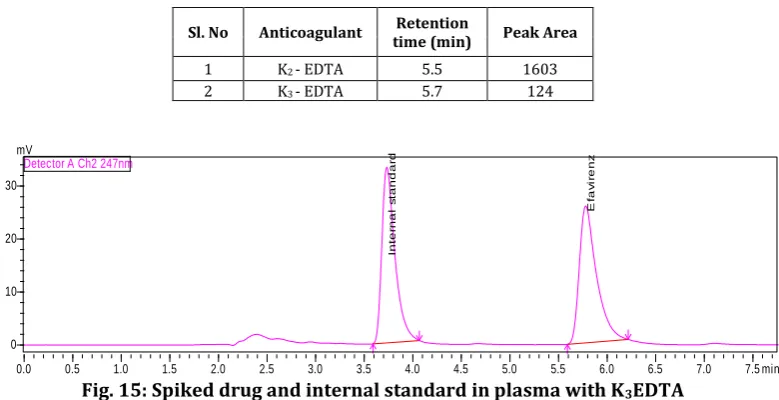
Anticoagulant Effect
Fig. 15: Spiked drug and internal standard in plasma with K3EDTA
Fig. 16: Spiked drug and internal standard in plasma with K4EDTA Sample ID:shesiedo ph 3 B 30 : acn 70
0.0 0.5 1.0 1.5 2.0 2.5 3.0 3.5 4.0 4.5 5.0 5.5 6.0 6.5 7.0 min
0 5 10 15 20 mV
Detector A Ch2 247nm
In
te
rn
a
l
s
ta
n
d
a
rd
E
fa
v
ir
e
n
z
Datafile Name: precision 8.6 3.lcd Sample Name:precision 8.6 3 Sample ID:shesiedo ph 3 B 30 : acn 70
0.0 0.5 1.0 1.5 2.0 2.5 3.0 3.5 4.0 4.5 5.0 5.5 6.0 6.5 7.0 7.5 min
0 10 20 30 mV
Detector A Ch2 247nm
In
te
rn
a
l
s
ta
n
d
a
rd
E
fa
v
ir
e
n
z
Datafile Name: efavirenz trail 2.lcd Sample Name: efavirenz trail 2 Sample ID:shesiedo ph3. B 70: M 30
0.0 2.5 5.0 7.5 10.0 12.5 15.0 17.5 min
-2 -1 0 1
mV
Detector A Ch2 247nm
Sl. No Anticoagulant time (min) Retention Peak Area
1 K2 - EDTA 5.5 1603
Observation
The chromatogram with K2EDTA is good when
compared with K3EDTA. K3EDTA showed much
interferences and negative peaks. The system suitability parameters were also poor for K3EDTA.
CONCLUSION
The proposed method was found to be simple, precise, accurate and rapid for determination of Efavirenz in Human Plasma. The mobile phase is simple to prepare and economical. The method was validated as per USFDA guidelines, and validation acceptance criteria were met in all cases. In summary, the RP-HPLC method described in this work are reproducible, specific and sensitive enough for the selective and reliable determination of molecules in human plasma for routine bioequivalence and pharmacokinetic analysis and were validated in the specified ranges according to internationally accepted criteria. The sensitivity of the method was high as the limit of detection and limit of quantification are very low.
The selectivity and specificity of the method is good as there were no interferences or plasma peaks at the retention times of the drug. The linearity was done according to Cmax with eight non-zero standards. Linearity was established with good regression coefficient and slope. The accuracy and precision data gives a result, which were within the acceptance limits. Consistent recoveries were observed. The method is
specific in the presence of different
anticoagulants [CPDA and EDTA] and matrices collected from different sources. The desired sensitivity was achieved with an LLOQ, which has within-batch and between-batch coefficients of variance [CVs], respectively.
Use of rapid extraction, chromatographic separation, makes them attractive procedures in high-throughput bioanalysis of analytes. The method is applied successfully to analysis and quantification of concentrations of analytes in plasma samples obtained for pharmacokinetic, bioavailability or bioequivalence studies after therapeutic doses. However further studies needed in the pharmaceutical field to build up more sophisticated bioanalytical assay methods for the quantification of drug in human biological matrix. i.e., serum, tissue and urine.
REFERENCES
1. Martindale, The Complete Drug
Reference, 34th Edn, pharmaceutical
press. 2005;632.
2. The Merck Index, 13th Edn., Merck Research Laboratories, Merck & Co., White House Station, NJ, USA. 2001;621.
3. Wilson and Gisvolds. Text book of organic medicinal and pharmaceutical chemistry, 11th Edn, Lippincott-Williams & Wilkins, Philadelphia. U.S.A. 2004;383.
4. Sharma HL and Sharma KK. Principles of pharmacology, 2nd Edn, Paras’s medical publishers, Delhi. 2012;791.
5. Anand Kumar Y and Rama Rao N.
Development of Rapid UV
Spectrophotometric method for the
Estimation of Efavirenz in
Formulations. E-J Chem. 2010;7(3): 856-860.
6. Bhaskar Reddy M, Chagam Reddy and Subbareddy GV. UV-Spectrophotmetric method for estimation of efavirenz in bulk and tablet dosage form. Int J Pharm Sci Res. 2012;3(12):5033-5037.
7. Manikanta Kumar A, Naga Sandhya B, Mahesh Nasare, Prasad VVLN and
Prakash VD. Development and
validation of UV Spectrophotometric method for simultaneous estimation of Lamivudine and Efavirenz in the Pharmaceutical dosage form. AJPTR. 2012;2(6):2249-3387.
8. Hamrapurkar P, Phale M and Shah N. Quantitative Estimation of Efavirenz by
High Performance Thin Layer
Chromatography. J Young Pharmacists. 2009;1(4):359-363.
9. Chaitanya M, Swathi K, raju PN and Swathi K. Method Development and Validation of Efavirenz by RP- HPLC Method. Int J Pharma Res Health Sci. 2015;3(3):763-768.
10. Bhargavi D, Babu Rao B, Kiran G, Gouthami T and Bakshi V. Method Development and Validation for Related Impurities of Efavirenz by RP-HPLC Method, J Anal Chem. 2017;7(5):737-747.
11. Padmaja M, Prashanth KN and Suresh
Kumar JN. RP-HPLC method
development and validation for
simultaneous estimation of efavirenz, lamivudine and zidovudine in tablet
dosage form. J Bio Innov.
2017;6(2):287-305
12. Sandhya BN, Manikanta Kumar A,
Mahesh N, Vijay Kumar P, Satish J and Prakash V. RP-HPLC method for simultaneous estimation of lamivudine,
didanosine and efavirenz in
13. palavan C, Ramaprasad LA, Srinivasu P and Seshagiri Rao JVLN. A New RP-HPLC method for the Simultaneous Estimation of Emtricitabine, Efavirenz and Tenofovir in Tablet Dosage forms. AJPTR. 2013;3(4):2249-3387.
14. Anandakumar K, Abirami G, Murugan S
and Ashok B. RP-HPLC Method for
Simultaneous Estimation of
Lamivudine, Tenofovir Disoproxil
Fumarate and Efavirenz in Tablet
Formulation. J Anal Chem.
2012;68(9):815-821.
15. Manikanta Kumar A, Naga Sandhya B, Mahesh N, Prasad VVLN and Prakash VD. Development and Validation of
RP-HPLC method for simultaneous
estimation of Lamivudine and Efavirenz in the Pharmaceutical Dosage Form. J
Adv PharmA Edu and Res.
2012;2(4):232-238.
16. Venkat Reddiah CH, Rama Devi P,
Mukkanti K and Srinivasu P.
Development and Validation of Stability
Indicating HPLC Method for
Combination Tablet Dosage Form of Efavirenz, Lamivudine and Tenofovir in Tablet. Int J Pharma and Phytopharma Res. 2012;2(1):40-45.
17. Rathnakar N, Srinivasa Rao S, Subhas S, Sunkara N and Rama Mohan Gupta V. Stability indicating RP-HPLC method
development and validation of
efavirenz in bulk and pharmaceutical dosage form. Int J Pharma and Bio Sci. 2017;7(2):223-229.
18. Varma PSRCHNP and Lakshmana Rao A.
Stability-Indicating RP-HPLC method for the simultaneous Estimation of Efavirenz, Tenofovir and Emtricitabine in Pharmaceutical Formulations. Indian
J Pharma and Pharmacol.
2014;1(1):2393- 9087
19. Sreekanth N, Jane TJ, Ishwar B and Kishore raju V. A stability indicating
RP-HPLC method for simultaneous
estimation of Emtricitabine, Tenofovir disoproxil fumerate and Efavirenz in pharmaceutical dosage forms. Int J Res Phrm Sci. 2013;4(3): 391-396.
20. Yin K, Meng X, Dong P, Ding T, Shen L, Zhang L, Zhang R, Cai W and Lu H. A simple, rapid, economical and practical method for the determination of efavirenz in plasma of Chinese AIDS patients by reverse phase high-performance liquid chromatography with ultraviolet detector. BioScience Trends. 2014;8(4):227-234.
21. Ramachandran G, Kumar KA,
Swaminathan S, Venkatesan P,
Kumaraswami V and Greenblatt DJ.
Simple and rapid liquid
chromatography method for
determination of efavirenz in plasma. J Chromatograr B. 2006;(1-2):835. 22. Praveen S, Ganesh S Moorthy, Robert J
and Barrett S. A Sensitive and Selective Liquid Chromatography/Tandem Mass Spectrometry Method for Quantitative Analysis of Efavirenz in Human Plasma. P Lib Sci One. 2013; 8(6): e63305(1-9). 23. Villani P, Regazzi M B, Castelli F, Viale P,
Torti C, Seminari E and Maserati R. Pharmacokinetics of efavirenz (EFV) alone and in combination therapy with nelfinavir (NFV) in HIV-1 infected patients. British j clin pharmacol. 1999;48(5):712-715.