R E S E A R C H
Open Access
Agent-based modeling of competence phenotype
switching in
Bacillus subtilis
Suzy M Stiegelmeyer
1*and Morgan C Giddings
2,3,4* Correspondence: [email protected]
1Syngenta Biotechnology, Inc., 3054 Cornwallis Rd,, Research Triangle Park, NC 27709, USA
Full list of author information is available at the end of the article
Abstract
Background:It is a fascinating phenomenon that in genetically identical bacteria populations ofBacillus subtilis,a distinct DNA uptake phenotype called the
competence phenotype may emerge in 10–20% of the population. Many aspects of
the phenomenon are believed to be due to the variable expression of critical genes: a stochastic occurrence termed“noise”which has made the phenomenon difficult to examine directly by lab experimentation.
Methods:To capture and model noise in this system and further understand the emergence of competence both at the intracellular and culture levels inB. subtilis, we developed a novel multi-scale, agent-based model. At the intracellular level, our model recreates the regulatory network involved in the competence phenotype. At the culture level, we simulated growth conditions, with our multi-scale model providing feedback between the two levels.
Results:Our model predicted three potential sources of genetic“noise”. First, the random spatial arrangement of molecules may influence the manifestation of the competence phenotype. In addition, the evidence suggests that there may be a type of epigenetic heritability to the emergence of competence, influenced by the molecular concentrations of key competence molecules inherited through cell division. Finally, the emergence of competence during the stationary phase may in part be due to the dilution effect of cell division upon protein concentrations.
Conclusions:The competence phenotype was easily translated into an agent-based model–one with the ability to illuminate complex cell behavior. Models such as the one described in this paper can simulate cell behavior that is otherwise
unobservablein vivo, highlighting their potential usefulness as research tools.
Keywords:Agent-based modeling,Bacillus subtilis, Bistable switch, Competence
Background
The competence state exhibited byBacillus subtilisis an example of a bacterial pheno-type driven by changes in gene and protein expression states rather than changes in genotype [1]. Competence is a DNA uptake mechanism that appears to be a cell sur-vival strategy for either procuring new genetic information or obtaining DNA as food. The emergence of competence is correlated with high cell density and nutrient limiting conditions [1]. In those conditions, approximately 10–20% of a B. subtilis population will express the competence phenotype [1]. The mechanism by which a small fraction of the population becomes competent is presently attributed to the variable expression
© 2013 Stiegelmeyer and Giddings; licensee BioMed Central Ltd. This is an Open Access article distributed under the terms of the Creative Commons Attribution License (http://creativecommons.org/licenses/by/2.0), which permits unrestricted use, distribution, and reproduction in any medium, provided the original work is properly cited.
of specific genes, i.e., genetic “noise.” “Noise” in gene expression at present is poorly understood.
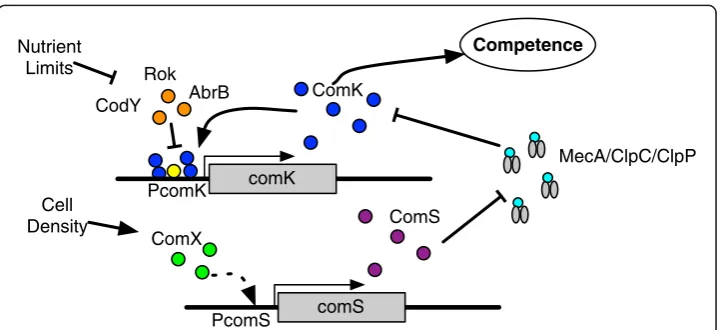
The competence phenotype inB. subtilisis driven by bistable expression of thecomK
transcription factor [2], which is involved in a feedback loop that regulates its own expression and controls the downstream expression of competence genes, as shown in Figure 1. Bistability refers to a mechanism consisting of two stable genetic regula-tory states, in this case ‘ON’ or ‘OFF’ [3-5]. Accumulation of ComK protein (the ON state) enables downstream transcription of the DNA transport genes [6] that lead to the observed competence phenotype. Since comK is a “switch” that drives a key phenotypic state, its expression is highly regulated [7] at both the transcript and protein levels (Figure 1). The ability of a bistable switch to transition from one state to another seems to be governed by random variations in biochemical reactions [2,8,9], as we see here with the variable expression of competence regulatory genes.
Stochastic intracellular molecular interactions and environmental inputs like chan-ging nutrients and cell density are known to initiate phenotype switching and are sources of noise [3,10-12]. Yet, the precise molecular interactions driving variable gene expression are difficult to capture in a typical laboratory environment. To educate our-selves about the molecular interactions involved in the competence phenotype, and to speculate if simple temporal and spatial molecular interactions also contribute to gen-etic noise, we developed a virtual model of a simplified B. subtiliscell in a cell colony-like environment.
A variety of mathematical modeling methods have been employed in an attempt to understand the nature of the competence switching process [2,13-15]. These models have addressed the stochastic nature of competence by modeling noise in the system with varying degrees of specificity, using pre-defined noise terms and the Gillespie stochastic modeling algorithm [16]. However, to model noise, a stochastic process, we
comS ComX
ComS
PcomS
MecA/ClpC/ClpP Competence
comK PcomK
ComK AbrB
CodY Rok Nutrient
Limits
Cell Density
felt that employing a modeling technique that is itself inherently stochastic may offer additional insights about the nature of competence.
We decided to employ an alternative modeling technique – agent-based modeling (ABM). We hypothesized that the randomly interacting agents of an ABM would be suitable for modeling the genetic noise observed in the competence switch. In our ABM, agents simulate large molecules like proteins, RNAs, and DNAs. Agents interact with each other and their environment based on a set of well-defined rules, either literature-based or biologically intuitive.
Recently, ABMs have been used with great success to model phenomena in bacteri-ology such as biofilm development [17-21], the transmission dynamics of antibiotic resistance [22], and antibiotic resistance mechanisms in Staphylococcus aureus [23]. We recently reported the use of ABMs as applied to the chemotactic switching sys-tem inEscherichia coli[24].
Here we report the ABM we designed to mimic the B. subtilis competence pheno-type. The model was tuned to simulate a colony ofB. subtiliscells where competence emerged in 10–20% of the population. We make the following observations and predic-tions about genetic “noise”: a) random spatial-temporal interactions lead to competence, b) daughter cells which inherit portions of the competence machinery are more likely to exhibit the competence phenotype, and c) dilution events like cell division inhibit competence emergence until stationary phase. The resulting model’s source code is openly available for exploration at http://www.giddingslab.org/software, for use with the open-source modeling platform Repast Simphony version 1.2 [25].
Model implementation
Modeling environment and overview
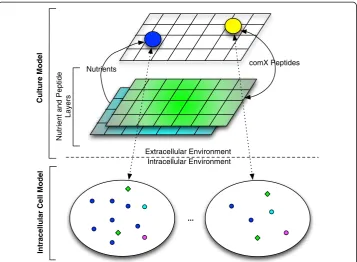
A multi-scale ABM mimicking the biology of the competence switch was developed using Repast Simphony version 1.2 [25], a Java based, open-source, ABM framework that facilitates model development. Figure 2 gives a conceptual overview of the model. The bottom layer of the model, the intracellular model, is an ABM of theB. subtiliscell simulating the intracellular competence regulatory network in a 3-D environment fo-cused on the regulation and production of ComK and ComS proteins (Figure 1). At the top layer of the model, the culture model, theB. subtiliscell ABM acts as an agent in this layer simulating bacterial chemotaxis, cell division and death, nutrient consump-tion, and ComX peptide consumption and production. The nutrient layers depicted in the figure demonstrate the nutrient and ComX peptide simulation in the 2-D grid en-vironment of the culture model. Essentially, we have built an ABM-within-ABM, where the ABM of the bottom layer is an agent in the top layer.
At simulation start, agents were randomly placed in a grid-like environment. Agents can only occupy one cell in the grid at a time and their movement is limited to neigh-boring adjacent cell locations. Agents interact with the grid environment or other agents by stochastically executing rules (Table 1).
Time in the model was represented as discrete updates to the state of all agents in the model. A time step was completed when all agent rules had been attempted in a random order. Rules for both the cellular and intracellular models are handled in this manner, keeping both models on the same time scale.
Nutrients and the comX peptide were mathematically modeled using diffusion equa-tions adapted to the ABM environment (Figure 2). The model uses continuous equaequa-tions due to the high concentrations of nutrients and eventual comX. Concentrations are moni-tored in each cell of the grid environment and diffusion to adjacent cells is calculated by the equations described below.
...
comX Peptides
Intracellular Cell Model
Nutrient and Peptide
Layers
Culture Model
Intracellular Environment Extracellular Environment Nutrients
Figure 2Multi-scale ABM of competence.This is a bottom-up ABM. The bottom layer represents the intracellular ABM implementing the competence network, while the upper layer represents the cell culture environment. The two colored layers in the cell culture environment represent the ComX quorum-sensing pheromone and nutrient layers from which cell agents (blue and yellow) consume molecules. The yellow cell agent indicates a cell exhibiting competence.
Table 1 Agents, the rules they execute, and the agents they interact with
Agent Rules Interacts with
Promoter transcription ComK, ComX, DegU, Repressor
Repressor move, bind Promoter
Ribosome move, bind, translation mRNA
mRNA move, death Ribosome
ComK move, bind Promoter, ComK, MecA
ComS move MecA
ComX move, bind Promoter
DegU move, bind Promoter
MecA move, bind ComK, ComS, ClpC/ClpP
ClpC/ClpP move, bind, death MecA
Culture Model diffusion Nutrients, ComX Peptides
Cell ABM move, shove, generatePeptide, consumePeptide, consumeNutrients, life, death
Rule execution
In the model, agent movement and interactions with other agents are defined by rules. Rule execution is stochastic and subject to meeting a probability threshold after a ran-dom draw from the uniform distribution (see Parameter Estimation).
For example, if two molecules have been shown to bind biologically with a high affinity, then their interaction probability in the model will be high. Hamoen et al. [26] reported that ComK may bind to another ComK to form a homodimer. This is represented in the model using an interaction probabilityρ(Table 2), with the following rule executed when-ever a ComK finds itself next to another ComK agent, listed asneighborhere:
ifneighbor= ComKthen
random = generate random number between 0 and 1.
ifrandom <ρthen
neighbor now moves with ComK
end if end if
If the probability threshold is not met, then the rule is not executed. The process is repeated at each time step, until eventually the probability threshold is met and the rule is executed.
Parameter estimation
The parameter space is quite large for this model and is divided into three types of param-eter estimates: grid environment size, initial number of agents, and rule interaction prob-abilities. The parameters were estimated using a random sweep parameter estimation technique, where: (1) initial parameter estimates were made based on biological insight (see next paragraph), (2) repeated simulations were then run where parameter values were randomly changed, and (3) final parameter values were determined from simulations which best mimicked experimentally obtained results, as reported by Maamar et al. [2].
Rule probabilities were initially estimated based on known interactions and then fit as simulations were run. For instance, if two molecules had a high affinity, then a high
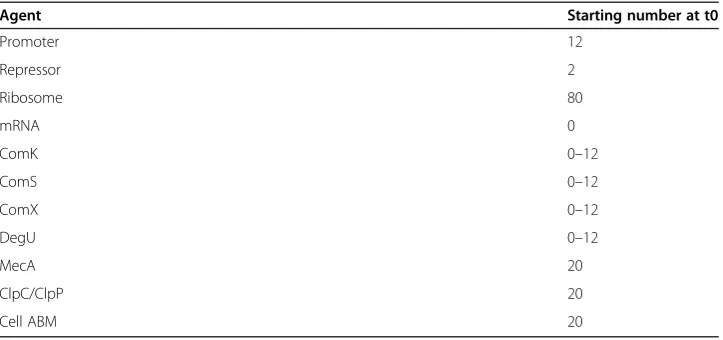
Table 2 Initial agent quantities
Agent Starting number at t0
Promoter 12
Repressor 2
Ribosome 80
mRNA 0
ComK 0–12
ComS 0–12
ComX 0–12
DegU 0–12
MecA 20
ClpC/ClpP 20
Cell ABM 20
probability of interaction (e.g. 0.8) was estimated. For two molecules with a low affinity, a low probability (e.g. 0.2) was estimated. As simulations were run, rule probabilities were increased or decreased to speed up or slow down, respectively, a particular molecular reaction.
Intracellular agent-based model
The intracellular model was designed to closely mimic the biology of the competence regulatory network and is described as follows in terms of the biology. As stated previ-ously, an abundance of ComK triggers the switch of a B. subtilis cell to exhibit the competence phenotype. As such, the model was designed around the regulation of
comK at transcription and post-translation. Agents were translated from the biological model to represent ComK, ComS, DegU and MecA proteins, the ComX peptide, ribo-somes, comKandcomStranscripts, repressors,comKandcomSpromoter sites, and the ClpC/ClpP protease, as shown in Table 1. At startup of the model, a random number of ComK, ComS, ComX, and DegU agents was generated from the value ranges given in Table 2 for these agents. Any exceptions to this are described in Results. The agents interact with one another and their environment in a 3-D grid of 40 × 40 × 40 cells. Each agent’s behavior is defined by a set of rules, summarized in Tables 1 and 3 and de-scribed further below.
ComKtranscription and translation
ComK binds at its own promoter as a tetramer, acting as its own transcription factor [6,26]. Random transcription of comK is a key factor in the build-up of large amounts of ComK, which triggers transcription of the DNA transport (competence) genes [2,27]. DegU binds to the comKpromoter and strongly stimulates binding of ComK dimers to the comK promoter [28,29]. More specifically, DegU binds in between the two ComK dimer binding sites and may possibly facilitate tetramerization of ComK at the comK promoter site by partial unwinding and bending of the DNA helix [29]. Transcription can also occur in the absence of ComK [30]. It is estimated that a cell exhibiting competence has on average 50,000 ComK dimers during stationary phase [2].
To simulate comK transcription in the intracellular model, agents representing ComK, the comK promoter, and DegU are modeled. Binding of ComK agents to the
comK promoter agent is contingent upon what agents, if any, are already bound; in the model, this is reflected in the creation of binding rule probabilities (Table 3) calculated during the parameter estimation process. If no agents are bound to the promoter agent at the time a ComK dimer encounters it, the lowest binding probability is used. If DegU is already bound to the promoter agent, a higher probability of binding is used. Finally, the highest probability is used for binding the second ComK dimer if DegU and an-other ComK dimer are present.
Transcription probabilities follow in a similar fashion (Table 3). Transcription occurs at a very low probability when no ComK is bound –its probability increases with the addition of one or two bound ComK molecules. Activators and repressors (described in
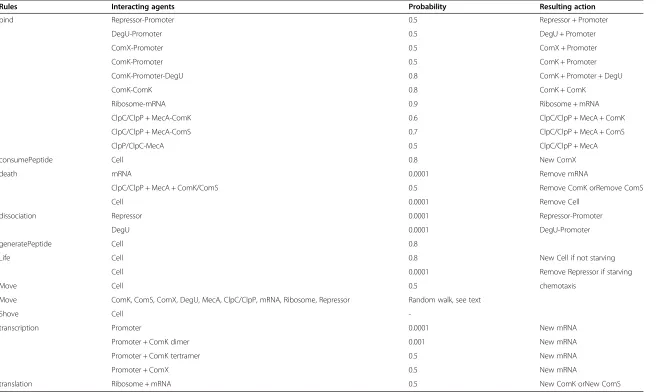
Table 3 Interacting agents, rule execution probabilities, and behavior
Rules Interacting agents Probability Resulting action
bind Repressor-Promoter 0.5 Repressor + Promoter
DegU-Promoter 0.5 DegU + Promoter
ComX-Promoter 0.5 ComX + Promoter
ComK-Promoter 0.5 ComK + Promoter
ComK-Promoter-DegU 0.8 ComK + Promoter + DegU
ComK-ComK 0.8 ComK + ComK
Ribosome-mRNA 0.9 Ribosome + mRNA
ClpC/ClpP + MecA-ComK 0.6 ClpC/ClpP + MecA + ComK
ClpC/ClpP + MecA-ComS 0.7 ClpC/ClpP + MecA + ComS
ClpP/ClpC-MecA 0.5 ClpC/ClpP + MecA
consumePeptide Cell 0.8 New ComX
death mRNA 0.0001 Remove mRNA
ClpC/ClpP + MecA + ComK/ComS 0.5 Remove ComK orRemove ComS
Cell 0.0001 Remove Cell
dissociation Repressor 0.0001 Repressor-Promoter
DegU 0.0001 DegU-Promoter
generatePeptide Cell 0.8
Life Cell 0.8 New Cell if not starving
Cell 0.0001 Remove Repressor if starving
Move Cell 0.5 chemotaxis
Move ComK, ComS, ComX, DegU, MecA, ClpC/ClpP, mRNA, Ribosome, Repressor Random walk, see text
Shove Cell
-transcription Promoter 0.0001 New mRNA
Promoter + ComK dimer 0.001 New mRNA
Promoter + ComK tertramer 0.5 New mRNA
Promoter + ComX 0.5 New mRNA
translation Ribosome + mRNA 0.5 New ComK orNew ComS
Agent-agent represents unbound neighboring agents, while agent + agent represents bound agents moving together.
Stiegelmeye
r
and
Giddings
Theoretical
Biology
and
Medical
Modelling
2013,
10
:23
Page
7
o
f
2
1
http://ww
w.tbiomed
.com/content
persist until it randomly degrades as defined by its “death” rule. Since thecomK tran-script has a strong Shine-Delgarno ribosome initiation sequence, the binding and trans-lation probability of the ribosome agent is very high if it encounters a comKtranscript (Table 3). Therefore, the presence of a single transcript is often enough to lead to the production of several ComK proteins, as reported in Maamar et al. [2].
ComKtranscriptional regulation
At present, there are three known comK transcriptional repressors: Rok, AbrB and CodY. ThecomK promoter site allows simultaneous binding of AbrB and ComK [31]. The presence of AbrB acts to prevent binding of RNA polymerase, as does CodY [32]. In the model, all three repressors are represented by a generic repressor agent that binds to the comK promoter agent. Nutrient limiting conditions down-regulate both AbrB and CodY, thus repressor agents are removed from the model when the cell agent reaches a starvation condition described below. Successful transcription and translation events eventually lead to the build-up of ComK, triggering the feedback loop shown in Figure 1 [2,27].
ComStranscription and regulation
ComS is a protein produced in response to quorum sensing (cell density) [33,34]. Tran-scription ofcomSoccurs in response to the quorum-sensing signaling pathway initiated by the ComX peptide. ComX is produced by the cell at a constant rate during growth and accumulates in the cell medium, reflecting cell density [1,35]. For the purposes of the cell model, ComX is the post-translationally modified and cleaved extracellular end product absorbed by the cell. ComX initiates the activation of several proteins, which in turn initiate transcription ofcomS[1]. The model represents this process by utilizing only a ComX agent. When the ComX agent binds to the comSpromoter,comSis acti-vated. The interaction probability given in Table 3 controls this rule, which represents a simplified version of the actual activation pathway. In reality, ComX is not the actual
comS transcription factor. In addition, regulation of the quorum-sensing pathway is modeled by assuming a repressor agent acts at the comS promoter site, as shown in Table 2.
ComK and ComS post-translational regulation
This system was represented by implementing the interaction probabilities shown in Table 3. Since ComS has a stronger affinity to the adapter protein MecA, a higher bind-ing probability is used for association with ComK durbind-ing execution of the bindbind-ing rule.
Intracellular model rules
Move rule
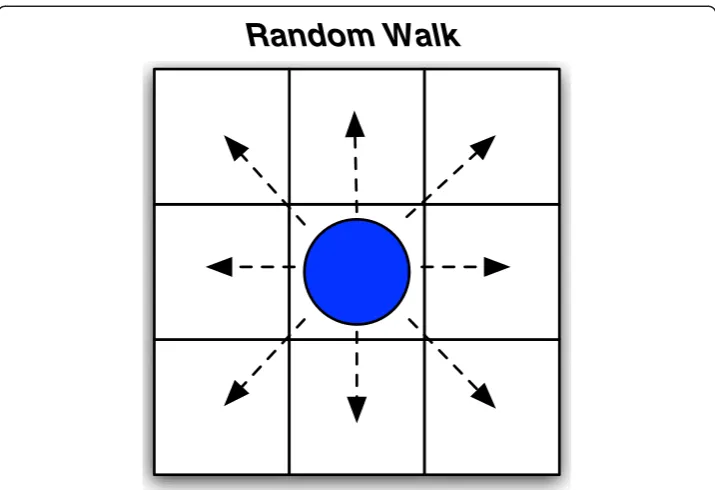
The move rule simulates a random walk of an agent through the 3-D landscape to imitate molecular diffusion and Brownian motion. Each successful execution of the rule results in a one-step move of an agent to a randomly selected neighboring cell on the grid. In the 3-D grid of the intracellular model, there are 26 possible adjacent neighboring cells into which an agent could attempt to move. If the randomly selected cell is occupied, then the agent remains in place.
Bind rule
This rule is used for molecules that bind with other molecules when encountering an-other in a neighboring cell during the course of the random walk. For each agent, the bind rule searches for other agents at adjacent grid positions. When there is an adjacent agent for which a binding rule is defined, the two bind by moving together if the rule probability is met. An exception occurs when a MecA agent already bound to ComK encounters ComS –in this instance, ComK dissociates in favor of ComS. Agents that bind with one another are provided in Table 3 along with their associated rule probabil-ities determined during the parameter estimation process.
Transcription rule
The transcription rule is executed by the promoter agent and results in the production of mRNA agents. The success of this rule depends on what is already bound to the pro-moter agent, to match the biology described above and as specified in Table 3.
Translation rule
The ribosome agent executes the translation rule to generate ComK agents or ComS agents depending on the type of the mRNA agent to which it is bound (Table 3).
Death rule
Both the mRNA and ClpP/ClpC agents implement a death rule. For the mRNA agent, the death rule represents the random degradation of mRNA that occurs in the cell and is executed when unbound. In the case of the ClpP/ClpC protease complex, the death rule initiates the removal/death of the bound ComK or ComS agent. Table 3 lists the rule probabilities.
Culture agent-based model
In the cell culture model, agents interact with one another and their environment in a 2-D grid of 40 × 40 cells. Rules are executed in a random order for each iteration of the model, and probabilities calculated during the parameter estimation process determine whether or not a rule executed, as shown in Table 3.
Cell culture agents
There is technically only one agent type in the cell culture model, a cell ABM whose internal workings are described above. In the culture model, the cell ABM acts as an agent with the rules specified in Table 1. It interacts with its environ-ment by consuming nutrients, and with other cell agents through production and consumption of the ComX pheromone. Nutrients and the ComX peptide are modeled by diffusion equations due to their high concentrations. Due to the way Repast Simphony is structured, the culture plate itself acts as a layer of immobile agents to allow for the execution of the diffusion rule. Consumption of either nutrients or ComX peptides by the cell agent are fed to the internal cell models, leading to the reduction of repressor agents or the increase of ComX agents, respectively. When more than 20 ComK agents were generated, the cell was considered to have reached competence (shown as a change in color in Figure 2). This threshold is an estimated parameter and was set to this small value to limit the consumption of computational resources.
Cell growth equation
The cell agent implements a growth function to control cell growth, division, and death. The growth function is based on the Logistic Map function: mn+1=μmn-μm2n/k, where μ= 0.0058is the growth rate [38], mrepresents the energy of the cell, and kis the maximum energy [39]. mnis the value of the energy function at iterationn. In the culture ABM,m0was initialized to 5 andkwas set to 16. Theμmnterm of the equation signifies an energy gain that occurs when consuming nutrients. The μm2n/kterm signi-fies a decrease in energy, as it is assumed that basic metabolism within the cell con-sumes energy. The calculation of the growth function is split across two rules that are described further below: move and consumeNutrients. The life rule uses the value of the equation to determine whether the cell had accumulated enough energy to divide or not. In the move rule, energy is reduced by μm2n/k. If there are no nutrients at the agent’s location, there is no energy increase.
Once nutrients reach a low level (<1) such that cell agents could no longer consume them, the energy level steadily decreases instead of increasing via the move rule. At this stage, the cell growth equation is altered and energy is reduced by d/(k/2), whered is the death rate,d = 0.002.
Cell culture rules Diffusion rule
Move rule
The cell agent executes a move rule that simulates bacterial chemotaxis so the cell agent moves towards the most favorable nutrient conditions. If nutrients are available, the cell agent remains at its location. If not, the cell agent randomly selects a free neighboring location with a higher concentration of nutrients. The energy reduction portion of the cell growth equation is implemented when this rule is executed due to the assumption that there is a metabolic cost to a cell’s energy at each iteration.
The move rule also determines when nutrients can no longer be consumed at the cell agent’s current location, and thus disables repressor agents within the cell ABM. A ran-domly selected repressor agent is removed from the model if a probability threshold (0.001) determined during the parameter estimation process is met.
Consumption rules
The consumePeptide and consumeNutrients rules cause the consumption of one molecule from the grid location of the cell agent. When a ComX peptide is con-sumed, it is added as an agent to the cell ABM. When a nutrient is concon-sumed, a gain in energy occurs, as described above. The consumeNutrient rule is executed at every iteration, while the consumePeptide rule is executed every 50 iterations, if a probabil-ity of 0.8 is met.
GeneratePeptide rule
The generatePeptide rule produces one molecule of the ComX peptide, which is added to the concentration at the current grid location. This rule is an approximation of the constant production of the ComX peptide described in the literature [1]. Unlike the other rules, the generatePeptide rule is executed every 100 iterations and a ComX pep-tide is generated with a probability of 0.8. This number of iterations was selected dur-ing the parameter estimation process to ensure a gradual production of the peptide. The ComX peptides produced in this manner are independent of the ComX agents residing within the cell ABM agent.
Life rule
The life rule determines whether the cell is ready to divide when the energy exceeds a predefined threshold of 15, which is one fewer than k, the maximum energy (see growth equation parameters above). Cells that exhibit the competence state do not divide. During the division process, a new cell ABM is created and added to the grid in a neighboring, adjacent grid location. The daughter cell receives half the energy of the parent cell, thereby reducing the parent’s energy by half. The daughter cell will follow intracellular model startup and agent initialization as described in previous sections and in Table 2. However, some of the initial agent quantities are handled differently.
To model inheritance, an arbitrary plane is randomly chosen which bisects the parent cell ABM through its center. ComK, ComS, ComX and mRNA agents‘above’the plane remain in the parent cell and agents ‘below’ the plane become a part of the daughter cell. The daughter cell is then placed in a randomly selected grid location adjacent to the parent cell. If that location is occupied, then the shove rule is executed. The simula-tion assures that the associated genes (promoter agents) are equally distributed between mother and daughter to represent the non-stochastic genome segregation in real cells.
The life rule is also responsible for determining the death of a cell agent. The effect of this rule is shown during the death phase of the bacterial growth curve. If the cell agent’s energy becomes very low (< 0.5) and the probability threshold of 0.0001 is met, then the cell agent‘dies’and is removed from the model.
Shove rule
The shove rule is intended to displace cell agents one step to an adjacent, randomly selected, neighboring position if more than one cell agent occupies its current location. As each agent executes this rule, a one step displacement of cell agents ripples through a group of adjacent cell agents until there is room for all cell agents in the culture model grid.
Death rule
This rule models the random die-off of cells with a high metabolism when nutrients become insufficient. This rule is responsible for the slight dip observed in the growth curve during stationary phase, Figure 3a. The death rule executed every 50 iterations instead of every iteration to limit the death rate. The cell agent ‘dies’when a probability threshold of 0.0001 is met and when the cell’s energy is within 0.5–7.5 (half the energy threshold needed for division).
Results
Intracellular model
To predict possible mechanisms of the noise that drives competence expression, we developed a 3-D intracellular ABM to represent the key molecular players in
1 2 3 4
a
b
c
Growth CurveAll Cells Competent
0 10000 20000 30000 40000
Time (Iterations)
0
800
600
400
200
Cell Count
competence switching inB. subtilis, and to mimic their interactions (Figure 1). In the ABM, we explicitly represented proteins, genes, transcripts, and ribosomes as agents that could move and interact in a simulated cellular environment. To realistically model the bottom-up behavior of the system, the model included the transcription and translation of genes to proteins. Agent movement was based on Brownian motion simulated by a random walk (Figure 4). When agents encountered other agents in a simulation, they interacted stochastically according to behaviors defined by rules discussed in the Model Implementation section (Tables 1, 2, 3). As it is known that proteins can localize to specific areas within a bacteria cell [41], the bacteria cell model represents the portion of the cell where the DNA localizes. We assumed for the pur-poses of this model that the proteins of interest diffused randomly in this region until captured by a protease or bound as a transcription factor. We also assume that the volume of this region remains constant. The experiment began with an initial run of 20 intracellular models to reduce the consumption of computational resources.
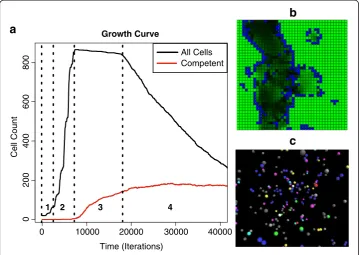
At model start-up, agents were placed at random locations within the simulated 3-D grid environment, Figure 3c. Several simulations were run to assess outcomes given dif-ferent initial configurations.
Cell culture level modeling
One goal of the study was to leverage the intracellular model into a multi-scale model of cell culture level interactions, to examine the effects of signaling and competition for nutrients on the outcome of competence. The cell-level model consisted of whole cell agents representing a cell’s interaction with external environmental factors such as nutrients and the quorum-sensing pheromone ComX. Agents were placed randomly
Random Walk
Figure 4Agent movement follows random walk.Movement of agents based on Brownian motion and simulated by a random walk. An agent will randomly select an adjacent cell and move to that
new location.
in a 2-D grid environment (Figure 3b), much like the random placement of agents in the 3-D intracellular tier (Figure 3c).
In this multi-scale model, external environmental conditions influenced the intracel-lular conditions and cell-level outcomes, and intracelintracel-lular conditions fed back upon the environment and other agents within it. For all multi-scale simulations, the initial intra-cellular model quantities of ComK, ComS, and ComX agents were randomly deter-mined from thresholds as explained in Model Implementation. There were no comK
mRNA agents placed at the start of a model run, but these agents were randomly gen-erated via transcription during a simulation.
Competence
Successful execution of transcription and translation rules eventually led to the build-up of ComK, triggering the feedback loop shown in Figure 1 [2,27]. As competition between ComK and ComS proteins is vital in determining the competence state, their production was monitored. Considerably fewer molecules were used in the simula-tions compared to actual biology [42] due to limitasimula-tions in computational resources. As a result, a cell was considered to be in the competence state when it had more than 20 ComK proteins–a value determined during the parameter search stage that met the 10–20% competent cells criterion. In reality, approximately 50,000 ComK dimers have been observed in a competent cell [2].
Competence outcome at the intracellular level: the impact of random spatial-temporal agent arrangement
Initial simulations of the intracellular model were run repeatedly outside of the full model environment to test if spatial arrangement of molecules might contribute to the resulting competence state. Intracellular model simulations were run with identical pa-rameters and concentrations of agents (Table 2, maximum values for ComK, ComS,
a
b
4000 6000 8000 1000012000 2000
Time (Iterations)
0 2000 4000 6000 8000 1000012000
Time (Iterations) 0
Proteins
ComS ComK
Proteins
ComS ComK
Protein Counts
0
5
0
100
150
Protein Counts
0
5
0
100
150
ComX and DegU were used in these simulations), the sole difference between each run being the random spatial placement of the agents before the simulation started. We ran the simulation 100 times to obtain statistics regarding the overall rate of competence emergence.
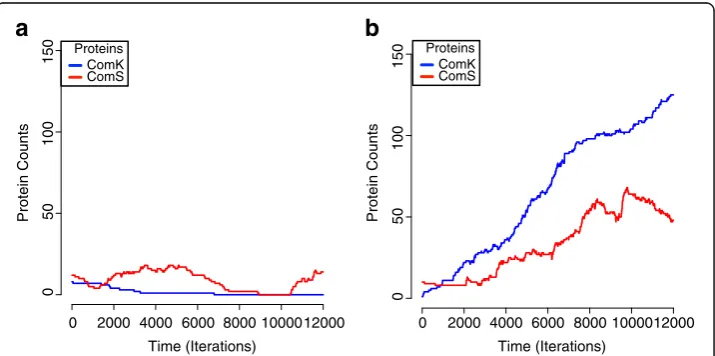
Figure 5a and b show the ComK and ComS population sizes through time in two separate runs of intracellular simulations. Figure 5a shows a system that remained non-competent and Figure 5b shows a system that reached the competence state. Notably, the two simulations resulted in different outcomes for both the ComK and ComS proteins.
We repeatedly observed that simulations with identical initial parameters and population sizes resulted in significantly different outcomes, suggesting that the initial arrangement of molecules indeed has a strong impact on competence expression. Given the parameter settings, the over-production of ComK was observed in approximately 3–5 out of 100 simulations (Figure 5b) and the production of ComK outpaced repressor protein activity [43]. Though 3–5% is a lower rate of competence expression than the 10–20% that is typically seen in the bacteria, the model was run without explicit simulation of cell growth, division, or starvation conditions that influence a higher density of compe-tence emergence.
Another outcome of the simulations was that the chance encounter of a singlecomK
mRNA transcript with a ribosome before it was degraded would produce a ComK pro-tein. This agrees with prior in vivo results indicating that an increased probability of competence switching can be driven by fluctuation of the ComK protein by a few ComK mRNA molecules [2]. On average, one mRNA was observed at any given time in the model comparied to > 20 during growth phase and on average 1 mRNA during stationary phasein vivo[2]. So cell fate in the ABM was determined simply by the loca-tion of the molecule and its chance encounter with a ribosome. These results provide evidence that a random, spatial arrangement of molecules may be a major contributor to the variable comK gene expression (noise) underlying the competence phenotype, and could lead to experiments that further decode the enigma of competence expression.
Competence outcome at the cell culture level: the impact of nutrient limitation
It has been previously shown that nutrient limitation and cell culture density increase the propensity ofB. subtiliscells to enter the competence state [1]. In our intracellular model, only a small fraction of the simulations ended in the competence state since the model did not include limitations comparable to real-life conditions. However, within actual cell cultures, once stationary phase is reached and nutrients become limited, a much higher fraction of cells emerge with the competence phenotype - as many as 20%. We sought to determine what bottom-up assumptions drove this number by run-ning simulations of the complete model – intracellular ABMs acting as agents in the culture model.
At each simulation run, the culture model was seeded with 20 intracellular ABMs placed in random locations in the 2-D grid environment. Each of the 20 initial intracel-lular models began with quantities of ComK, ComS, ComX, and DegU determined by a random draw from a uniform distribution from within a defined threshold, and with 0 mRNA agents. Cells grew and divided, with division resulting in a random partitioning of molecular contents among the progeny. All cells were tracked throughout the
simulation, and progeny progressed from 20 initial cells to a maximum of 877 cells in one simulation, with 137 (15.6%) showing competence at simulation termination.
Since individual simulations would often result in distinct outcomes, we ran the model repeatedly to obtain average statistics for competence-switching behavior. In six simulations, the initial seed of 20 randomly placed cells produced an average of 867 cells. We limited the available “plate size”and nutrient concentration for culture growth to limit the computing to feasible time spans. For each of the cells produced, a complete intracellular model was running, which meant that a full simulation running on a fast desktop computer took approximately two months or more to complete. Improved paral-lelism will reduce run times in the future.
Figure 3a shows the growth curve for an example multi-scale simulation, with the resulting count of competent cells as they switched to the competence phenotype. As with all of the simulations, it resulted in a classic bacterial growth curve with the stand-ard phases of bacterial culture: lag phase, exponential growth phase, stationary phase, and death phase (see Additional file 1 for a movie of lag through stationary phase). The simulations also demonstrated an emergence of competence comparable to actual bac-terial cultures: an average of 16.3% competent cells emerged in our simulations by the end of stationary phase, in line with stationary growth phase in vitro rates of 10–20% [1]. After cell division ceased due to nutrient limitation, comK transcripts and protein quantities increased the likelihood of competence transition. Execution halted within the death phase of the growth curve after approximately 43,000 iterations.
Competence outcome at the cell culture level: epigenetic heritability
Nutrient limitation and cell density does not, however, explain why those particular 10–20% of cells that express competence do so. Following from the result showing that initial spatial distribution of molecules may affect the outcome of the intracellular model, we postulated that some level of epigenetic heritability might exist in compe-tence switching. The rationale is that if a parent cell has an increased quantity of ComK compared to the average, it might be expected that as the cell divides, the resulting pro-geny may also have elevated ComK levels. Evidence for this type of heritability in the biological system was presented by Veening et al. [44]. The precursor to competence – accumulation of ComK – may lead to an earlier switch than would occur by random chance alone, a result which would be clearly identifiable in our cell culture model.
statistically significant (p < 0.0001), leading us to believe that inheritance contributes to the emergence of competence. This result was consistent from simulation to simulation.
Discussion
Our interest in phenotype switching derives from studies of antimicrobial-tolerant bacterial phenotypes [46]. These are non-inherited phenotypes that confer tolerance towards many known antibiotic drugs. In bacterial populations, cells exhibiting tolerant phenotypes exist as a small fraction of the population, with the quantity determined in part by growth conditions. For example, stationary phase growth induces an increase in the fraction of phenotypically drug-tolerant cells [47]. However, at the present time, little is known about the mechanisms underlying antimicrobial tolerance in bacteria. So, to explore mechanisms that could explain variable gene expression and to further our
3/0 2/0 1/0 5/1 1/0 1/0 0/0 0/0 0/0 0/0 0/0 0/0 0/0 0/0 0/0 0/0 0/0 0/0 0/0 0/0 0/0 0/0 0/0 0/0 0/0 0/0 0/0 0/0 0/0 0/0 0/0 0/0 0/0 2/0 1/0 0/0 0/0 0/0 0/0 0/0 0/0 0/0 0/0 0/0 0/0 0/0 0/0 0/0 0/1 1/0 0/0 0/0 0/0 0/0 0/0 0/0 0/0 0/0 0/0 0/0 0/0 0/0 0/0 0/0 0/0 0/0 0/0 0/0 0/0 0/0 0/0 0/0
0 5000 10000 15000 20000
Time (Iterations)
Not Competent Competent x/y Protein/mRNA
Figure 6Inheritance during cell division.The numbers within the squares indicate actual quantities of
comKtranscripts and ComK proteins. Filled squares indicate the daughter cells that eventually exhibited the competence phenotype, and branch lengths reflect the time (in iterations) until competence was exhibited. Branch lengths of non-competent cells (unfilled squares) were artificially lengthened to make room for the labels; otherwise they would be of zero length. Cells that inherited quantities of ComK proteins and transcripts, combined with intracellular stochasticity, exhibited competence prior to cells that did not acquire ComK. The tree is drawn using R [45] from data captured from the simulation after formatting in Newick tree format.
knowledge of phenotypic bistable switching, we turned to competence switching in
B. subtilis, where the key molecular players are known and well-studied.
Our B. subtilis ABM is a reduced scale model tuned to reflect the bacteria biology and the competence phenotype. Through the Cell Growth Equation (see Model Imple-mentation section) the model closely approximates bacterial growth curves. In addition, cells only turned competent in bulk once stationary phase was entered. Although quan-tities of molecular agents modeled were a small fraction of the molecules in a live sys-tem, the model was able to approximate a real system. We have found similar results in a separate effort modeling chemotaxis inE. coliwith an ABM, where preserving bio-logical ratios of molecules was more important than preserving absolute quantities to produce biologically realistic results [24]. However, in the case of this model we found that chance, random interactions between agents had the most effect on the behavior of the model.
In our model, spatial-temporal interactions –not molecular quantities or agent rule execution probabilities – may be the key contributor to the emergence of the compe-tence phenotype, as transcription and translation occur due to chance encounters by the molecules involved. Though it is not yet possible to verify these simulationsin vivo, the biological system likely shares similar properties where the apparent randomness of the competence transitions is derived directly from the randomness of spatial distribu-tion in competence-related molecules. Noise in a biological system is typically thought of as a series of events, but our results show it is possible that random spatial arrange-ment of competence-determining molecules may be its major contributing factor.
In addition to random spatial arrangements, random encounters between key agents also appeared to be important in the emergence of competence. It is interesting to note that changing the quantities of the initial number of agents in the model had more of an effect on the model outcome than the rule probabilities themselves. If there are greater numbers of an agent, then there is a higher chance for encounters between agents to occur. During the parameter estimation process, it was observed that changes in the probability values did not greatly impact model outcomes, although higher prob-abilities did speed up certain reactions (e.g. translation), which resulted in the produc-tion of more agents. This seems logical considering that the rule probabilities do not come into effect until two agents encounter one another, which can occur more fre-quently as the quantities of agents increase. If there are a large number of agents, there are more chances for them to encounter one another. As parameters have been reported to lack sensitivity in many biological models [48], our parameterization method is somewhat un-formalized as we focused more on looking for biological inter-pretations of our model after it had reached a life-like representation of the compe-tence switch.
The cell division trees that monitored quantities of ComK displayed an obvious pat-tern of inheritance. Cells that inherited higher amounts of ComK transcripts and pro-teins from the parent cell tended to, in turn, pass on higher quantities to their children cells. However, the model also suggests what may be a basic but important facet of the emergence of competence: that dilution of competence-determining molecules during cell division may act to regulate the emergence of competence. Except for the lineages that switched to the competent state early due to inheriting elevated levels of theComK
repressor agents inhibited cell division long enough for sufficient quantities of ComK
agents to accumulate. The quantities of molecules inherited in this pathway acted in an epigenetic fashion upon subsequent phenotypic outcomes. This explains why competence inB. subtilistypically emerges during stationary phase when nutrients are limited, due to build-up of elements likeComKin the competence gene regulatory network.
The model may therefore reveal an important feature of how the growth stage regu-lates competence by diluting the mRNA and proteins essential to switching to the com-petent state. Although we have not verified this experimentally, Roostalu et al. [49] reported fluctuations in a reporter protein after cell division that supports the theory that cell division acts as a dilution event for the competence phenotype. During expo-nential growth phase, not enough time would pass between cell divisions to allow
ComK to build up to sufficient levels, so competence would not occur. While we can-not know whether this is the complete explanation for how competence is limited to stationary phase inB. subtiliscultures, it appears to be a sufficient explanation to guide further experiments.
Conclusions
This study suffers from the same limitations as any model-based research, in that all models are only representationsof a biological system. Nevertheless, the design of the model facilitates a thought experiment to represent and clarify the workings behind very complex cell behavior. This discrete model of the competence phenotype provides a readily comprehensible view into each cell’s behavior and provides the ability to monitor the variation of molecular concentrations involved in regulating competence. The resulting model is biologically intuitive, with ready translation from biological facts or hypotheses into the model and back. As we used this model to educate ourselves on the mechanisms of the competence phenotype, we see great potential in ABMs as educational tools in the future because they are straightforward to build, visualize, and comprehend.
Additional file
Additional file 1:Movie of Cell Culture Model.This movie shows the cell culture ABM initially seeded with 20 cells (blue). Green indicates nutrient-rich cells. Cells grow and divide as they consume nutrients. The formerly nutrient-rich cells darken as nutrient concentrations decrease. Cells move following the nutrient gradient as nutrients are depleted. When cells die, nutrients are released into the environment. The movie halts during stationary phase.
Competing interests
The authors declare that they have no competing interests.
Authors’contributions
SMS carried out the design and testing of the model, interpreted the results, and drafted the manuscript. MCG participated in study design and coordination and helped draft the manuscript. Both authors read and approved the final manuscript.
Acknowledgements
We thank Wendy Spitzer and Ashley Lundqvist who provided technical writing services. We also wish to thank Jameson Miller and Miles Parker for sharing their agent-based modeling skill sets, as well as Dr. Kevin Ramkissoon and Dr. Hsun-Cheng Su for fruitful discussions about bacterial growth curves. We thank the members of the Repast-Interest mailing list for their support of the Repast Simphony platform.
A portion of this work was supported by F31DE019594 from the National Institute of Dental & Craniofacial Research to SMS. This work was also supported by NIH R01RR020823 to MCG. The funders had no role in study design, data collection and analysis, decision to publish, or preparation of the manuscript. The content is solely the responsibility of
the authors and does not necessarily represent the official views of the National Institute of Dental & Craniofacial Research, the National Center for Research Resources, or the National Institutes of Health.
Author details
1Syngenta Biotechnology, Inc., 3054 Cornwallis Rd,, Research Triangle Park, NC 27709, USA.2MYS, LLC, 202N 9th St, Suite 303A, Boise, ID 83702, USA.3Formerly: College of Arts and Sciences, Boise State University, Boise, ID 83725, USA. 4Department of Biochemistry & Biophysics, University of North Carolina at Chapel Hill, Chapel Hill, NC 27599, USA.
Received: 9 November 2012 Accepted: 21 March 2013 Published: 3 April 2013
References
1. Draskovic I, Dubnau D,et al:Competence for genetic transformation. InThe dynamic bacterial genome. Volume 8.
Edited by Mullany P. Cambridge, UK; New York: Cambridge University Press; 2005:235–273.
2. Maamar H, Raj A, Dubnau D:Noise in Gene Expression Determines Cell Fate in Bacillus subtilis.Science2007, 317(5837):526–529.
3. Henderson IR, Owen P, Nataro JP:Molecular switches: the ON and OFF of bacterial phase variation.Mol Microbiol
1999,33(5):919–932.
4. Dubnau D, Losick R:Bistability in bacteria.Mol Microbiol2006,61(3):564–572.
5. Webb JS, Lau M, Kjelleberg S:Bacteriophage and Phenotypic Variation in Pseudomonas aeruginosa Biofilm Development.J Bacteriol2004,186(23):8066–8073.
6. van Sinderen D, Luttinger A, Kong L, Dubnau D, Venema G:Hamoen L: comK encodes the competence transcription factor, the key regulatory protein for competence development in Bacillus subtilis.Mol Microbiol
1995,15(3):455–462.
7. Hamoen LW, Venema G, Kuipers OP:Controlling competence in Bacillus subtilis: shared use of regulators. Microbiology2003,149(1):9–17.
8. Maughan H, Nicholson WL:Stochastic Processes Influence Stationary-Phase Decisions in Bacillus subtilis.J Bacteriol
2004,186(7):2212–2214.
9. Veening J, Smits W, Kuipers O:Bistability, Epigenetics, and Bet-Hedging in Bacteria.Annu Rev Microbiol2008, 62:193–210.
10. Drenkard E, Ausubel FM:Pseudomonas biofilm formation and antibiotic resistance are linked to phenotypic variation.Nature2002,416(6882):740–743.
11. Kaern M, Elston TC, Blake WJ, Collins JJ:Stochasticity in gene expression: from theories to phenotypes.Nat Rev Genet2005,6(6):451–464.
12. Smits W, Kuipers O, Veening J:Phenotypic variation in bacteria: the role of feedback regulation.Nat Rev Micro
2006,4(4):259–271.
13. Süel G, Garcia-Ojalvo J, Liberman L, Elowitz M:An excitable gene regulatory circuit induces transient cellular differentiation.Nature2006,440(7083):545–550.
14. Süel G, Kulkarni RP, Dworkin J, Garcia-Ojalvo J, Elowitz M:Tunability and noise dependence in differentiation dynamics.Science2007,315(5819):1716–1719.
15. Schultz D, Ben Jacob E, Onuchic J, Wolynes P:Molecular level stochastic model for competence cycles in Bacillus subtilis.Proc Natl Acad Sci USA2007,104(45):17582–17587.
16. Gillespie DT:Exact stochastic simulation of coupled chemical reactions.J Phys Chem1977,81(25):2340–2361. 17. Kreft JU, Picioreanu C, Wimpenny JW, van Loosdrecht MC:Individual-based modelling of biofilms.Microbiology
2001,147:2897–2912.
18. Goryachev A, Toh D, Wee K, Lee T, Zhang H, Zhang L:Transition to quorum sensing in an Agrobacterium population: A stochastic model.PLoS Comput Biol2005,1(4):e37.
19. Xavier J, Foster K:Cooperation and conflict in microbial biofilms.Proc Natl Acad Sci USA2007,104(3):876–881. 20. Johnson LR:Microcolony and biofilm formation as a survival strategy for bacteria.J Theor Biol2008,251(1):24–34. 21. Nadell C, Xavier J, Levin S, Foster K:The evolution of quorum sensing in bacterial biofilms.Plos Biol2008,6(1):e14. 22. D'Agata EM, Magal P, Olivier D, Ruan S, Webb GF:Modeling antibiotic resistance in hospitals: the impact of
minimizing treatment duration.J Theor Biol2007,249(3):487–499.
23. Murphy JT, Walshe R, Devocelle M:A computational model of antibiotic-resistance mechanisms in methicillin-resistant Staphylococcus aureus (MRSA).J Theor Biol2008,254(2):284–293.
24. Miller J, Parker M, Bourret RB, Giddings MC:An Agent-Based Model of Signal Transduction in Bacterial Chemotaxis.PLoS One2010,5(5):e9454.
25. Repast Suite: [http://repast.sourceforge.net/].
26. Hamoen LW, Van Werkhoven AF, Bijlsma JJE, Dubnau D, Venema G:The competence transcription factor of Bacillus subtilis recognizes short A/T-rich sequences arranged in a unique, flexible pattern along the DNA helix.Genes Dev1998,12(10):1539–1550.
27. Leisner M, Stingl K, Radler JO, Maier B:Basal expression rate of comK sets a‘switching-window’into the K-state of Bacillus subtilis.Mol Microbiol2007,63(6):1806–1816.
28. Ogura M, Tanaka T:Bacillus subtilis DegU acts as a positive regulator for comK expression.FEBS Lett1996, 397(2–3):173–176.
29. Hamoen L, Van Werkhoven A, Venema G, Dubnau D:The pleiotropic response regulator DegU functions as a priming protein in competence development in Bacillus subtilis.Proc Natl Acad Sci USA2000, 97(16):9246–9251.
30. Smits W, Hoa T, Hamoen L, Kuipers O, Dubnau D:Antirepression as a second mechanism of transcriptional activation by a minor groove binding protein.Mol Microbiol2007,64(2):368–381.
32. Ratnayake-Lecamwasam M, Serror P, Wong K, Sonenshein AL:Bacillus subtilis CodY represses early-stationary-phase genes by sensing GTP levels.Genes Dev2001,15(9):1093–1103.
33. D'Souza C, Nakano MM, Zuber P:Identification of comS, a gene of the srfA operon that regulates the establishment of genetic competence in Bacillus subtilis.Proc Natl Acad Sci U S A1994,91(20):9397–9401. 34. Hamoen LW, Eshuis H, Jongbloed J, Venema G, Sinderen D:A small gene, designated comS, located within the
coding region of the fourth amino acid-activation domain of srfA, is required for competence development in Bacillus subtilis.Mol Microbiol1995,15(1):55–63.
35. Schneider KB, Palmer TM, Grossman AD:Characterization of comQ and comX, Two Genes Required for Production of ComX Pheromone in Bacillus subtilis.J Bacteriol2002,184(2):410–419.
36. Turgay K, Hahn J, Burghoorn J, Dubnau D:Competence in Bacillus subtilis is controlled by regulated proteolysis of a transcription factor.EMBO J1998,17(22):6730–6738.
37. Prepiak P, Dubnau D:A Peptide Signal for Adapter Protein-Mediated Degradation by the AAA + Protease ClpCP.Mol Cell2007,26(5):639–647.
38. Burdett ID, Kirkwood TB, Whalley JB:Growth kinetics of individual Bacillus subtilis cells and correlation with nucleoid extension.J Bacteriol1986,167(1):219–230.
39. Fall CP, Marland ES, Wagner JM, Tyson JJ:Computational Cell Biology.New York, NY: Springer-Verlag New York, Inc.; 2004. 40. Continuous Valued Cellular Automata in Two Dimensions: [http://www.cs.sjsu.edu/faculty/rucker/capow/santafe.html]. 41. Shapiro L, McAdams HH, Losick R:Why and how bacteria localize proteins.Science2009,326(5957):1225–1228. 42. Maamar H, Dubnau D:Bistability in the Bacillus subtilis K-state (competence) system requires a positive
feedback loop.Mol Microbiol2005,56(3):615–624.
43. Hoa TT, Tortosa P, Albano M, Dubnau D:Rok (YkuW) regulates genetic competence in Bacillus subtilis by directly repressing comK.Mol Microbiol2002,43(1):15–26.
44. Veening J, Stewart EJ, Berngruber TW, Taddei F, Kuipers OP, Hamoen LW:Bet-hedging and epigenetic inheritance in bacterial cell development.Proc Natl Acad Sci USA2008,105(11):4393–4398.
45. R Development Core Team:R: A Language and Environment for Statistical Computing. [http://www.r-project.org]. 46. Levin B, Rozen D:Non-inherited antibiotic resistance.Nat Rev Micro2006,4(7):556–562.
47. Keren I, Kaldalu N, Spoering A, Wang Y, Lewis K:Persister cells and tolerance to antimicrobials.FEMS Microbiol Lett2004,230(1):13–18.
48. Gutenkunst RN, Waterfall JJ, Casey FP, Brown KS, Myers CR, Sethna JP:Universally sloppy parameter sensitivities in systems biology models.PLoS Comput Biol2007,3(10):1871–1878.
49. Roostalu J, Joers A, Luidalepp H, Kaldalu N, Tenson T:Cell division in Escherichia coli cultures monitored at single cell resolution.BMC Microbiol2008,8(1):68.
doi:10.1186/1742-4682-10-23
Cite this article as:Stiegelmeyer and Giddings:Agent-based modeling of competence phenotype switching in
Bacillus subtilis.Theoretical Biology and Medical Modelling201310:23.
Submit your next manuscript to BioMed Central and take full advantage of:
• Convenient online submission
• Thorough peer review
• No space constraints or color figure charges
• Immediate publication on acceptance
• Inclusion in PubMed, CAS, Scopus and Google Scholar
• Research which is freely available for redistribution
Submit your manuscript at www.biomedcentral.com/submit