O R I G I N A L A R T I C L E
Open Access
Spatial differences in the influence of
science popularization resources
development on the energy consumption
carbon footprint in provincial regions of
China
Gang Ding
1,2*, Yu Ding
1and Pingping Weng
1Abstract
Background:Science popularization resources development is an important means to improve public scientific literacy and has a crucial influence on the formation of public consumption habits, patterns and concepts, and ultimately on the energy consumption carbon footprint.
Methods:Based on panel data from the provincial regions in China from 2010 to 2014, this paper measures the energy consumption carbon footprint in provincial regions using Intergovernmental Panel on Climate Change (IPCC) methods and builds a geographically weighted regression (GWR) model to evaluate the levels of science popularization resources development in provincial regions by using the global entropy method. Then, the mechanisms of influence on the energy consumption carbon footprint and the levels of science popularization resources development in the provincial regions of China are analyzed and measured.
Results:The results showed that science popularization resources development could significantly lower the energy consumption carbon footprint; from 2010 to 2014, the lowering effect of science popularization resources development on the energy consumption carbon footprint in the major east, middle, and west provincial regions showed a weakening trend, with a greater lowering amplitude in the east than in the middle and west regions and narrowing spatial differences among them; at present, this influence works best in the west region followed by the middle and east regions.
Conclusions: The results imply that we should give full attention to science popularization resources development to lower the energy consumption carbon footprint in China. In addition, focus should be given to the west region of China and construction mechanisms for science popularization resources that are built with flexible adoptions of means such as a combination of government guidance and market mechanisms, as well as joint construction by government and society.
Keywords:Science popularization resources development, Energy consumption carbon footprint, Spatial difference
* Correspondence:[email protected]
1School of Economics and Management, Fuzhou University, Fuzhou 350100,
Fujian, China
2
School of Public Policy and Management, UCAS, Beijing 100084, China
Background
In recent years, the effect of climate change caused by
emissions of greenhouse gases such as CO2has become
more prominent and has attracted wide attention from the international community. Currently, carbon emissions are no longer limited to production links, but instead, they have extended into the entire consumption system. The concept of energy consumption carbon footprint was derived from the term“ecological footprint”[1]. The cept reveals the influence of human life in terminal con-sumption areas on climate change and is an important symbol of green development studies shifting from the level of production to consumption. Additionally, energy consumption carbon footprint can effectively measure environmental pollution caused by excessive emissions of greenhouse gases and objectively reflect the envir-onmental pressure changes in certain regions caused by carbon emissions.
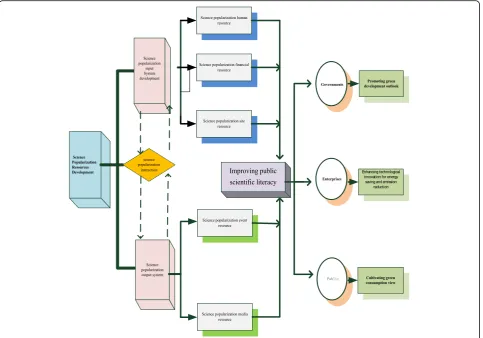
Needless to say, the level of scientific literacy of the public will influence their consumption habits and pat-terns and ultimately their energy consumption carbon footprints. Science popularization refers to the activities of popularizing knowledge of natural and social sciences, spreading scientific thoughts, promoting scientific spirit, advocating for scientific methods, and widening the application of scientific technologies in a way easy for the public to understand, accept, and participate [2]. Generally, science popularization resources include a resource system consisting of essential elements and their combinations for various science popularization practices, including science popularization input and output systems. The input system consists of resources related to science popularization abilities such as human, finance, and site resources, while the output system consists of science popularization event resources and media resources produced from creating and managing the above input system. The former serves as the founda-tion for science popularizafounda-tion outputs, while the latter serves as the concrete content of science popularization outputs, jointly forming the complete science popularization resource system. Science popularization resources devel-opment undoubtedly serves as an important means for improving the scientific literacy and environmental pro-tection awareness of the public [3]. Moreover, science popularization resources development could help culti-vate public green consumption views, promote and deepen the carbon emission reductions of various en-terprises, and enhance and promote green development outlooks at all levels of government. In addition, the development of these resources is conducive to prac-ticing low-carbon consumption and development strat-egies featuring policy guidance, corporate dominance and public participation [4–6], and ultimately effect-ively lowering the energy consumption carbon footprint
[7–10]. The relevant influence mechanisms are shown in Fig.1.
As for the subject of ecological protection, human beings play a decisive role in the construction of ecological sys-tems. Therefore, the fundamental motive for promoting carbon reduction and environmental protection work lies in effectively uplifting the environmental protection aware-ness of the public [11]. Science popularization resources development undoubtedly serves as an important means for improving the scientific literacy and environmental pro-tection awareness of the public [3]. Science popularization event resources can be constructed by holding various sci-ence popularization events for environmental protection (such as science popularization exhibitions, competitions, and lectures on promoting ecological civilization and green consumption), where there is a wide public participation and environmental protection is also promoted to the pub-lic. Science popularization media resources can be created by providing vivid green consumption services with image-text and sound-image combinations with carriers such as books, magazines, radio, TV, and websites. The construc-tion of science popularizaconstruc-tion input resources, such as human, finance, and site resources, can provide a founda-tion and guarantee the output of resource elements such as events and media and deeply root the green consump-tion view into the daily life and behaviors of the public.
Enterprises are the subject of energy consumption, so a shift of the corporate consumption view is crucial to reducing carbon emissions. Low-carbon developments are the only way to upgrade and transition Chinese enterprises. In addition, science popularization resources can help and enhance the awareness of corporate ecological pro-tection concepts and push enterprises to promote car-bon emission-reduction work. Science popularization resources development can help promote enterprises to carry out energy-saving and emission-reduction techno-logical developments. Enterprises could uplift the prod-uctivity of low-carbon products by improving production technologies and enhancing the R&D and application of low-carbon technologies to meet low-carbon consumption demands [12]. In addition, the development of popular science resources can help shift the corporate development goal from purely pursuing economic benefits to giving equal consideration to social responsibility. The flexible popularization of scientific knowledge, method, spirit, and environmental protection concepts with carriers such as holding science popularization themed events, exhibitions, and bulletin boards can help enterprises shoulder social responsibility when creating profit and ultimately win social respect through contributing to society with reduced carbon emissions.
The multi-functionality and high penetration of science popularization resources development will undoubtedly help form low-carbon consumption and development concepts in governments and ultimately enhance and promote the green development outlook. Green low-carbon consumption serves as the core of sustainable living while stimulating green consumption in families with economic means turns out to be the precondition of green low-carbon consumption [13]. First, science popularization resources development can help govern-ments regulate consumption behaviors of residents and lower energy consumption intensity with economic means such as adjusting resource tax rates and levying methods as well as providing financial subsidies. In addition, science popularization resources development can help governments reform the outlook of economic development and form a scientific performance concept by shifting from pursuing quantity and scale to uplifting quality and efficiency as well as including indexes reflecting environmental resources, such as unit GDP occupancy of resources and energy consumption, into
political performance evaluations. Moreover, science popularization resources development is conducive for governments to scientifically guide the optimization and adjustment of industrial structure and population struc-ture, lowering the proportion of high energy consump-tion industries and optimizing energy producconsump-tion and consumption layout. Finally, science popularization re-sources development can act in favor of governments enhancing the construction of ecological civilization sys-tems and guiding entire societies to practice low-carbon, energy-saving, and environmentally friendly living styles.
Since the implementation of the Outline of the Action Plan for the Nation’s Science Literacy, the process of Chinese regional science popularization resources has con-stantly been deepened, and the forms and means for the public-targeted popularization of scientific technologies have been increasingly enriched, hence positively uplifting the scientific literacy of the public. Most scholars at home and abroad have discussed the influence on the regional energy consumption carbon footprint from the angles of economic development, population growth [14, 15], and
energy consumption [16,17], and there is no literature has included science popularization resources development in the scope of research. Whether in terms of the influence mechanism or empirical analysis, there are no arguments supporting whether the influence exists or not, or what the intensity of the influence is if it exists, i.e., whether science popularization resources development can lower the energy consumption carbon footprint or not. If it exists, are there any differences among regions?
To this end, considering that there can be differ-ences in the influence of science popularization re-sources development on the energy consumption carbon footprint among different provincial regions, this paper is based on dynamic comprehensive mea-surements of the levels of energy consumption carbon footprint and science popularization resources devel-opment in provincial regions and attempts to use the panel data of provincial regions from 2010 to 2014 and then adopt a GWR (geographically weighted re-gression) model that could effectively reflect the inter-regional differences of regression coefficients to reach the goal of analysis [18]. Through empirical analysis, the following questions will be answered: (1) Can re-gional science popularization resources development effectively lower the energy consumption carbon foot-print? (2) If it can, are there any spatial differences among the different Chinese provincial regions in terms of intensity? The remainder of the paper is ar-ranged as follows: section 1 analyzes the mechanisms of the influence of science popularization resources development on the energy consumption carbon foot-print; section 2 empirically explores the influence of science popularization resources development on the energy consumption carbon footprint; section 3 pre-sents the provincial comparison based on the results of the above empirical analysis; and section 4 presents the main conclusions of this paper.
In terms of research content, the current literature has mostly studied the factors that influence the energy consumption carbon footprint based on economic indi-cators such as GDP and population. However, few arti-cles have studied the impacts of science popularization resources development on the spatial differences in the energy consumption carbon footprint from the perspec-tive of consumers; in terms of research methods, the literature often uses constant coefficient measurement models to analyze the impacts of economic indicators on carbon footprint. However, there is little research that uses variable coefficient measurement models to study the impacts of provincial science popularization on the energy consumption carbon footprint. This un-doubtedly indicates a new direction for the research of this article, which also indicates the innovation and ori-ginality of this article.
Methods Empirical model
Considering that there can be differences in the influ-ence of sciinflu-ence popularization resources development on the energy consumption carbon footprint among dif-ferent provincial regions, this paper adopts a GWR model for analysis that can effectively reflect interre-gional differences of regression coefficients [19, 20]. A GWR model fully considers the spatial non-stationarity of regression coefficients, as shown in Formula (1):
yi¼αi0ðui;νiÞ þ
Xp
k¼1
αikðui;viÞXikþεi i¼1;2;⋯;n
ð1Þ
where y is the explained variable, which is the linear
combination of explaining variables xk (k= 1,2,…,p) and
i= 1,2,..., n is the number of observed values. εi is the
stochastic error term that satisfies the features of a nor-mal distribution. In the model, the estimated parameters
are the functions of the spatial positioni, which changes
with the change in spatial position. (ui,vi) are the spatial position coordinates of the sample i, andαik(ui,vi) is the
value of the coefficient of independent variable xkat the
point of i. In model (1), the regression coefficient of the region i is the variate αik(ui,vi) obtained through local regression estimation of a data subsample of approxi-mate observed values. The weighted least squares
method is used for estimation of Formula (2):
α u
i;vi
ð Þ ¼ XTW uð i;viÞX
−1
XTW uð i;viÞY ð2Þ
where Wis the spatial weight matrix of n×n, in which
all non-diagonal elements are 0, and all diagonal ele-ments are the distance functions between the observed
value at location jand point i that are used to measure
the influence of the spatial locations of observed values of j(j= 1,2,…,n) on the parameter estimation of pointi.
To estimate the parameters in Formula (2), a suitable
criterion is selected to determine the spatial weight
matrix W. The commonly used method to calculate a
spatial weight matrix include Gaussian distance, expo-nential distance, and tricube distance, and the first one is adopted in this paper to determine the weight:
W uð i;viÞ ¼e
−12 dij
.
b
2
ð3Þ
where b is the bandwidth of the smoothing parameter,
Ac¼2n lnð Þ þ^σ n ln 2ð Þ þπ n nþtr sð Þ
n−2−tr sð Þ
ð4Þ
where A is the value of AIC, and the subscriptc is the corrected estimated value; n is the sample size; ^σ is the standard deviation of the error term estimation; tr(s) is the trace of the matrix S in the GWR; that is, the func-tion of the bandwidth.
On the basis of Formula (1), the GWR model is
built to measure the influence of science
po-pularization resources development on the energy consumption carbon footprint in provincial regions. It is assumed that apart from the factors such as economic development, population growth, and en-ergy consumption, science popularization resources development is also an important factor that influ-ences the energy consumption carbon footprint, and the expected effect is negative, i.e., it can effectively lower the energy consumption carbon footprint. The variable explained by this model is the energy consumption carbon trace in provincial regions; the
explaining variable is the level of science
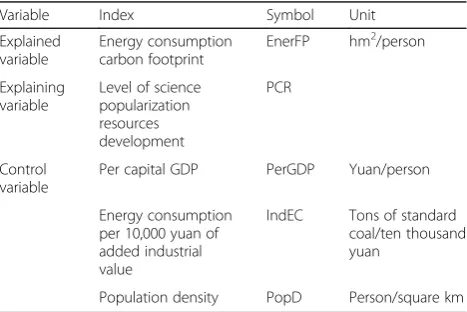
po-pularization resources development in provincial re-gions; the control variables are the per capita GDP (reflecting the factor of economic development), population density (reflecting the factor of popula-tion growth), and energy consumppopula-tion per 10,000 yuan of added industrial value (reflecting the factor of energy consumption). Detailed information is shown in Table 1.
Data
Explained variable: energy consumption carbon footprint in provincial regions The energy consump-tion carbon footprint variable is represented in units
of land area, representing the cost of ecological
re-sources required to absorb the CO2 emissions
caused by energy consumption; carbon emissions of major energy types can be calculated by the IPCC
method [21, 22], while the conversion coefficient
between the carbon emissions from energy con-sumption and ecological footprint can be
deter-mined by measuring the forest absorption of CO2,
which can then be converted into land area, and the energy consumption carbon footprint value can be
obtained through summation [23]. The specific
cal-culation is as shown in Formula (5) [24]:
Cfj¼
X8
i¼1
Cfij¼
X8
i¼1
Cij
PFCL ð
5Þ
where Cfj is the energy consumption carbon footprint
of the jth province, Cij is the ith type of energy
consumption carbon emissions (including eight main types of energy that consist of coal, coke, crude oil, gasoline, kerosene, diesel, fuel oil, and natural gas) of thejthprovince,Pis the total population, andFCLis the ratio of the conversion coefficient between carbon emissions and forest area. This paper adopts the conversion coefficient between energy consumption carbon emissions and ecological footprint released by
the WWF (measured by the quality of CO2absorption
by forests), namely 6.49 t/hm2 [25]. The formula
converts the substantial consumption of various types
of energy into released heat by averaging c, which can
be used to obtain specific values of the energy consumption carbon footprint for provinces. The index data are sourced from the China Statistical Yearbook and China Energy Statistical Yearbook over all years. Through measurements and calculations, the energy consumption carbon footprints for 30 provinces in China (Xizang, Hong Kong, Macao, and Taiwan not included due to data constraints) are obtained, as
shown in Table2.
The level of science popularization resources develop-ment can be obtained through calculation using the glo-bal entropy method.
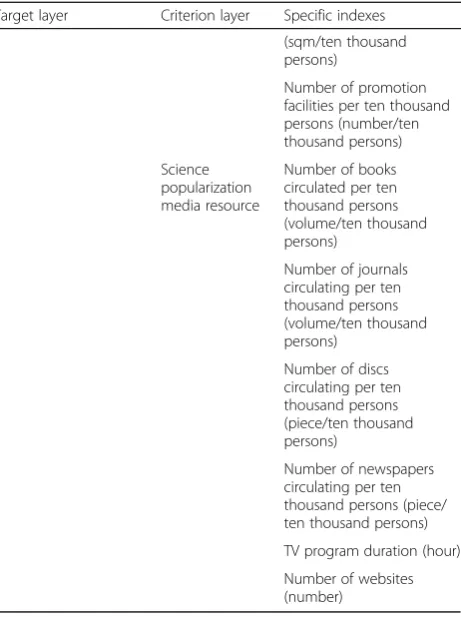
Explaining variable: the level of science popularization resources development in provincial regions This paper holds that the level of science popularization resources development cannot be measured with a singular index, so on the basis of drawing upon [26, 27], a comprehensive evaluation index system is built, as shown in Table 3, covering five layers of criteria of science popularization human resources, event re-sources, financial rere-sources, media rere-sources, and site resources, which can be broken down into 22 evalu-ation indexes.
Table 1Selection of the factors that influence the energy consumption carbon footprint
Variable Index Symbol Unit
Explained variable
Energy consumption carbon footprint
EnerFP hm2/person
Explaining variable
Level of science popularization resources development
PCR
Control variable
Per capital GDP PerGDP Yuan/person
Energy consumption per 10,000 yuan of added industrial value
IndEC Tons of standard
coal/ten thousand yuan
On the basis of building a comprehensive evaluation index system, this paper adopts the global entropy method [28, 29] that features objective weighting and dynamic comparability to obtain data on the level of sci-ence popularization resources development in provincial regions. The steps are as follows:
Build a global evaluation matrix and standardize it. n indexes are used to evaluate the science popularization
resources development of m provincial regions over a
duration ofT years and ultimately build an initial global evaluation matrix for the evaluation system, which is recorded asX:
x¼ xtij mTn¼
x111 x121 … x1n1
x211 x221 … x2n1
… … …
xm11 xm21 … xmn1
… …
x11T x12T … x1nT
x21T x22T … x2nT … … …
xm1T xm2T … xmnT
2 6 6 6 6 6 6 6 6 6 6 6 6 4
3 7 7 7 7 7 7 7 7 7 7 7 7 5
ð6Þ
where xt
ij is the assigned value of the j th
evaluation index of the ith provincial region at the tth year, and
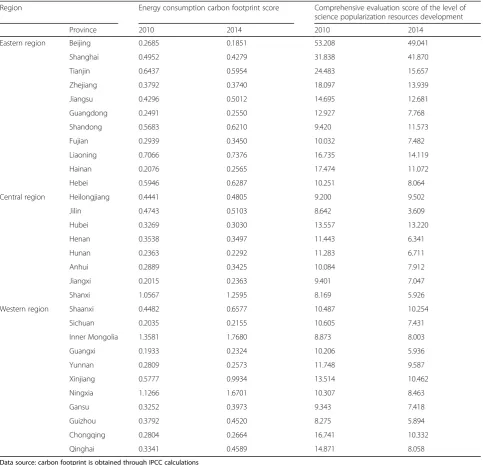
Table 2Comprehensive evaluation scores of the energy consumption carbon footprint and level of science popularization resources development in provincial regions
Region Energy consumption carbon footprint score Comprehensive evaluation score of the level of
science popularization resources development
Province 2010 2014 2010 2014
Eastern region Beijing 0.2685 0.1851 53.208 49.041
Shanghai 0.4952 0.4279 31.838 41.870
Tianjin 0.6437 0.5954 24.483 15.657
Zhejiang 0.3792 0.3740 18.097 13.939
Jiangsu 0.4296 0.5012 14.695 12.681
Guangdong 0.2491 0.2550 12.927 7.768
Shandong 0.5683 0.6210 9.420 11.573
Fujian 0.2939 0.3450 10.032 7.482
Liaoning 0.7066 0.7376 16.735 14.119
Hainan 0.2076 0.2565 17.474 11.072
Hebei 0.5946 0.6287 10.251 8.064
Central region Heilongjiang 0.4441 0.4805 9.200 9.502
Jilin 0.4743 0.5103 8.642 3.609
Hubei 0.3269 0.3030 13.557 13.220
Henan 0.3538 0.3497 11.443 6.341
Hunan 0.2363 0.2292 11.283 6.711
Anhui 0.2889 0.3425 10.084 7.912
Jiangxi 0.2015 0.2363 9.401 7.047
Shanxi 1.0567 1.2595 8.169 5.926
Western region Shaanxi 0.4482 0.6577 10.487 10.254
Sichuan 0.2035 0.2155 10.605 7.431
Inner Mongolia 1.3581 1.7680 8.873 8.003
Guangxi 0.1933 0.2324 10.206 5.936
Yunnan 0.2809 0.2573 11.748 9.587
Xinjiang 0.5777 0.9934 13.514 10.462
Ningxia 1.1266 1.6701 10.307 8.463
Gansu 0.3252 0.3973 9.343 7.418
Guizhou 0.3792 0.4520 8.275 5.894
Chongqing 0.2804 0.2664 16.741 10.332
Qinghai 0.3341 0.4589 14.871 8.058
n= 24, m= 30, and T= 5. Given that the dimension, magnitude, and positive and negative assignment of
each index vary, X has to be standardized to make xt
ij
∈½0;100, as shown in Formula (7) and Formula (8). ðxt
ijÞ 0
is the equally standardized index value, xjmin is
the minimal value of the jth index, xjmax is the
maximal value of the jth index. Formula (7) and
Formula (8) are respectively for the standardization of the positive index and negative index.
xtij
0
¼ xtij−xjmin
xjmax−xjmin
99þ1ði¼1;2;…;m;
j¼1;2;…;n;t¼1;2;…TÞ
ð7Þ
xtij
0
¼ xjmax−xtij
xjmax−xjmin
99þ1ði¼1;2;…;m;
j¼1;2;…;n;t¼1;2;…TÞ
ð8Þ
The formula for measuring the information entropy of thejthindex is as follows:
Table 3Comprehensive evaluation index system to determine the levels of science popularization resources development in provincial regions
Target layer Criterion layer Specific indexes
Level of science popularization resources development in provincial regions
Science popularization human resource
Number of science popularization personnel (person/ten thousand persons)
Proportion of professionals among science
popularization personnel (%)
Proportion of persons with above-intermediate titles or above-undergraduate credential among professionals (%)
Proportion of registered volunteers among part-time personnel (%)
Proportion of creation personnel among professionals (%)
Science popularization event resource
Total number of three types of events (time)
Proportion of participating person-time in three types of events among the regional population (person-time/ten thousand persons)
Proportion of participating person-time during event weeks among the regional population (person-time/ ten thousand times)
Proportion of participating person-time in international exchanges among the regional population (person-time/ten thousand persons)
Proportion of participating person-time in openness to the society of colleges, universities and research institutions among the regional population (person-time/ten thousand persons)
Science popularization financial resource
Average fundraising amount (yuan/person)
Proportion of regional fundraising amount in GDP (%)
Average fund use amount (yuan/person)
Science popularization site resource
Number of sites per million persons (number/ one million persons)
Exhibition area per ten thousand persons
Table 3Comprehensive evaluation index system to determine the levels of science popularization resources development in provincial regions(Continued)
Target layer Criterion layer Specific indexes
(sqm/ten thousand persons)
Number of promotion facilities per ten thousand persons (number/ten thousand persons)
Science popularization media resource
Number of books circulated per ten thousand persons (volume/ten thousand persons)
Number of journals circulating per ten thousand persons (volume/ten thousand persons)
Number of discs circulating per ten thousand persons (piece/ten thousand persons)
Number of newspapers circulating per ten thousand persons (piece/ ten thousand persons)
TV program duration (hour)
ej¼−K
XT
t¼1
Xn
i¼1
ytij lnytij ð9Þ
where yt ij¼
ðxt ijÞ
0
XT
t¼1 Xm
i¼1 ðxtijÞ
0
, constantK¼ 1
lnmT, which is
related to the number m of the samples in the system.
When the information in the system is distributed dis-orderly, then the degree of order is 0 and information entropyej=1. When samples are all in a disorderly state,
yt ij¼1.
According to information entropy index, the weight wj of the jth index can be calculated. When 0≤wj≤1,
Pn
j¼1wj¼1 as follows:
wj¼
1−ej
n−X
n
j¼1
ej
ð10Þ
After obtaining the results of the index weight, For-mula (11) can be used to calculate the comprehensive evaluation score:
si¼
Xn
j¼1
wj xtij
0
ð11Þ
The index data are sourced from the China Statistical Yearbook and China Energy Statistical Yearbook over all years. Through the calculation, the data on the level of science popularization development for provincial re-gions across the country are obtained, as shown in Table2.
Control variable There are three control variables, namely, per capita GDP, population density, and energy consumption per 10,000 yuan of added industrial value. The index data are sourced from the China Statistical Yearbook and China Energy Statistical Yearbook over all years.
Results and discussion
Before starting the GWR modeling, we need to detect whether there is an obvious spatial correlation of the sample data. If there is, it is suitable to adopt the GWR model for analysis; otherwise, it is more suitable to adopt a constant coefficient model (such as OLS). GeoDa 9.5 software is adapted to detect the spatial correlation of the energy consumption carbon footprint in provincial regions of China from 2010 to 2014. The results from Moran’s I statistical analysis show that the values are 0.2860, 0.2406, 0.2641, 0.2834, and 0.2989, and the
normal statistical magnitude Z is lower than the
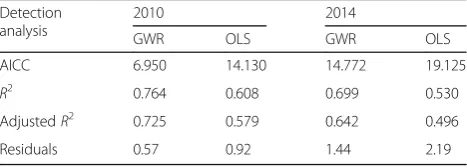
significant level (1.96) of the normal distribution func-tion 0.01, indicating that there is relatively strong positive spatial correlation among the levels of the energy consumption carbon footprint in provincial regions, and the GWR model needs to be introduced to offset the shortcomings of traditional constant coef-ficient models. With SAM4.0 software, the values esti-mated by the GWR model in 2010 and 2014 in the provincial regions are calculated and compared with those from an OLS model, which is a typical example of trad-itional constant coefficient models (see Table4).
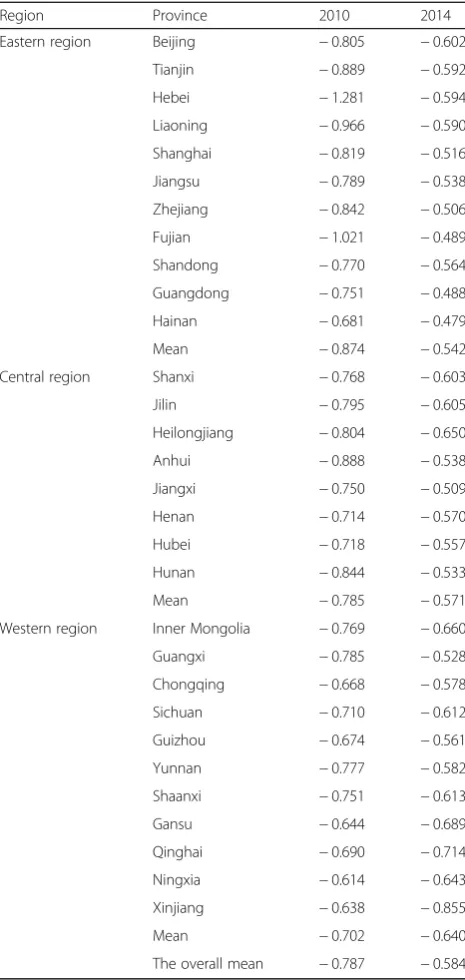
From Table4, it can be seen that after introducing the GWR model, the fitting degree and regression effect are significantly improved. Hence, it is suitable for this paper to adopt the GWR model for empirical analysis. Further results from testing the significance of the regression co-efficient show that when the significance level S= 0.05, the regression coefficients of the three variables of PCR, PerGDP, and IndEC all passed significance testing except for the control variable PopD. The GWR-estimated re-sults and the spatial distribution of the GWR coefficient of the influence of science popularization resources de-velopment on the energy consumption carbon footprint in Chinese provincial regions are as shown in Table 5. Generally, the GWR-estimated results of the influence of science popularization resources development on the en-ergy consumption carbon footprint in Chinese provincial regions from 2010 to 2014 are all negative, indicating that it is negatively correlated with the energy consump-tion carbon footprint with obvious interprovincial differ-ences; the absolute values of the GWR-estimated coefficient for the east, middle, and west regions in 2010 are 0.874, 0.785, and 0.702, respectively. The values slightly declined in 2014, and they were 0.542 (the west), 0.571 (the middle), and 0.640 (the east). From 2010 to 2014, the influence of science popularization resources de-velopment on the energy consumption carbon footprint in three regions displayed a weakening trend, but the lower-ing amplitude in the east is higher than that in the middle and west regions, yet the imbalance is narrowing.
By the spatial quintile method, the participating pro-vincial regions of China can be divided into five arrange-ment levels according to the coefficient of the influence
Table 4Comparison of detection results between GWR and OLS estimation models
Detection analysis
2010 2014
GWR OLS GWR OLS
AICC 6.950 14.130 14.772 19.125
R2 0.764 0.608 0.699 0.530
AdjustedR2 0.725 0.579 0.642 0.496
Residuals 0.57 0.92 1.44 2.19
of science popularization resources development on the energy consumption carbon footprint (as per the average value from 2010 to 2014).
Level I region: six provincial regions of Shanghai, Zhe-jiang, Fujian, Jiangxi, Guangdong, and Hainan with the lowest absolute values of the influence coefficient;
Level II region: six provincial regions of Jilin, Beijing, Hebei, Shanxi, Shaanxi, and Sichuan with relatively low absolute values of the influence coefficient;
Level III region: six provincial regions of Liaoning, Shandong, Henan, Tianjin, Chongqing, and Yunnan with average absolute values of the influence coefficient;
Level IV region: six provincial regions of Jiangsu, Anhui, Hubei, Hunan, Guizhou, and Guangxi with rela-tively high absolute values of the influence coefficient;
Level V region: six provincial regions of Heilongjiang, Inner Mongolia, Ningxia, Qinghai, and Xinjiang with the highest absolute values of the influence coefficient.
Conclusions
The results of the empirical analysis showed that the level of science popularization resources development and the energy consumption carbon footprint are obvi-ously negatively correlated. From 2010 to 2014, there were certain spatial differences in the influence of sci-ence popularization resources development on the en-ergy consumption carbon footprint in the three major regions of the east, the middle, and the west. In 2014, the influence reached the highest level in the west followed by the middle and the east, yet the imbalance among the regions began to narrow.
This study has theoretical value and practical signifi-cance. At present, we should fully understand the influ-ence of sciinflu-ence popularization resources development on the energy consumption carbon footprint. Science popularization resources development can help cultivate the views of green consumption by the public, promote and deepen the carbon emission-reduction work of various enterprises, and enhance the outlook on green development at all levels of government. In addition, it is also conducive to practicing low-carbon consumption, developing strategies featuring public participation, corporate dominance and policy guidance, and ultim-ately effectively lowering the energy consumption carbon footprint.
The practical significance of this study lies in establish-ing regional policies. Focus should be given to the west re-gion, and resource construction mechanisms built with flexible adoptions of means, such as a combination of gov-ernment guidance and market mechanisms, as well as joint construction by government and society. In addition, it is necessary to optimize policies related to the environ-ment and cultural environenviron-ment and establish evaluation and feedback frameworks with focus on performance evaluations and feedback evaluations, with a view of fully utilizing science popularization resources development to lower the energy consumption carbon footprint and ul-timately assisting in promoting low-carbon society con-struction and green economic development.
Although this research strives to be rigorous and ob-jective, there are still some shortcomings due to the au-thor’s own research ability and data availability. For example, although this paper selects the construction of
Table 5GWR-estimated results of the influence coefficient of science popularization resources development on the energy consumption carbon footprint in Chinese provincial regions
Region Province 2010 2014
Eastern region Beijing −0.805 −0.602
Tianjin −0.889 −0.592
Hebei −1.281 −0.594
Liaoning −0.966 −0.590
Shanghai −0.819 −0.516
Jiangsu −0.789 −0.538
Zhejiang −0.842 −0.506
Fujian −1.021 −0.489
Shandong −0.770 −0.564
Guangdong −0.751 −0.488
Hainan −0.681 −0.479
Mean −0.874 −0.542
Central region Shanxi −0.768 −0.603
Jilin −0.795 −0.605
Heilongjiang −0.804 −0.650
Anhui −0.888 −0.538
Jiangxi −0.750 −0.509
Henan −0.714 −0.570
Hubei −0.718 −0.557
Hunan −0.844 −0.533
Mean −0.785 −0.571
Western region Inner Mongolia −0.769 −0.660
Guangxi −0.785 −0.528
Chongqing −0.668 −0.578
Sichuan −0.710 −0.612
Guizhou −0.674 −0.561
Yunnan −0.777 −0.582
Shaanxi −0.751 −0.613
Gansu −0.644 −0.689
Qinghai −0.690 −0.714
Ningxia −0.614 −0.643
Xinjiang −0.638 −0.855
Mean −0.702 −0.640
the evaluation index system as comprehensively as pos-sible, it can reflect the development of popular science resources. However, the evaluation index system to be constructed still needs further improvement, and the op-erability of the proposed countermeasures has yet to be improved. Some propositions and conclusions related to this study still need to be further discussed and im-proved in the future.
Abbreviations
GWR:Geographically weighted regression; IPCC: Intergovernmental Panel on Climate Change
Acknowledgements
The author is grateful to the anonymous reviewers for their helpful comments and suggestions.
Funding
This work was supported by these projects: Fuji-an Science and Technology Association science and technology think tank major project (Project No.FJKX-ZD1401); Chinese Academy of Sciences strategic research and decision support system construction project (Project No.GHJ-ZLZX-2016-11); the National Social Science Fund of China (Project No.13CJL071); and Philosophy and Social Science Innovation Team Project of Fuzhou University (17TD06).
Availability of data and materials
Data are available from Figshare: DOI 10.6084/m9.figshare.5501314.
Authors’contributions
YD conducted the literature review and some quantitative analyses. GD guided the direction and ideas of the project. PW analyzed the data and edited the manuscript. All authors read and approved the final manuscript.
Competing interests
The authors declare that they have no competing interests.
Publisher’s Note
Springer Nature remains neutral with regard to jurisdictional claims in published maps and institutional affiliations.
Received: 16 October 2017 Accepted: 23 April 2018
References
1. Wackernagel M, Rees W (1996) Our ecological footprint. Green Teacher 45:5–14
2. Ministry of Science and Technology of the People’s Republic of China (2014) China statistics of science popularization 2013. Sci Technol Docu Press, Bejing 3. Ting X, Minhong L (2016) Implement four science popularization projects to
uplift nationalscientific literacy. Sci Technol Asso Four 2:52–53 4. Dajin Y (2015) Study on development of new energy and government
behavior in the construction of low-carbon city. Ecol Eco 5:73–77 5. Xiaoyan W (2016) The efficiency of low-carbon governance in the central
China based on the model of benevolent DEA. J Syst 1:41–47
6. Ma C, Xu C, LuoZhenyu LT (2015) Low carbon competitiveness evaluation of steel enterprise based on the entropy value method. Control Decis 6:969–976 7. Ma J (2007) Popularize the knowledge of energy conservation and emission
reduction to promote energy conservation and emission reduction. National Sci Technol China 10:86–86
8. Shanghai Science and Technology Energy Conservation Exhibition Hall (2015) Vigorously create a social atmosphere of energy-saving emission reduction to play a leading role of science-based energy-saving exhibition hall science. Shanghai Energy Conserv 12:652–656
9. Jun W (2007) National Development and Reform Commission and other organizations to carry out "energy-saving emission reduction universal action" activities. Energy Res 19(5):49.
10. Yaqin W (2011) On the important role of science popularization in energy saving and emission reduction of automobiles. In: Session 21 of China
Association for Science and Technology Annual Conference—seminar on cultivation and development of popular science personnel
11. Jun Y, Wenting L, Libo Z (2010) Survey and analysis of“environmental awareness”among urban and rural residents. Inq Eco Iss 12:64–67 12. Huarong L (2010) Analysis of china’s consumption of low-carbon construction model. J Cent South U Fore Technol:SocSci 4(4):64–71 13. Aandew G, Stewart B (2006) Behavioural attitudes towards water saving?
Evidence from a study of environmental actions. Ecol Econ 57(3):400–414 14. Shi A (2003) The impact of population pressure on global carbon dioxide emissions 1975–1996: evidence from pooled cross-country data. Ecological Economics 44(1):29–42
15. Dietz T, Rosa EA (1997) Effects of population and affluence on CO2
emissions. Proc Natl Acad Sci 94:175–179
16. Kaya Y(1990) Impact of carbon dioxide emission control on GNP growth: interpretation of proposed scenarios, IPCC energy and industry subgroup. Response Strategies Working Group, Paris
17. Anquan Z, Xingling L, Chunguang Q (2015) The analysis on the influencing factors of china’s steel industry supply chain carbon footprint. Sci Technol Pro Poli 8:77–81
18. StewartFotheringham A, Charlton M, Brunsdon C (1996) The geography ofparameter space: an investigation of spatial non-stationarity. Int J Geo Info Sci 10(5):605–627
19. Brunsdon C, Fotheringham AS, Charlton M (1998) Geographically weighted regression: modelling spatialnon-stationarity. J Roy Sta Soc 47(3):431–443 20. Fotheringham AS, Brunsdon C, Charlton M (2002) Geographically weighted
regression: the analysis of spatially varying relationships. Wiley, New York 21. Intergovernmental Panel on Climate Change (IPCC) (1996) Climate change
1995: the science of climate change. Contribution of working group I to the second assessment report of the intergovernmental panel on climate change. 813 Cambridge University Press, Cambridge
22. Intergovernmental Panel on Climate Change (IPCC) 2006. 2006 IPCC guidelines for 815 national greenhouse inventories. 4. Agriculture, Forestry and other Land Use. Institute for Global Environmental Strategies (IGES), Hayama, Japan. Intergovernmental Panel on Climate Change (IPCC) 2007. Climate Change 2007 23. Zhi L, Meiting J, Wei L (2007) Dynamic measurement of ecological footprint of energy resources and its economic efficiency in last ten years, China. Res Sci 29(6):54–60
24. Lu N, Futian Q, Shuyi F (2011) Trends and determining factors of energy consumption carbon footprint—an analysis for Suzhou-Wuxi-Changzhou region based on STIRPAT model. Nat Res 5:814–824
25. Yundong G, Dongdong W, Fengchun L (2010) Carbon footprint of energy use in shanghai. Chin Popu Res Environ 20(2):103–108
26. Ting L (2011) Construction of the indicator system of regional science popularization capacity. Foru Sci Technol Chin 7:12–17
27. Wu H (2014) Construction and evaluation research on the construction level of provincial science popularization resources in China. Sci Technol Manage Res 18:66–69
28. Yutao S, Fengchao L, Bin L (2009) A comparison of national innovation capacity and development mode between China and europe based on patent. Stu Sci Sci 3:440–444