R E S E A R C H
Open Access
Customized biomedical informatics
Big data analytics for personalized genomics
Abhishek Narain Singh
Correspondence: [email protected];abhishek.narain@ iitdalumni.com;http://www.tinyurl. com/abinarain
Department of Computer Science, Leipzig University, Leipzig, Germany
Abstract
Background:Genome Wide Analytics Studies with regard to structural variations is a key component in phenome association. Here we analyze a family trio of father, mother and children for scientific discovery purpose.
Methods:Structural variations, SVs, with size 1 base-pair to several 1000s of base-pairs with their precise breakpoints and single-nucleotide polymorphisms, SNPs, were determined for members of a family of four. The method involved optimal genome assembly and mapping to reference genome.
Results:It is discovered that the mitochondrial DNA is less prone to SVs re-arrangements than SNPs and can possibly have paternal leakage of inheritance or high mutation in maternal inheritance. Sex determination of an individual is found to be strongly confirmed by means of calls of nucleotide bases of SVs to the Y chromosome. Conclusion:mtDNA inheritance pattern proposes concerns for determining ancestry and divergence between races and species. These in silico techniques for analysis would become such a widespread application that a total transformation of the bio-and-medical industry would go through, as is currently with genome wide analytics and association studies. SVs would serve as fingerprint of an individual contributing to his traits and drug responses, more strongly than SNPs.
Keywords:Bioinformatics, High performance computing, Medical informatics, Inheritance
Background
DNA is the blueprint of life, and has codified information of chemical reactions that are responsible to our emotions, to susceptibility to a disease, predisposition to a dis-ease or characteristic traits such as height, voice tone with pitch, color of skin and hair and eyes and so on and so forth. At the same time these features can vary depending on external factors and the variation would be dependent on the feature itself and the external factor. These physical attributes are termed as‘phenotypes’and in biomedical relevant context it would be the‘disease phenotypes’. It is not just the blueprint, or the corresponding genotype, that is the only responsible influencing agent for a certain phenotype to be expressed but many more external factors, consumption, exposure, in-gestion, etc., have an impact for the onset of a phenotype. However, by and large, the information in the genotype phase does carry a substantial amount of weightage in terms of dictating the disease phenotype of an individual, and cannot be undermined. Thus, it becomes critical to obtain the DNA sequence and analyze them, for the
eventual financial and non-financial impact the findings can be for the patient and other stakeholders in the genomics industry, apart from other curiosity such as ancestry and inheritance that the individual might be generally interested in.
Sequencing is hard, but interpretation of ‘big data’can be much tougher. Technology and thereby machinery has been advancing rapidly and the cost of associated with it is re-ducing at a significant pace in the area of sequencing DNA. We once had the standard Sanger sequencing technology about a decade ago, which was used to complete the draft of first human genome sequence. Over the years, the technology advanced to introduce paired end sequences where the sequence can be determined at either end of a fragment and the insert size in between the ends can be roughly known apriori. Though the accur-acy of this sequence or the base quality is not always reliable, significant lower cost of this technology can allow multiple sequencing of the region of interest which is also known as sequencing coverage, so as to then take the consensus at a region of interest to determine the sequence. Usually a higher average coverage is preferred, and given the various soft-ware tools we have for analysis or assembly, typically the coverage should be above 12× for reasonable reliability. The high false discovery rate of structural variation algorithms even in deeply sequenced individual genomes of the order of 30× average coverage [1,2] suggests that for lower coverage the problem will be even more to get rid of false positives. Nevertheless, the results with coverage as less as 3-5× also could have a lot of meaningful findings, and could be deployed for several genomes analysis which would make sense on a population wide scale at relatively less cost, such as in the 1000 genomes project.
Obtaining a certain uniform coverage of DNA sequencing is challenging simply due to the fact that there are regions in genome which are not easy to sequence, such as the regions near centromere and telomere and the GC rich regions. It is usual that the sequence reads will have an error at a nucleotide base, and to compensate for it, more reads should map into that region to get a confirmation of the exact nucleotide at that locus. The DNA sequencers typically come with output estimate of the amount of nu-cleotide (NL) that DNA sequencer generates, and that value divided by the approxi-mate size of the genome (G) can be a rough estiapproxi-mate for the average read coverage the genome sequencing would have.
Average SequencingCoverage¼NL=G
Article [3] also comes up with the same calculation, for how the coverage can be esti-mated, such as by first finding out the total number of DNA reads that would be gener-ated (N) and multiplying it with the length of each read (L), and then dividing it by the size of the genome (G).
Average SequencingCoverage¼ðNLÞ=G
As an example, if the approximate size of human genome is 3 billion nucleotides, size of the reads is 100 nucleotides, and the total number of reads generated in one run of the sequencer is 0.5 billion nucleotides, then the average coverage is (0.5 billion * 100) / 3 billion, or roughly 17×.
enhances the importance of comprehensive catalogue for genotype and phenotype cor-relation studies [1, 2, 4–9] in particular when the rare or multiple variations in gene underlie characteristic or disease susceptibility [10, 11]. Microarrays [12–14] and se-quencing [15–18] reveal that structural variants (SVs) contribution is significant in characterizing population [19] and disease [20] characteristics. Interestingly in particu-lar the HLA domain in chromosome VI of an individual which is the MHC region in humans, would be interesting in being decoded for the variations, as a lesser difference between two individual could imply stronger success possibility of organ transplant. In general, the HLA domain variation would give an insight in immunologic responses. However, we must be careful with the results we get when we call for the variations, as any difference could represent actual difference between the DNA sources, an assembly artifact (clone-induced or computational) or alignment error. With time the sequencing of human genomes now become routine [1], the spectrum of structural variants and copy number variants (CNVs) has widened to include much smaller events. The im-portant aspect now is to know how genomes vary at large as well as fine scales and by what magnitude does it impact a population in general and an individual in particular. The challenge now is to understand its effects on human disease, characteristic traits and phylogenetic evolutionary clues thus having its large impact in medical and foren-sic area apart from enriching us of mankind evolutionary history.
There has been several new tools made available which can detect variations without the need for assembling the genome for the individual such as those used in the 1000 Genome Project consortium which finds great applicability in case the coverage of se-quences is low [1] and has so to speak yet have a profound impact at a population level. However, if the sequencing coverage is reasonably higher such as above 12-14× in aver-age so to speak in a comparative sense from the data in 1000 Genome Project, then there is no reason as to why assembling the genome and then mapping to a reference genome to detect variations directly should not be the adopted method. In this article, we share result of the variations detected in a family of four individuals’ viz., father, mother, and two daughters.
Methods
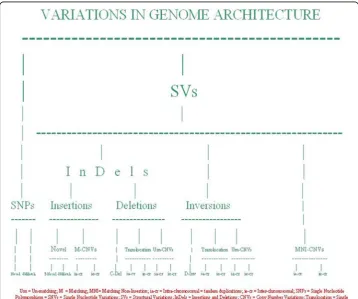
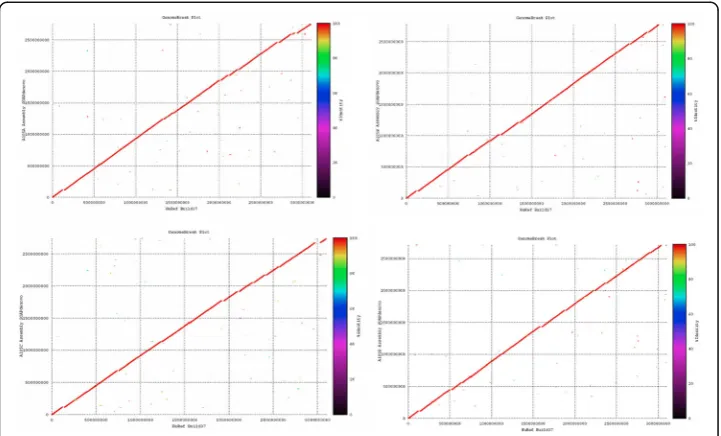
a symmetric multiprocessor cluster with 6 computing cores each of capacity 2.6 GHz. The assemblies of the four individuals were then aligned globally in a parallel comput-ing approach to the NCBI human reference genome, Build 37, followed by extraction of SVs information of category insertions and deletions only (InDels), and single nu-cleotide polymorphisms (SNPs) on regions of misalignment [21,22]. Figure 1 summa-rises the various classes of variations in genomes of individuals found. Genome comparison plot for the A105 family using GenomeBreak is shown in Fig.2where one can graphically get estimates of regions of alignments and mis-alignments with the ref-erence genome NCBI HuRef build 37.
The total time for the alignment and extraction of information on a single computing core of 2.6 GHz capacity came out to about 85 wall-clock hours, for each individual as-sembly. Given that the sequencing technology is expected to improve in the next couple of years not just in the length of the reads at either ends but also in terms of quality of confidence in the letters, future versions of assembly softwares will provide more reliable assembly to be generated and more quickly. It can also be safely assumed looking at the current trend past few years that the cost of sequencing would also be dropping further, which would imply that sequencing with much higher coverage of up to 40× average would become more a routine practice. An important challenge would be requirement of high disk space in order to manage data explosion with simply main-taining the raw data or any intermediate data and downstream results. In order to save
disk space, an interesting approach could be to simply store the mis-alignments of the individual genome rather than the whole genome. The whole genome raw data and as-sembly could be put in tape which are less expensive and yet can store the data reliably. One important aspect that has always been an underpinning concern in most bioinfor-matics software applications has been disk I/O and interprocessor communication bandwidth in case using any of the tools in parallel mode. Another aspect which is cru-cial for making prediction is the sensitivity and specificity of the algorithm used. Speci-ficity has been kept as a preferred choice of the mode of operation of the softwares, as then the hypothesis which we make from relational comparison has stronger level of confidence. At the same time, once these tools and approaches are used for routine ap-plication, there is no reason why we cannot switch to a sensitive mode of using these tools in order to capture more possibilities of variations, though it will obviously be in-creasing more false-positive cases.
Results
A clear application of finding the variations in an individual is in conducting an organ transplant surgery and getting to know a-priori a disposition of an individual or popula-tion to a disease. If the immunologic responses after the grafting of an organ from a donor to the receptor are known beforehand to conducting the transplant, we can be more predictive of the chances of success of the transplantation. The immunologic re-sponses are dictated by the MHC region of the genome, which in humans corresponds to the HLA domain in chromosome VI. So in essence if we extract the SVs and SNPs of chromosome VI of the donor individual and compare it with the SVs and SNPs of acceptor patient’s chromosome VI, then it can be reasonably proposed that the lower the differences between the two sets of SVs and SNPs, the higher the success possibility of organ transplant. However, even with these SVs and SNPs a subset could be more crucial to be identical or being absent perhaps for the transplantation to be successful. Similarly if we are interested in any other particular chromosome which has been
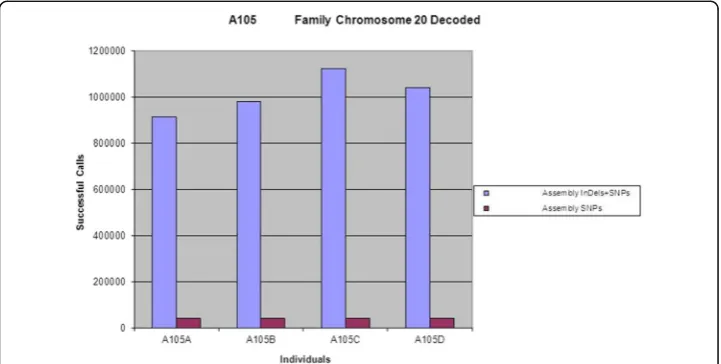
known of having strongly been associated with a particular phenotype or characteristic trait, we can extract the SVs and SNPs for the particular chromosome and conduct a relational database analysis. Below in Fig.3is the plot of the sum of the bases of InDels and SNPs for chromosome XX of A105 family. It is interesting to see that the sum of the bases of InDels have increased in the children when compared to their parents while the levels of SNPs remain more or less the same.
It would yet be interesting that there might be situation where we would simply like to know genome-wide SVs and SNPs of an individual. Figure 4 is a plot of the sum of the bases of SVs and SNPs respectively for the whole genome determined for A105 family. Here again we notice that the children have relatively higher number of bases for SVs than their parents, though the levels of SNPs remain more or less the same. This finding thus proposes that even in one generation of the offsprings, there can be significant rearrangement in the genetic background to produce greater variations in genotype and thereby having an effect on phenotypes, and that the children are not an exact clone of the set of chromosomes they inherited from either parents as there will be significant variation even when simply compared to the chromosomes of the parents that they inherited. The changes in SNPs are more restricted than insertions or dele-tions, and thus SVs serve as a stronger means as a fingerprint and characteristics of an individual when analysed genome-wide.
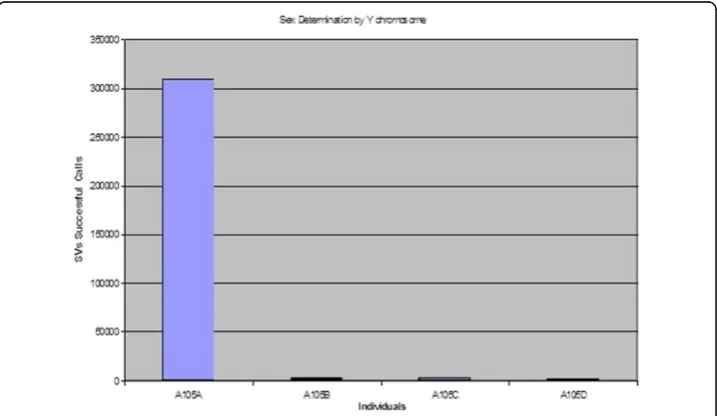
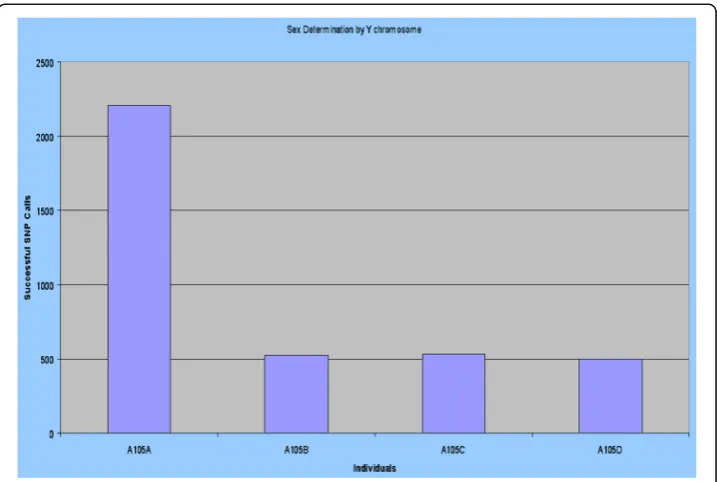
We would also be able to determine the sex of the baby before it is born, thereby provide an alternative and safer means to determine the sex of the baby, without any extra cost, as the genome of the baby will be sequenced and analysed anyways. As an example in Figs.5and6you will see that the calls of bases on Y chromosome of InDels and SNPs respectively is far higher for the father than the mother or the two daughters, thereby clearly being able to differentiate male from female. It is also observed that the difference in the calls of sum of bases for InDels is far higher than the calls for the sum of the bases for SNPs, thereby proposing that the former is a stronger means to deter-mine the sex of an individual than the latter. This also proposes that contrary to what is observed genome-wide, the SVs have higher selection pressure than the SNPs in the Y-chromosome. It is to be noted that though a woman does not have a Y-chromosome,
yet since Y-chromosome like any other chromosome is prone to crossing-over phenom-ena, there can be other chromosome which have sections of Y-chromosome DNA in it, and thus that is reflected in aligning the Y-chromosome to the whole genome of a fe-male with successful alignment at certain section, thereby enabling extraction of SNPs and SVs around the region aligned.
As the mitochondrial DNA (mtDNA) is known to have several copies in a cell, one would expect far higher coverage of mitochondrial DNA sequence than the rest of the genome, such as average of more than 12× in our case. The sequence assembly of mito-chondrial DNA thus will have far higher reliability, following which the downstream analysis as well. From the already existing knowledge of inheritance of mitochondrial DNA, one would expect all the SNPs and SVs successful calls in mother to be found in all the children as well, as mitochondrial DNA is known to be maternally inherited. This is because mitochondrial DNA material is present in the cytosol of a cell and not
Fig. 4Structural Variations as detected for the whole Genome
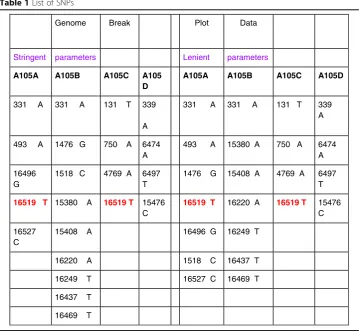
in the nucleus, and there is lesser possibility for the cytosol of the sperm cells to inte-grate with the cytosol of mother ova and is known to be destroyed at fertilization. So for determining maternal inheritance, ones mtDNA is the same as his mother’s mtDNA, which is the same as her mother’s mtDNA and so on. Our findings for A105 family analysis revealed contradicting results. Not all SNPs and SVs present in mother were found to be present in the children. In fact, there were cases found where a SNP was found to be present in father and a child but not in mother. Table1shows the list of SNPs and Table 2shows the list of SVs in A105 family. This proposes a new discov-ery that mitochondrial DNA can have paternal sources of inheritance as well, though they can also be a result of de-novo genetic changes rather than inheritance. Further, comparing Tables 1 and 2, it is discovered by observation that mitochondrial DNA is less prone to SVs than SNPs, and that can be possibly attributed to the fact that mito-chondrial DNA is not exposed to the phenomenon of crossing-over of genetic material as is the case with chromosomes. Further, the ratio of SVs bases calls to the size of gen-ome is significantly less for mitochondrial DNA (of the order of 2.35*10^-4) than for the whole genome (of the order of 2.5*10^-3), thereby providing further evidence that structural variations in mitochondrial DNA has higher selection pressure than the rest of the genome and is thus a more rare event in the mitochondria relative to the rest of genome. This ratio remains comparable to the rest of genome when considered for SNPs (of the order of 5.3*10^-4 for mitochondria and of the order of 8.0*10^-4 for whole genome). Though it has been already observed in banana that mitochondrial DNA can also be paternally inherited [23,24], this is the first time that the discovery of paternal inheritance possibility of mitochondrial DNA in humans is being reported by this article.
Further, as observed and stated above, since SVs have higher selection pressure than SNPs for the Y-chromosome, the SVs will serve as a better means for paternal ancestry
determination for a relatively longer time-span and the SNPs would serve better candi-date to determine paternal ancestry and divergence in a relatively shorter time-span.
Discussions
With the advent of rapid advancement of technology, coupled with decrease in cost of sequencing, it will not be long when every individual will carry their genome-chip which would be comprising of the set of chromosomal sequences, along with informa-tion of SVs and SNPs already determined. Many ventures have already started on this line to tap upon the opportunities that this changing world of medical informatics and genomics has to offer. In fact, this would be a practice which we might want to do early in the life of an individual say within a week after his birth. Let’s say we take it a step further and obtain the DNA sample from the fetus itself, thus being able to do analysis of the baby which is to be born. With the power of prediction and integrating it to powerful relational databases we can tell a-priori as to what are the chances of the baby to be healthy in general. We would be able to predict disease susceptibility of the new born baby as well as characteristic traits a-priori, thereby given an opportunity for the mother to decide whether to have the baby or not, and if so what all things she should be caring about.
Mitochondrial DNA and Y-chromosome DNA has been widely been used to deter-mine maternal and paternal ancestry respectively, such as in a recent findings for
Table 1List of SNPs
MT SNPs bases
Genome Break Plot Data
Stringent parameters Lenient parameters
A105A A105B A105C A105
D
A105A A105B A105C A105D
331 A 331 A 131 T 339
A
331 A 331 A 131 T 339 A
493 A 1476 G 750 A 6474 A
493 A 15380 A 750 A 6474 A
16496 G
1518 C 4769 A 6497 T
1476 G 15408 A 4769 A 6497 T
16519 T 15380 A 16519 T 15476 C
16519 T 16220 A 16519 T 15476 C
16527 C
15408 A 16496 G 16249 T
16220 A 1518 C 16437 T
16249 T 16527 C 16469 T
16437 T
16469 T
Native Americans and Indigenous Altaians [25]. Based on the discoveries above, it can thus be safely concluded that if we continue with ancestry determination by mitochon-drial DNA, then SVs would serve as better means to determine ancestry for a longer period than SNPs, as they are relatively more rare events. At the same time the SNPs of the mitochondria would serve as better candidate for the characteristic signature of the individual and can be used to determine ancestry and divergence for a relatively shorter period. Having said that, it would still be proposed that given that there is pos-sibility of mitochondrial DNA to be inherited by father as well, maternal ancestry deter-mination by mtDNA should be rephrased as simply ancestry deterdeter-mination by mtDNA. This will also mean that all the analysis which different scientists across the globe have been conducting so far assuming mtDNA to be totally maternally inherited will need a complete change in the understanding and knowledge generated. As it is confirmed that Y-chromosome is completely paternally inherited, ancestry determination by ‘Y line tests’as Y-chromosomes are confirmed to be totally inherited from the father is al-ways remain as a good methodology. The SNPs of the whole genome can also be used for generic ancestry and divergence determination.
The study was limited by the fact that there is limit to the length of the NGS reads and the coverage was kept to about 14× only. Although 14× coverage is far higher than the previous studies of 1000 genome project phase 1 which had lower coverage, future similar studies can be conducted with a coverage of a recommendation of 50× if
Table 2List of SVs in A105 family
MT SNPs bases
Genome Break Plot Data
Stringent parameters Lenient parameters
A105A A105B A105C A105
D
A105A A105B A105C A105D
331 A 331 A 131 T 339
A
331 A 331 A 131 T 339 A
493 A 1476 G 750 A 6474 A
493 A 15380 A 750 A 6474 A
16496 G
1518 C 4769 A 6497 T
1476 G 15408 A 4769 A 6497 T
16519 T 15380 A 16519 T 15476 C
16519 T 16220 A 16519 T 15476 C
16527 C
15408 A 16496 G 16249 T
16220 A 1518 C 16437 T
16249 T 16527 C 16469 T
16437 T
16469 T
genome assembly approach before analytics is to be deployed. The results of mtDNA analysis seemed to be not affected by these factors as there exists 1000s of copies of mtDNA in the cell anyways.
Conclusion
This research article improves our understanding of human genetics, variations in gen-ome, and inheritance. It provides us with new scopes to fetch relevant information and opens door for many newer technologies to be built based on the discoveries. Though we have made these observation for a single family data, it would be highly unlikely that many such similar experiments would not converge to same discoveries. Neverthe-less, it would be worthwhile to conduct population and ethnic or caste based studies and where possible combine it with authentic historical matrimonial records for rela-tional database queries obtaining meaningful results. The discoveries make us more equipped with statistical and robust, efficient and relatively less costly means to derive information such as sex determination, or immunologic response to disease, or success rate of organ transplant, or susceptibility to diseases and possible cure for them. The SVs and SNPs in HLA loci would also serve as a medical transformational method for determining the success of organ transplant for a patient, and predisposition to diseases apriori. With the advent of diploid genomes been made available in future with assem-blers being able to generate the diploid assembly as well, our understanding for genet-ics and disease will enhance further and thereby enable better and more reliable technologies to come in.
Abbreviations
CNV:Copy number variations; mtDNA: Mitochondrial deoxyribonucleic acid; SNPs: Single nucleotide variations; SVs: Structural variations
Acknowledgements
The author acknowledge support from the German Research Foundation (DFG) and Universität Leipzig within the program of Open Access Publishing.
Funding
The author is thankful to University of Leipzig for meeting the cost of publication.
Availability of data and materials
All supporting data are provided in this article.
Authors’contributions
All work, idea generation, coding, analysis of results and writing the paper has been done by the first author. All authors read and approved the final manuscript.
Authors’information
This will be provided once the article is accepted. Until then it is hidden to keep anonymity.
Ethics approval and consent to participate
The names of individuals participating in the research were kept anonymous, and their consent was taken for analysis work to be published. No medical outcome of the work was reported.
Consent for publication
Consent to publication was taken at the time when bio-samples were being collected.
Competing interests
The authors declare that they have no competing interests.
Publisher’s Note
Received: 28 January 2018 Accepted: 18 March 2018
References
1. 1000 Genomes Project Consortium, et al. A map of human genome variation from population scale sequencing. Nature. 2010;467:1061–73.
2. Mills, R.E. et al. Mapping copy number variation by population scale sequencing. Nature published online, doi:1:
https://doi.org/10.1038/nature09708(3 February 2011).
3. Sims D, Sudbery I, Ilott NE, Heger A, Ponting CP. Sequencing depth and coverage: key considerations in genomic analyses. Nat Rev Genet. 2014 Feb;15(2):121–32.https://doi.org/10.1038/nrg3642.
4. Fanciulli M, et al. FCGR3B copy number variation is associated with susceptibility fo systemic, but not organ-specific, autoimmunity. Nat Genet. 2007;39:721–823.
5. Aitman TJ, et al. Copy number polymorphism in Fcgr3 predisposes to glomerulonephritis in rats and humans. Nature. 2006;439:851–5.
6. Gonzalez E, et al. The influence of CCL3L1 gene-containing segmental duplications on HIV-1/AIDS susceptibility. Science. 2005;307:1434–40.
7. Fellermann K, et al. A chromosome 8 gene-cluster polymorphism with low human beta-defensin 2 gene copy number predisposes to Crohn disease of the colon. Am J Hum Genet. 2006;79:439–48.
8. Yang Y, et al. Gene copy-number variation and associated polymorphisms of complement component C4 in human systemic lupus erythematosus (SLE): low copy number is a risk factor for and high copy number is a protective factor against SLE susceptibility in European Americans. Am J Hum Genet. 2007;80:1037–54. 9. Hollox EJ, et al. Psoriasis is associated with increased beta-defensin genomic copy number. Nat Genet.
2008;40:23–5.
10. Feuk L, Carson AR, Scherer SW. Structural variation in the human genome. Nat Rev Genet. 2006;7:85–97. 11. Bodmer W, Bonilla C. Common and rare variants in multifactorial susceptibility to common diseases. Nat Genet.
2008;40:695–701.
12. Iafrate AJ, Feuk L, Rivera MN, Listewnik ML, Donahoe PK, Qi Y, Scherer SW, Lee C. Detection of large-scale variation in the human genome. Nat Genet. 2004;36:949–51.
13. Sebat J, Lakshmi B, Troge J, Alexander J, Young J, Lundin P, Maner S, Massa H, Walker M, Chi M, Navin N, Lucito R, Healy J, Hicks J, Ye K, Reiner A, Gilliam TC, Trask B, Patterson N, Zetterberg A, Wigler M. Large-scale copy number polymorphism in the human genome. Science. 2004;305:525–8.
14. Redon R, Ishikawa S, Firch KR, Feuk L, Perry GH, Andrews TD, Fiegler H, Shapero MH, Carson AR, Chen W, Cho EK, Dallaire S, Freeman JL, Gonzalez JR, Gratacos M, Huang J, Kalaitzopoulos D, Komura D, MacDonald JR, Marshall CR, Mei R, Montgomery L, Nishimura K, Okamura K, Shen F, Somerville MJ, Tchinda J, Valsesia A, Woodwark C, Yang F, et al. Global variation in copy number in the human genome. Nature. 2006;444:444–54.
15. Tuzun E, Sharp AJ, Bailey JA, Kaul R, Morrison VA, Pertz LM, Haugen E, Hayden H, Albertson D, Pinkel D, Olson MV, Eichler EE. Fine-scale structural variation of the human genome. Nature. 2006;444:444–54.
16. Khaja R, Zhang J, MacDonald JR, He Y, Josheph-George AM, Wei J, Rafiq MA, Qian C, Shago M, Pantano L, Aburatani H, Jones K, Redon R, Hurles M, Armengol L, Estivill X, Mural RJ, Lee C, Scherer SW, Feuk L. Genome assembly comparison identifies structural variants in the human genome. Nat Genet. 2006;38:1413–8.
17. Korbel JO, Urban AE, Affourtiti JP, Godwin B, Grubert F, Simons JF, Kim PM, Palejev D, Carriero NJ, Du L, Taillon BE, Chen Z, Tanzer A, Saunders AC, Chi J, Yang F, Carter NP, Hurles ME, Weissman SM, Harkins TT, Gerstein MB, Egholm M, Snyder M. Paired-end mapping reveals extensive structural variation in the human genome. Nat Genet. 2006;38:1413–8.
18. Kidd JM, Cooper GM, Donahue WF, Hayden HS, Sampas N, Graves T, Hansen N, Trague B, Alkan C, Antonacci F, Haugen E, Zerr T, Yamada NA, Tsang P, Newman TL, Tuzun E, Cheng Z, Ebling HM, Tusneem N, David R, Cillett W, Phelps KA, Weaver M, Saranga D, Brand A, Tao W, Gustafson E, McKernan K, Chen L, Malig M, et al. Mapping and sequencing of structural variation from eight human genomes. Nature. 2008;453:56–64.
19. Conrad DF, Pinto D, Redon R, Feuk L, Gokcumen O, Zhang Y, Aerts J, Andrews TD, Barnes C, Campbell P, Fitzgerald T, HuM ICH, Kristiansson K, Macarthur DG, Macdonald JR, Onyiah I, Pang AW, Robson S, Stirrups K, Valsesia A, Walter K, Wei J, Tyler-Smith C, Carter NP, Lee C, Scherer SW, Hurles ME. Origins and functional impact of copy number variation in the human genome. Nature. 2010;464:704–12.
20. Buchanan JA, Scherer SW. Contemplating effects of genomic structural variation. Genet Med. 2008;10:639–47. 21. Abhishek Narain Singh, Comparison of structural variation between build 36 reference genome and Celera R27c
genome using GenomeBreak, poster presentation, The 2nd symposium on systems genetics, Groningen, 29–30 September 2011.
22. Abhishek Singh, GENOMEBREAK: A versatile computational tool for genome-wide rapid investigation, exploring the human genome, a step towards personalized genomic medicine, poster 70, human genome meeting 2011, Dubai, March 2011.
23. Schwartz M, Vissing J. Paternal inheritance of mitochondrial DNA. N Engl J Med. 2002;347:576–80. 24. "Mitochondria can be inherited from both parents", New Scientist article on Schwartz and Vissing's report. 25. Dulik MC, Zhadanov SI, Osipova LP, Askapuli A, Gau L, Gokcumen O, Rubinstein S, Schurr TG. Mitochondrial DNA