R E S E A R C H P A P E R
Vitamin C supplementation modulates gene expression
in peripheral blood mononuclear cells specifically
upon an inflammatory stimulus: a pilot study in healthy subjects
Raffaella Canali• Lucia Natarelli•Guido Leoni• Elena Azzini•Raffaella Comitato• Oezgur Sancak• Luca Barella•Fabio Virgili
Received: 29 November 2013 / Accepted: 19 February 2014 / Published online: 7 March 2014 ÓThe Author(s) 2014. This article is published with open access at Springerlink.com
Abstract In order to study the effects of vitamin C sup-plementation on gene expression and compare its action between physiological and inflammatory conditions, a pilot study was set up utilizing microarray and qPCR technol-ogies. Five healthy volunteers were supplemented with 1 g vitamin C (RedoxonÒ) per day for five consecutive days. Peripheral blood mononuclear cells (PBMNC) were iso-lated before and just after the last supplementation, and RNA was isolated for the Affymetrix gene 1.0 ST chip analysis. PBMNC were also, ex vivo, treated with LPS, and gene expression was quantified by means of a ‘‘Human NFkB Signaling’’ qPCR array. Only a very moderate effect on the baseline gene expression modulation was associated with vitamin C supplementation. However, in spite of the limited number of subjects analyzed, vitamin C supple-mentation resulted in a markedly different modulation of gene expression upon the inflammatory stimulus, specifi-cally at the level of the MyD88-dependent pathway and of the anti-inflammatory cytokine IL-10 synthesis. This study suggests that vitamin C supplementation in healthy sub-jects, not selected according to a specific genetic profile, consuming an adequate amount of vitamin C, and having a satisfactory vitamin C plasma concentration at the baseline, does not result in a significant modification of gene
expression profile. Under this satisfactory micronutrient status, supplementation of vitamin C is ‘‘buffered’’ within a homeostatic physiological equilibrium. Differently, fol-lowing a second ‘‘hit’’ constituted of an inflammatory stimulus such as LPS, able to trigger a critical burst to the normal physiological state, the higher availability of ascorbic acid emerges, and results in a significant modu-lation of cell response.
Keywords CytokinesGene expressionInflammation PBMNCVitamin C
Abbreviations
AA Ascorbic acid BP Biological process MPA Metaphosphoric acid
PBMNC Peripheral blood mononuclear cells LPS Lipopolysaccharides
DHA Dehydroascorbic acid RBC Red blood cell WBC White blood cell
GCRMA GeneChip robust multiarray average
GO Gene ontology
FC Fold change
Introduction
Vitamin C or ascorbic acid (AA) is essential for life in humans as the capacity to synthesize it has been lost in course of our evolution. The physiological functions of AA are largely dependent on the oxidoreductive properties of this vitamin. Ascorbic acid (AA) acts as a cofactor in Cu R. Canali (&)L. NatarelliG. LeoniE. Azzini
R. ComitatoF. Virgili
Food and Nutrition Research Centre, Consiglio per la Ricerca e Sperimentazione in Agricoltura, Via Ardeatina 546,
00178 Rome, Italy
e-mail: [email protected]
O. SancakL. Barella
and Fe hydroxylase, and monooxygenase enzymes involved in the synthesis of collagen, carnitine, coagulation factor V, and neurotransmitters. Several studies have demonstrated that AA status is related to a decreased risk of a wide range of pathologies, such as stroke (Gale et al.
1995) or cardiovascular disease (Salonen et al. 2003). In this context, AA supplementation has been reported to ameliorate symptoms and to enhance the expression of specific immune response markers in clinical conditions (Wintergerst et al.2006). It is interesting to mention that most of the available studies addressing the effects of AA on human health considered the supplementation of this vitamin together with other nutrients (usually zinc or within a multivitamin–multimineral formula), while a real understanding of its mechanism of action would possibly require the supplementation as single components (Lyk-kesfeldt and Poulsen2010).
A role of vitamin C as an antioxidant molecule has also been recognized, largely based on in vitro studies. At present, available data supporting the role of ascorbic acid as an in vivo ‘‘reductant’’ are conflicting (Traber and Stevens2011). According to this hypothesis, vitamin C supplementation has been reported to decrease the steady-state level of oxidative DNA and lipid damage, in mononuclear blood cells of smoker and in guinea pigs (Moller et al.2004; Chen et al.2000); on the other hand, the administration of 1,000 mg of ascorbic acid plus alpha-tocopherol had no effects on oxidative stress and DNA damage in aged healthy adults (Retana-Ugalde et al. 2008). In general, acting as an ‘‘antioxidant,’’ AA would contribute in maintaining cellular and extracellular redox balance, thereby protecting against reactive oxygen species generated during cellular events characterized by an increased production of oxidant species, such as in the course of respiratory burst and inflammatory response.
However, more recently, the concept of ‘‘antioxidant molecules’’ has been reconsidered and their biological functions are no longer considered to be simply due to their ability to act as ‘‘electron donors;’’ rather, they appear to act by modulating signaling and gene expres-sion. In vivo and in vitro studies have shown that some of the effects associated with AA are at transcriptional level (Park et al. 2009; Shin et al. 2004; Belin et al. 2009). Despite a number of solid indications, the mechanism by which ascorbic acid affects gene expression is still unclear.
In order to gain a better understanding of the effects of vitamin C supplementation on gene expression in both physiological ‘‘homeostatic’’ conditions and in the pre-sence of a pro-inflammatory stimulus, we performed a pilot explorative intervention study based on the utilization of a
microarray approach and also designed to establish an ‘‘in vivo–ex vivo’’ structure.
Materials and methods
Study design
Five healthy subjects (three males and two females, aged 25–40) were recruited for a short-term (5 days) interven-tion study, in order to assess the effect of vitamin C on gene expression modulation.
Subjects were recruited among the employees of the Institute and provided written informed consent to par-ticipate in the study. All participants were in good health as determined by a medical history questionnaire and clinical laboratory tests. All subjects fulfilled the follow-ing eligibility criteria, they are as follows: (1) no history of chronic disease, (2) no antibiotic or supplemental vitamin or mineral use for 4 weeks before the beginning of the study, (3) nonsmoking, (4) low physical activity, and (5) no drugs or nonsteroidal inflammatory drugs (NSAID) for at least 10 days before and during the sup-plementation period. The study protocol was approved by the internal ethical committee and was in accordance with the Declaration of Helsinki 1975, as revised in 1983. Subjects were instructed to maintain their usual habits (diet and physical activity) during the 5 days of Vitamin C supplementation. The subjects were asked to abstain from eating vegetables, fruits, and drinking alcohol the evening before the day of blood withdrawals. Subjects were asked to assume one tablet of RedoxonÒ (Bayer) a day (containing 1 g of ascorbate), for 5 days. A baseline blood withdrawal was performed in fasting condition, just before the first vitamin C tablet. Tablets were provided to the volunteers, every morning at the same hour for the following 4 days of the study. The last tablet was sup-plemented about 1, 5 h before the second and last blood withdrawal, performed again in fasting condition. The duration of the supplementation and the time of the blood withdrawal after the last RedoxonÒ tablet were planned on the basis of previously published study (Jeng et al.
1996; Moller et al. 2004) in order to have a combination of a steady-state concentration and acute effects of cir-culating vitamin C.
autologous plasma: one was incubated with 10lg/ml lipopolysaccharides (LPS) (Sigma-Aldrich) for 5 h at 37°C. At the end of the incubation time, the medium was collected and stored at -80°C for the assessment of cytokine release in response to the inflammatory stimuli. RNA was extracted from the pelleted cells for gene expression analysis using the Human NFjB Signaling 96 StellARRrayTM qPCR array. Both microarray and the qPCR NFkappaB 96 gene card analysis have been per-formed according to the MIAME guidelines and deposited in NCBI Gene Expression Omnibus and are accessible through GEO series accession number GSE54477; more-over, data will be available in the Nutritional Phenotype Database (dbNP) (van Ommen et al.2010). Data obtained with PBMNC isolated after vitamin C supplementation (supplemented PBMNC) were compared to those obtained with PBMNC isolated before the supplementation (baseline PBMNC), for each subject.
Plasma vitamin C
Immediately after blood withdrawal, an aliquot of plasma was diluted with an equal amount of 10 % metaphosphoric acid with 2 mM EDTA to prevent the vitamin C oxidation and stored at-80°C for further uses. Total ascorbic acid (ascorbate and dehydroascorbic acid (DHA)) was extracted according to the method described by Margolis et al. (1997). Quantitative analysis was performed using an HPLC system coupled with a coulometric detector (ESA model 580; Chelmsford, MA, USA).
PBMNC isolation and treatment
PBMNC were isolated from blood by centrifugation in Ficoll gradient density (Ficoll-Paque PLUS, GE Health-care). Briefly, venous blood was obtained from the healthy volunteers and heparin was used as anticoagu-lant. Blood was centrifuged (1,5009g for 15 min) and plasma separated from RBC and WBC. RBC and WBC were suspended with RPMI 1640 w/o phenol red (Eu-roclone) (plus pen/strep, glutamine and w/o serum) and PBMNC isolated by centrifugation in Ficoll gradient density. After centrifugation (4009g for 30 min at 20°C), PBMNC-rich pellet was recovered and washed in PBS. PBMNC preparation was checked for cell purity and total count.
Microarray analysis
RNA extraction from PBMNC isolated from each sub-jects before and after the vitamin C supplementation was
performed using RNAeasyÒ Plus Mini kit (Qiagen) according to the manufacturer’s protocol. Concentration, purity, and integrity were assessed using the Agilent 2100 bioanalyzer (Agilent Technologies), before gene expression analysis. About 2lg of each isolated RNA samples was sent to the Institute of Molecular Oncology Foundation (IFOM, Milano), to be processed and hybridized on Gene 1.0 ST array chips according to Affymetrix protocol. These arrays allow the assessment of the expression level of 28,869 genes represented by approximately 26 probes spread across the full length of the gene, providing a complete and accurate picture of gene expression than the classical 30-based expression array designs. Cell intensity files for each Gene 1.0 ST chip processed were generated utilizing Command Console software. The lists of significantly modulated genes were analyzed by using a DAVID Web server in order to identify statistically overrepresented biological processes annotated in Gene Ontology (GO) (Huang et al. 2009). Enriched GO biological processes (level 5) were identified according to p value threshold\0.05 and clusterized utilizing the ‘‘Functional Annotation Clus-tering’’ tool included in DAVID. Representative pathway categories from the most statistically significant clusters were manually selected and listed as they appear in Table1.
Real-time PCR
A total of 1lg of isolated RNA samples was reverse-transcribed into cDNA using the iScriptTM Reverse Transcription Supermix (Bio-Rad) to confirm the expres-sion of 6 genes upregulated in the Affymetrix assay. The quantification of gene expression was determined by real-time PCR (qPCR) with the 7500 Fast Real-Time PCR System (Applied Biosystem) using the iTaqTM Fast SYBRÒGreen Supermix with ROX (Bio-Rad). Data were collected using the 7500 Software version 2.0.5 and given as threshold cycle (Ct). Ct values for each target and reference genes were obtained, and their difference was calculated (DCt). Primer efficiencies for the test genes and the reference genes were similar. The comparative cal-culation, DDCt, was used to find the difference in the expression level between supplemented and baseline PBMNC. qPCR was also used to determine the expression of the cytokines, IL1A, IL1B, IL6, IL8, IL10, and TNFa
in supplemented or baseline PBMNC, treated with LPS. Data are expressed as the mean of log2 of fold change (FC).
NF-jB-dependent gene expression
A total of 1lg of RNA isolated from baseline or supple-mented PBMNC, stimulated with LPS, was reverse-tran-scripted to analyze the expression of around 90 genes related to NF-jB pathway using the Human NFkB Signaling 96 StellARrayTMqPCR array (Lonza) according to the manu-facturer’s protocol. The quantification of gene expression was determined by qPCR as described before. Data are expressed as the mean of log2 of FC. Fold change (FC) threshold was set at±1. The resulting differentially expressed genes were mapped to KEGG pathways in order to highlight specific pathways involved upon vitamin C treatment.
Cytokines
Medium collected from PBMNC cultured with LPS was utilized to evaluate the expression and release of 12 dif-ferent cytokines (IL1A, IL1B, IL2, IL4, IL6, IL8, IL10, IL12, IL17A, IFNc, TNFa, and GM-CSF) by a Multi-Analyte ELISArrayTM kit (SABiosciences) according to the manufacturer’s protocol.
Statistical analysis
Microarray statistical analysis was performed utilizing OneChannel GUI R package (Sanges et al. 2007). Raw signal intensities were normalized utilizing GeneChip robust multiarray average (GCRMA) method employing the empirical Bayes approach for background correction followed by quantile normalization. Differentially expres-sed genes were identified using the ‘‘limma package,’’ applying linear models and moderated t statistics that implement empirical Bayes regularization of standard errors. Differences in expression values were expressed by
mean of log2 of FC. A minimum difference threshold of FC±0.5 with ap valueB0.05 was selected as gene dif-ferentially expressed in supplemented PBMNC with respect to baseline PBMNC.
Data obtained with vitamin C, qPCR, and ELISArray were analyzed using a paired Student’sttest.
The threshold for significance was set atp\0.05 for all studies.
Results
Plasma total ascorbic acid
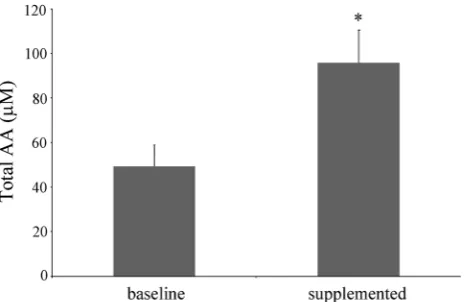
Vitamin C is present in plasma and tissue mainly in its reduced state, i.e., ascorbate. However, it can be reversibly oxidized to DHA. Both forms have been measured in plasma, indicating that the majority of vitamin C was present in the reduced ascorbate form, while DHA was detectable in very small to negligible amounts (data not shown). As shown in Fig.1, vitamin C administration almost doubled the mean plasma ascorbic acid concentration from the mean baseline concentration of 49.4±9.6 to 95.8±14lM at the end of the 5 days of supplementation period.
Effect of vitamin C on gene expression: microarray results
Microarray data indicate that 5 days of vitamin C supple-mentation induce a differential expression of only 1 gene, calnexin (CANX), which was upregulated by a FC value of 1.13 (p\0.05, Table1).
Usually, gene expression studies, assume a FC value higher than 1 as indicative of a ‘‘bona fide’’ biological difference. On the other hand, we can hypothesize that in Canx-(1) FW: 50TCCGCCTCTCTCTTTACTGC30 RV: 50CATGATCTCTAGCCTCCCGG30
Canx-(2) FW: 50CGGCACGTGACGGTCGG30 RV: 50CCTTCCATGATCTTGCCCCGC30
FAU FW: 50CTCCTGTTTGGCCACCTTAG30 RV: 50CTACCCTGGAAGTAGCAGGC30
EIF3D FW: 50TCGCTGAGAGTCCAGCTTCT 30 RV: 50AACGGGGAAGTGTCCTTCAT30
IK FW: 50ACGTGACTTAGAAGGTGGTGC30 RV: 50TGATCCTCACTCCTTCCACC30
EIF4G2 FW: 50CGGCTTGACAACGAAGAATC 30 RV: 50GGTGGCAGCTGCTGAGTT30
NPM1 FW: 50GGCGCTTTTTCTTCAGCTT30 RV: 50GGTCTGCCCCTGGAGGT30
IL1A FW: 50CCGTGAGTTTCCCAGAAGAA30 RV: 50ACTGCCCAAGATGAAGACCA 30
IL1B FW 50AAGCCCTTGCTGTAGTGGTG30 RV: 50GAAGCTGATGGCCCTAAACA30
IL6 FW: 50GTCAGGGGTGGTTATTGCAT30 RV: 50AGTGAGGAACAAGCCAGAGC 30
IL8 FW: 50AAATTTGGGGTGGAAGGTT30 RV: 50TCCTGATTTCTGCAGCTCTGT 30
IL10 FW: 50CTCATGGCTTTGTAGATGCCT30 RV: 50GCTGTCATCGATTTCTTCCC30
TNFa FW: 50AGATGATCTGACTGCCTGGG30 RV: 50CTGCTGCACTTTGGAGTGAT30
HPRT FW: 50TTAATGTAATCCAGCAGGCAGC30 RV:50CTCATGGACCTGATTATGGACAGG30
Table 1 Effect of vitamin C supplementation on gene expression level in PBMNC, assessed by means of Affymetrix and qPCR platforms
Official gene symbol
Gene name Affymetrix Representative pathwaysc QPCR
FCa pvalueb FCd pvaluee
CANX Calnexin 1.13 0.0014 Chromatin organization
CANX(1) Calnexin1 Chromatin organization 0.18±0.12 N.S.f
CANX(2) Calnexin2 Chromatin organization 0.53±0.37 0.021
ARF3 ADP-ribosylation factor 3 0.98 0.0003 Chromatin organization
SMNDC1 Survival motor neuron domain containing 1
0.95 0.0054 Chromatin organization
RPS24 Ribosomal proteinS24 0.89 0.0015 Chromatin organization
MYST2 Histone acetyltransferase MYST2 0.87 0.0320 Chromatin organization; ribonucleoprotein complex biosynthesis
NONO Non-POU domain containing 0.81 0.0040 Ribonucleoprotein complex biosynthesis; RNA processing
ZNF259 Zinc finger protein 259 0.81 0.0017 Ribonucleoprotein complex biosynthesis; RNA processing
FNTA Farnesyl-protein transferase alpha subunit
0.79 0.0041 Ribonucleoprotein complex biosynthesis; translation; RNA processing
Y_RNA Small noncoding RNA components of the Ro ribonucleoprotein
0.77 0.0101 Ribonucleoprotein complex biosynthesis; translation; RNA processing
HRH4 Histamine receptor H4 0.74 0.0191 Ribonucleoprotein complex biosynthesis; translation; RNA processing
IK IK cytokine 0.73 0.0234 Ribonucleoprotein complex synthesis 0.15±0.44 N.S.
CTLA4 Cytotoxic T-lymphocyte antigen 4 0.7 0.0234 RNA processing
U1 0.68 0.0045 RNA processing
5S_rRNA RRNA 0.68 0.0325 translation
EIF3D Eukaryotic translation initiation factor 3, subunit D
0.66 0.0018 Translation 0.008±0.43 N.S.
EIF4G2 Eukaryotic translation initiation factor 4 gamma
0.66 0.0085 Translation 0.24±0.19 N.S.
FAU Finkel–Biskis–Reillymurine sarcoma virus (FBR-MuSV)
0.66 0.0310 0.66±0.16 0.008
SART3 Squamous cell carcinoma antigen recognized by T cell 3
0.64 0.0140
AC068228.1 tRNA pseudogene 0.63 0.0016
RPL11 Ribosomal protein L11 0.62 0.0045
C11orf58 Small acidic protein 0.61 0.0234
C1D Nuclear receptor co-repressor 0.6 0.0288
HINT1 Adenosine 50-monophosphoramidase 0.57 0.0212
CBX3 Heterochromatin protein 1 homolog gamma
0.54 0.0129
NPM1 Nucleophosmin 1 0.53 0.0090 0.25±0.75 N.S.
RPS7 40S Ribosomal protein S7 0.52 0.0186
HIST1H2BB Histone H2B type 1-B -0.57 0.0254
SNORA42 Small nucleolar RNA -0.65 0.0069
RNU5E RNA, U5E small nuclear -0.86 0.0116
AC025562.1 ScRNA pseudogene -0.55 0.0210
AL139097.1 RRNA pseudogene -0.52 0.0086
AL138832.1 RRNA pseudogene -0.61 0.0023
AP003461.5 Mt tRNA pseudogene -0.51 0.0036
AC105285.2 ScRNA pseudogene -0.56 0.0297
the absence of deficiency conditions, an extra intake of a micronutrient normally consumed, only induces minute variations of gene expression on a quantitative scale, possibly resulting in a significant biological effect over a large window of time (Sanderson et al.2008; Swali et al.
2011). We have therefore lowered the threshold to 0.5 log units, in order to characterize small quantitative changes, though statistically significant, that can be considered indicative of biological effects associated with vitamin C supplementation in healthy subjects. The adoption of this criteria lead to the identification of 39 genes modulated by vitamin C supplementation, including 9 pseudogenes characterized by a lack of functionality at protein level. The analysis of biological process (BP) enrichment indi-cates that 16 out of the 39 genes (around 40 %) mainly belong to BP related to ribonucleoprotein complex bio-synthesis, translation, RNA processing, and chromatin organization pathway (Table1).
qPCR analysis
qPCR is the most sensitive and reproducible method to measure gene expression level. Several studies reported a good agreement between microarray and qPCR data, with correlation coefficients ranging from 0.69 to 0.80 (Dallas et al. 2005; Gyorffy et al. 2009). However, correlation coefficients decrease with decreasing in the degree of change of gene expression. Commonly, a single fold change (expressed as a difference in log2) is reported as the ‘‘cutoff’’ to a good correlation between microarray and qPCR data (Morey et al.2006; Dallas et al.2005).
As mentioned above, the setting of FC threshold at 0.5 allowed the identification of 39 genes modulated in vivo by AA. qPCR analysis was used to confirm the modulation of the expression of 6 genes (CANX, FAU, EIF3D, NPM1, IK, and EIF4G2) identified by microarray.
As shown in Table1, a differential expression of only 2 genes, out of the subset of 6 genes analyzed, was confirmed to be statistically significant with apvalue lower than 0.05 (FAU and CANX).
FAU is a gene that encodes for a fusion protein con-sisting of the ubiquitin-like protein fubiat the N terminus and ribosomal protein S30 at the C terminus (Pickard et al.
2011). Calnexin is a member of a family of molecular chaperones, assisting protein assembly and/or the retention within the endoplasmic reticulum of unassembled protein subunits (Wu et al.2006). In particular, the FC expression of FAU (0.66) obtained by microarray was confirmed by qPCR; on the other hand, the differential expression value obtained for CANX gene by qPCR (0.53) was lower in comparison with the result obtained by microarray (1.13). Two transcript variants encoding for the same calnexin protein have been described (refseq code=NM_001746.3 CANX(1); NM_001024649.1 CANX(2)). Since gene array probesets do not allow to distinguish the expression of the Fig. 1 Plasma concentration of total ascorbic acid (AA) before and
after the supplementation. *Significantly differentp\0.05 compared to baseline
Table 1continued
Official gene symbol
Gene name Affymetrix Representative pathwaysc QPCR
FCa pvalueb FCd pvaluee
AL953889.1 ScRNA pseudogene 0.52 0.0356
RP11613C6.4 Processed pseudogene 0.75 0.0390
AL353774.1 tRNA pseudogene 0.55 0.0408
a Data are expressed by mean of log2 fold change (FC). FC threshold cutoffB C0.5
b Statistical significance of differences in microarray expression between supplemented PBMNC and baseline PBMNC, estimated by ANOVA
test (p\0.05)
c The overrepresented biological pathway was identified by DAVID functional annotation clustering tool
d Data are expressed as mean±SD of log2 of fold change (FC)
e Statistical significance of differences in gene expression between supplemented PBMNC and baseline PBMNC, estimated by paired Student’s
ttest (p\0.05; threshold cutoffB C0.5)
two variants, we utilized two different sets of primers in order to discriminate the expression of the two variants by qPCR. After this technical refinement, we were able to
identify a significant upregulation of the CANX(2) isoform, while the CANX(1) variant that represents the longest 4,953 bp transcript was not significantly modulated by Table 2 Effect of LPS on gene expression level in PBMNC before and after vitamin C supplementation, analyzed using Human NFjB Signaling 96 STELLARRAYTMqPCR array
Official gene symbol
Gene name Baseline
PBMNC
pvaluea Supplemented PBMNC
pvaluea
FC FC
BCL3 B-cell leukemia/lymphoma 3 2.08±0.78 1910-3 1.88±0.51 5910-4
EGR1 Early growth response 1 -3.01±0.61 8910-4 -3.99±0.88 9910-6
EIF2AK2 Eukaryotic translation initiation factor 2-alpha kinase 2 2.64±0.89 3910-3 2.84±0.99 3910-4
FOS Proto-oncogene c-Fos -4.52±1.29 6910-4 -5.88±0.80 1.5910-7
IRAK2 Interleukin-1 receptor-associated kinase 2 2.74±1.04 3910-3 2.77±0.61 7910-4
MAP2K6 Mitogen-activated protein kinase kinase 6 -3.33±1.16 1910-3 -3.36±1.18 1910-4
MAP3K3 Mitogen-activated protein kinase kinase kinase 3 -1.35±0.76 1910-2 -1.64±0.57 5910-4
MAPK11 Mitogen-activated protein kinase 11 2.25±0.58 6910-4 2.40±0.45 2910-5
MAPK3 Mitogen-activated protein kinase 3 -1.14±0.46 3910-2 -1.81±0.41 6910-3
NFKB1 Nuclear factor NF-kappa-B p105 subunit 2.64±0.43 1910-4 2.36±0.17 3910-6
NFKB1A NF-kappa-B inhibitor alpha 1.82±0.62 6910-3 1.07±0.88 3910-2
NFKB2 Nuclear factor NF-kappa-B p100 subunit 2.33±0.18 1910-5 2.02±0.52 9910-4
STAT1 Signal transducer and activator of transcription 1-alpha/beta 3.69±0.86 4910-5 3.82±0.18 4910-8
TIFA TRAF-interacting protein with forkhead-associated domain 1.97±0.60 1910-3 1.84±0.53 1910-5
TNFAIP3 Tumor necrosis factor, alpha-induced protein 3 1.43±0.55 4910-3 1.30±0.50 1910-3
TNIP2 TNFAIP3-interacting protein 2 1.05±0.52 1910-2 1.10±0.35 8910-3
TRAF3IP2 Adapter protein CIKS 2.04±1.06 1910-3 2.25±0.57 2910-3
IL1A Interleukin-1 alpha 6.10±2.83 8910-3 5.84±1.68 1910-3
IL1B Interleukin-1 beta 3.47±1.61 8910-3 3.16±1.07 3910-3
IL6 Interleukin-6 9.24±2.36 9910-4 10.02±1.48 1910-4
IL8 Interleukin-8 2.66±1.70 2910-2 2.43±1.33 1910-2
IL10 Interleukin-10 3.30±1.42 3910-3 3.02±0.96 1910-3
CFLAR CASP8 and FADD-like apoptosis regulator precursor 1.05±0.4 6910-3 0.92±0.34 N.Sb
MAP2K3 Mitogen-activated protein kinase kinase 3 1.83±0.81 2910-3 0.97±1.41 N.S.
MAP3K7IP1 Mitogen-activated protein kinase kinase kinase 7-interacting protein 1
0.017±0.60 N.S. -1.04±0.45 1910-2
MAP3K8 Mitogen-activated protein kinase kinase kinase 8 2.89±0.88 2910-3 2.1±2.27 N.S.
MAPK14 Mitogen-activated protein kinase 14 -0.82±0.94 N.S. -1.19±0.71 3910-2
MYD88 Myeloid differentiation primary response protein MyD88 1.12±0.40 6910-3 0.5±0.46 N.S.
PPP1R13L RelA-associated inhibitor -0.49±0.87 N.S. -1.18±0.66 2910-2
RELB Transcription factor RelB 2.68±1.22 5910-3 1.24±0.53 7910-4
TICAM1 Toll-like receptor adaptor molecule 1 1.37±0.59 2910-2 0.94±0.61 N.S.
TIRAP Toll-interleukin 1 receptor (TIR) domain containing adaptor protein
-0.47±0.21 N.S. -1.00±0.41 7910-3
TNFRSF11A Tumor necrosis factor receptor superfamily member 11A precursor
-1.32±1.13 N.S. -3.24±0.82 3910-4
TRADD Tumor necrosis factor receptor type 1-associated DEATH domain protein
1.51±0.67 1910-2 0.89±0.32 N.S.
TNF-a Tumor necrosis factor-alpha 2.75±0.83 2910-3 1.26±1.55 N.S.
ZAP70 Tyrosine-protein kinase ZAP-70 -0.23±0.26 N.S. -1.11±0.45 8910-3
Data are expressed by mean±SD of log2 fold change (FC) (FC threshold cutoffBC1)
a Statistical significance of differences in gene expression between LPS treated and control both in baseline and supplemented PBMNC,
estimated by paired Student’sttest (p\0.05)
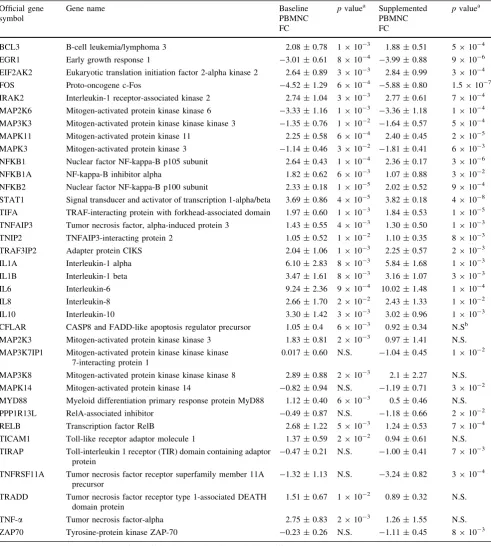
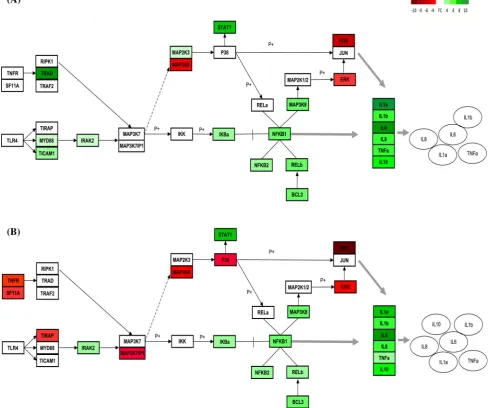
vitamin C supplementation. These observations suggest that the total number of genes significantly modulated by AA is even lower than that provided by the microarray analysis and that vitamin C supplementation in healthy, well-nour-ished subjects is associated with a very modest effect on gene expression under normal physiological conditions. Vitamin C supplementation modulates gene expression inflammatory response in PBMNC treated with LPS In order to assess the effect of vitamin C supplementation on cell response to an inflammatory stimulus, PBMNCs isolated before and after vitamin C supplementation were incubated in the presence of 10 % autologous plasma (containing 49.4±9.6 and 95.8±14lM 0 ascorbate in baseline and supplemented plasma, respectively) with or without LPS for 5 h. As mentioned above, the presence of 10 % autologous plasma during the incubation of PBMNC with LPS was set in order to have a combinatory effect of the steady-state concentration of cellular vitamin C with the plasmatic AA concentration. At the end of the treatment, the expression of about 90 genes was simultaneously assessed by qPCR using a stellARrayTMsystem. Setting a threshold BC ±1 and p\0.05, LPS treatment was found to be associated with a significant modulation of 22 genes, shared by PBMNC collected before and after Vitamin C supple-mentation (Table2). On the other hand, seven genes were significantly upregulated by LPS only in PBMNC isolated before vitamin C supplementation (CFLAR, MAP2K3, MAP3K8, MYD88, TICAM1, TNF-a, and TRADD). Moreover, after AA supplementation, the upregulation of RELB gene was significantly inhibited by 1.43-fold. On the other hand, 6 genes were significantly downregulated by LPS only in PBMNC isolated after AA supplementation, (TNFRSF11A, MAP3K7IP1, MAPK14, PPP1R13L, TI-RAP, and ZAP70) (Table2). Most of the genes differen-tially regulated by LPS in PBMNC, isolated before and after AA supplementation, are involved in the toll-like receptor signaling pathway (hsa 04620) in agreement with the ana-lysis performed with the Kegg anaana-lysis tool.
Effect of vitamin C supplementation on cytokine release in PBMNC challenged with LPS
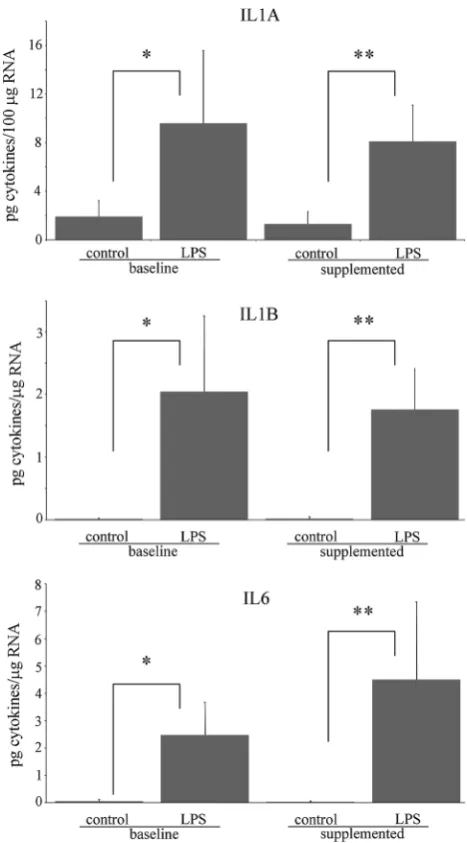
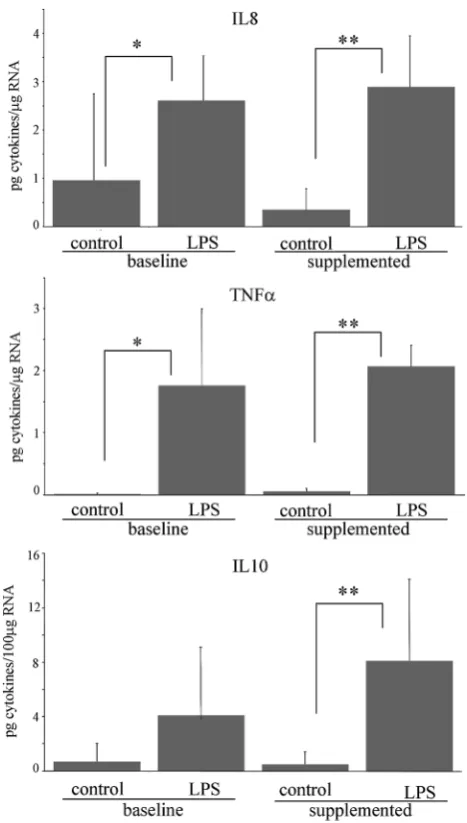
In order to study the effect of vitamin C supplementation on cytokine release induced by LPS, the release of 12 different cytokines was measured in the medium collected at the end of the incubation. Our results indicate that LPS activates the synthesis and release of the cytokines IL1A, IL1B, IL6, IL-8, and TNF-a, both in PBMNC isolated before and after vitamin C supplementation (Figs.2,3). A significant release of cytokine IL-10 in comparison with control was associated with LPS treatment only in PBMNC
isolated after AA supplementation (Fig. 3). On the other hand, cytokines IL2, IL4, IL12, IL17A, and GM-CSF were not released in the medium at the end of the incubation with LPS both in supplemented and baseline PBMNC.
Discussion
deficiency and the associated disease, scurvy (Frei et al.
2012). The revised European RDA for vitamin C is 80 mg/ day (European Commission 2008). Vitamin C absorption is tightly controlled. In fact, plasma concentration unlikely exceeds 100lM, after massive oral consumption (Levine et al.1996). Concentration of serum AA higher than 28lM is considered to be adequate, while amount lower than 11lM would indicate vitamin C deficiency (Jacob1990). Irrespective of the amount of vitamin C consumed, plas-matic ascorbate concentration is usually low in smokers (Alberg 2002) and in patients with pancreatitis, acute myocardial infarction, and diabetes (Bonham et al. 1999) (Riemersma et al. 2000) (Price et al. 2001). Moreover, nonfunctional genotypes of the glutathione S-transferase
enzyme (GSTT1 and/or GSTM1) are associated with a higher risk of serum vitamin C deficiency (Cahill et al.
2009). In our study, the mean baseline concentration of AA measured in the healthy volunteers was 49lM, indicating an adequate ‘‘vitamin C status.’’ A dietary intake of 60 mg/ day vitamin C has been shown to correspond to a median plasma concentration around 40lM in healthy subjects (Levine et al. 1996). On the other hand, at the end of the supplementation, plasmatic AA increased in all the subjects up to about 95.8lM.
The metabolic and biochemical properties of AA have been extensively documented. Most of them are directly associated with the chemical nature and reducing activity of the molecule. While some vitamins (such as vitamins A, D, or E) have been demonstrated to act as signaling mol-ecules, the role of AA in gene expression modulation is still largely unknown. Ascorbic acid (AA) has been shown to regulate the expression of genes encoding extracellular matrix proteins and to stimulate procollagen mRNA at transcriptional level (Ronziere et al. 2003; Chojkier et al.
1989). Moreover, AA downregulates the expression of genes necessary for S-phase progression and induces necrotic cell death in primary cultured fibroblasts (Belin et al.2009). So far, no data are available on the effect of AA supplementation on gene modulation in circulating leukocytes. In the present study, we made a broad spectrum analysis to detect the effects of a supplementation of vitamin C on circulating WBC at molecular level, utilizing a microarray technology.
In our study, vitamin C supplementation had a very small effect on gene expression profile in PBMNC. Even considering a FCBC0.5, rather than a most utilized thresholdBC1, only few genes resulted to be modulated in all the 5 subjects recruited, mainly involved into the BP related to ribonucleoprotein complex biosynthesis, trans-lation, RNA processing, and chromatin organization path-way. Moreover, data obtained by gene array were not fully confirmed by qPCR analysis. This discrepancy supports the limits of sensitivity of microarray technology as compared to qPCR and confirms the low degree of changes induced by AA on PBMNC under normal physiological conditions. The limited entity of differences in observed FC, the small number of genes affected by vitamin C supplementation, and low the power value (0.07) calculated for the micro-array study suggest that in physiological condition, the few differently expressed genes observed after supplementation have a very small (if any) biological relevance.
In order to better identify a specific cellular response associated with vitamin C supplementation, PBMNC obtained before and after vitamin C supplementation were stimulated with a pro-inflammatory second ‘‘hit’’ consti-tuted of an exposure to LPS. It is known that LPS induces a strong response in immune system, and acting as an Fig. 3 Effect of LPS on IL8, TNFa, and IL10 release in PBMNC
endotoxin, it binds the CD14/TLR4/MD2 receptor com-plex, promoting the secretion of pro-inflammatory cyto-kines in different cell types (Chow et al.1999). The role of vitamin C in immune function has been widely studied in the last 3 decades (Wintergerst et al. 2006) (Webb and Villamor2007) (Jacob et al. 1991). Beside its antioxidant properties and its role in collagen synthesis, vitamin C has been shown to improve phagocytic function and has an immunomodulatory effect on lymphocyte cells (Anderson et al. 1980). It also has been shown that large doses of vitamin C might markedly lower blood histamine concen-trations, which is inversely associated with leukocyte chemotaxis (Johnston et al.1994). Vitamin C deficiency is associated with a decreased resistance to diseases and some evidence suggests that it might have antiviral activity in
humans (Mortola et al. 1998) (Jariwalla and Harakeh
1998). In fact, vitamin C is frequently used in the treatment and prevention of common cold (Heimer et al. 2009). A recent meta-analysis of well-conducted clinical studies finally concluded that vitamin C administration provides a significant benefit on duration and severity of common cold (Douglas et al. 2007).
Vitamin C has been shown to play a significant role in the regulation of inflammatory response, but its effect on inflammatory response is controversial. It has been repor-ted (Wannamethee et al. 2006) that vitamin C status and the consumption of vitamin C-rich food items (fruits and vegetables) is associated with lower inflammatory bio-markers in men with no history of cardiovascular disease or diabetes. Oral vitamin C has also been reported to
Fig. 4 Description of LPS-dependent gene expression modulation within MyD88-dependent pathway in PBMNC.aBefore the supple-mentation,bafter the supplementation. Rectangles represent FC of
downregulate some proinflammatory mediators in smokers bearing apoE4 allelic variant (Majewicz et al. 2005). On the other hand, other studies were not able to observe any association between vitamin C supplementation and the secretion of inflammatory cytokines, ox-LDL (Lu et al.
2005), or on the oxidative/antioxidative stress and inflam-matory markers in hemodialysis patients (Fumeron et al.
2005). Similarly, other reports indicate that vitamin C has no effect on TNF and prostaglandin E2 production induced by LPS (Jeng et al.1996). Previous studies have shown that vitamin C has an immunomodulatory activity by inhibiting the LPS-induced number of monocytes producing IL-6 and TNF-alpha (Hartel et al.2004).
Our data showed that after 5 h of incubation with LPS, the expression of several genes involved in toll-like receptor pathway, in particular the MYD88-dependent pathway (Fig.4, panel a), is induced in PBMNC isolated before AA supplementation. This event is in turn associ-ated with the activation of NF-jB transcription factor and MAPK signaling cascades, finally resulting in the increase in the expression of mRNA encoding for TNF-a, IL-1B, IL1A, IL6, and IL8 (Underhill and Ozinsky 2002; Chow et al. 1999). The treatment of PBMNC with LPS also induced the release of the cytokines, IL1A, IL1B, IL6, IL8, and TNF-a in the medium, indicating that mRNA tran-scription that anticipates the synthesis and release of these proteins was already active during the first stages of the pro-inflammatory treatment.
LPS activation of PBMNC isolated after vitamin C supplementation was associated with an evident decrease in the early steps of Myd88 pathway and, ultimately, to the decrease in TNF-a mRNA transcription (Fig.4, panel b). In fact, the expression of MYD88, TICAM1, and MAP2K3 and TNFa levels were comparable to those observed in unstimulated cells (Table2). Moreover, vitamin C sup-plementation was associated with a downregulation of TIRAP, P38 and MAP3K7IP1, and to a decreased activa-tion of RELB.
The pattern of cytokine release associated with LPS treatment was similar before and after the supplementation, with the exception of IL-10 that was not significantly detectable in the medium of PBMNC isolated before the supplementation. IL10 is considered an anti-inflammatory cytokine by virtue of its inhibitory activity on cytokine synthesis. In fact, IL-10 synthesis is a relatively late event in comparison with other monokines (Wang et al.1994). Once synthesized and released, this cytokine can limit or terminate the inflammatory responses by inhibiting pro-inflammatory cytokine production either as mRNA accu-mulation or protein release (Wang et al. 1994; de Waal et al.1991; Rajasingh et al.2006), allowing an appropriate balance between pro- and anti-inflammatory effectors. Moreover, one of the proposed molecular mechanisms
associated with IL-10 anti-inflammatory activity is the regulation of MYD88-dependent pathway (Chang et al.
2009). Our results indicate that at 5 h from LPS treatment, IL-10 is already present in the culture medium of the PBMNC isolated after vitamin C supplementation. Our data also suggest the presence of an early activation of IL-10 synthesis associated with the presence of vitamin C that could result in a different modulation of genes involved in MYD88-dependent pathway (Fig.4).
As already mentioned in the introduction, this study has an ‘‘exploratory’’ nature, aimed to provide a conceptual background for a further exploitation of the understanding of the mechanisms of the molecular effects of AA. In fact, in spite of the limited number of subjects analyzed, a sig-nificant specific modulation of cell response to inflamma-tion has been observed.
In conclusion, our study suggests that vitamin C sup-plementation in healthy subjects, not selected according to a specific genetic profile predisposing to high vitamin needs, consuming an adequate vitamin C amount, and therefore having a satisfactory vitamin C plasma concen-tration, is not associated with a significant change in gene expression profile. This is possibly also true for a number of bioactive molecules either belonging to the family of established micronutrients (vitamins and minerals) or to the less characterized family of the so-called bio-active mol-ecules (e.g., polyphenols). Under this ‘‘satisfactory nutri-tional status,’’ also important supplementations (such as 1 g vitamin C supplementation) are not immediately evi-dent and are ‘‘buffered’’ within a homeostatic physiological equilibrium. Differently, following a second ‘‘hit’’ such as the one considered in the ex vivo part of our study con-stituted of the inflammatory stimulus LPS, able to trigger a critical burst to the normal physiological state, the higher availability of ascorbic acid emerges, and results in a sig-nificant modulation of cell response (Muller and Kersten
2003).
Acknowledgments The research was supported by Bayer Con-sumer Care AG, Basel, Switzerland.
Conflict of interest Oezguer Sancak and Luca Barella work at Bayer Consumer Care AG. Other authors declare that they have no conflicts of interest.
Open Access This article is distributed under the terms of the Creative Commons Attribution License which permits any use, dis-tribution, and reproduction in any medium, provided the original author(s) and the source are credited.
References
Anderson R, Oosthuizen R, Maritz R, Theron A, Van Rensburg AJ (1980) The effects of increasing weekly doses of ascorbate on certain cellular and humoral immune functions in normal volunteers. Am J Clin Nutr 33(1):71–76
Belin S, Kaya F, Duisit G, Giacometti S, Ciccolini J, Fontes M (2009) Antiproliferative effect of ascorbic acid is associated with the inhibition of genes necessary to cell cycle progression. PLoS ONE 4(2):e4409. doi:10.1371/journal.pone.0004409
Bonham MJ, Abu-Zidan FM, Simovic MO, Sluis KB, Wilkinson A, Winterbourn CC, Windsor JA (1999) Early ascorbic acid depletion is related to the severity of acute pancreatitis. Br J Surg 86:1296–1301
Cahill LE, Fontaine-Bisson B, El-Sohemy A (2009) Functional genetic variants of glutathioneS-transferase protect against serum ascor-bic acid deficiency. Am J Clin Nutr 90(5):1411–1417. doi:10. 3945/ajcn.2009.28327
Chang J, Kunkel SL, Chang CH (2009) Negative regulation of MyD88-dependent signaling by IL-10 in dendritic cells. Proc Natl Acad Sci USA 106(43):18327–18332. doi:10.1073/pnas. 0905815106
Chen K, Suh J, Carr AC, Morrow JD, Zeind J, Frei B (2000) Vitamin C suppresses oxidative lipid damage in vivo, even in the presence of iron overload. Am J Physiol Endocrinol Metab 279(6):E1406–E1412
Chojkier M, Houglum K, Solis-Herruzo J, Brenner DA (1989) Stimulation of collagen gene expression by ascorbic acid in cultured human fibroblasts. A role for lipid peroxidation? J Biol Chem 264(28):16957–16962
Chow JC, Young DW, Golenbock DT, Christ WJ, Gusovsky F (1999) Toll-like receptor-4 mediates lipopolysaccharide-induced signal transduction. J Biol Chem 274(16):10689–10692
Dallas PB, Gottardo NG, Firth MJ, Beesley AH, Hoffmann K, Terry PA, Freitas JR, Boag JM, Cummings AJ, Kees UR (2005) Gene expression levels assessed by oligonucleotide microarray ana-lysis and quantitative real-time RT-PCR—how well do they correlate? BMC Genom 6:59. doi:10.1186/1471-2164-6-59 de Waal MalefytR, Abrams J, Bennett B, Figdor CG, de Vries JE
(1991) Interleukin 10(IL-10) inhibits cytokine synthesis by human monocytes: an autoregulatory role of IL-10 produced by monocytes. J Exp Med 174(5):1209–1220
Douglas RM, Hemila¨ H, Chalker E, Treacy B (2007) Vitamin C for preventing and treating the common cold. CochraneDatabase Syst Rev 18(3):CD000980
Frei B, Birlouez-Aragon I, Lykkesfeldt J (2012) Authors’ perspective: what is the optimum intake of vitamin C in humans? Crit Rev Food Sci Nutr 52(9):815–829
Fumeron C, Nguyen-Khoa T, Saltiel C, Kebede M, Buisson C, Drueke TB, Lacour B, Massy ZA (2005) Effects of oral vitamin C supplementation on oxidative stress and inflammation status in haemodialysis patients. Nephrol Dial Transplant 20(9):1874–1879. doi:10.1093/ndt/gfh928
Gale CR, Martyn CN, Winter PD, Cooper C (1995) Vitamin C and risk of death from stroke and coronary heart disease in cohort of elderly people. BMJ 310(6994):1563–1566
Gyorffy B, Molnar B, Lage H, Szallasi Z, Eklund AC (2009) Evaluation of microarray preprocessing algorithms based on concordance with RT-PCR in clinical samples. PLoS ONE 4(5):e5645. doi:10.1371/journal.pone.0005645
Hartel C, Strunk T, Bucsky P, Schultz C (2004) Effects of vitamin C on intracytoplasmic cytokine production in human whole blood monocytes and lymphocytes. Cytokine 27(4–5):101–106. doi:10. 1016/j.cyto.2004.02.004
Heimer KA, Hart AM, Martin LG, Rubio-Wallace S (2009) Examining the evidence for the use of vitamin C in the prophylaxis and treatment of the common cold. J Am Acad Nurse Pract 21(5):295–300
Huang DW, Sherman BT, Lempicki RA (2009) Systematic and integrative analysis of large gene lists using DAVID bioinfor-matics resources. Nat Protoc 41(1):44–57
Jacob RA (1990) Assessment of human vitamin C status. J Nutr 120(Suppl 11):1480–1485
Jacob RA, Kelley DS, Pianalto FS, Swendseid ME, Henning SM, Zhang JZ, Ames BN, Fraga CG, Peters JH (1991) Immunocom-petence and oxidant defense during ascorbate depletion of healthy men. Am J Clin Nutr 64(6 Suppl):1302S–1309S Jariwalla RJ, Harakeh S (1998) Antiviral and immunomodulatory
activities of ascorbic acid. Subcell Biochem 25:213–231 Jeng KC, Yang CS, Siu WY, Tsai YS, Liao WJ, Kuo JS (1996)
Supplementation with vitamins C and E enhances cytokine production by peripheral blood mononuclear cells in healthy adults. Am J Clin Nutr 64(6):960–965
Johnston CS, Martin LJ, Cai X (1994) Antihistamine effect of supplemental ascorbic acid and neutrophil chemotaxis. J Am Coll Nutr 11(2):172–176
Levine M, Conry-Cantilena C, Wang Y, Welch RW, Washko PW, Dhariwal KR, Park JB, Lazarev A, Graumlich JF, King J, Cantilena LR (1996) Vitamin C pharmacokinetics in healthy volunteers: evidence for a recommended dietary allowance. Proc Natl Acad Sci 93(8):3704–3709
Lu Q, Bjorkhem I, Wretlind B, Diczfalusy U, Henriksson P, Freyschuss A (2005) Effect of ascorbic acid on microcirculation in patients with Type II diabetes: a randomized placebo-controlled cross-over study. Clin Sci (Lond) 108(6):507–513. doi:10.1042/CS20040291
Lykkesfeldt J, Poulsen HE (2010) Is vitamin C supplementation beneficial? Lessons learned from randomised controlled trials. Br J Nutr 103(9):1251–1259
Majewicz J, Rimbach G, Proteggente AR, Lodge JK, Kraemer K, Minihane AM (2005) Dietary vitamin C down-regulates inflam-matory gene expression in apoE4 smokers. Biochem Biophys Res Commun 338(2):951–955. doi:10.1016/j.bbrc.2005.10.029 Margolis SA, Schapira RM (1997) Liquid chromatography
measure-ment of L-ascorbic acid and D-ascorbic acid in biological samples. J Chromatogr B Biomed Sci Appl 690(1–2):25–33 Moller P, Viscovich M, Lykkesfeldt J, Loft S, Jensen A, Poulsen HE
(2004) Vitamin C supplementation decreases oxidative DNA damage in mononuclear blood cells of smokers. Eur J Nutr 43(5):267–274. doi:10.1007/s00394-004-0470-6
Morey JS, Ryan JC, Van Dolah FM (2006) Microarray validation: factors influencing correlation between oligonucleotide micro-arrays and real-time PCR. Biol Proced Online 8(1):175–193 Mortola E, Okuda M, Ohno K, Watari T, Tsujimoto H, Hasegawa A
(1998) Inhibition of apoptosis and virus replication in feline immunodeficiency virus-infected cells by N-acetylcysteine and ascorbic acid. J Vet Med Sci 60(11):1187–1193
Muller M, Kersten S (2003) Nutrigenomics: goals and strategies. Nat Rev Genet 4(4):315–322. doi:10.1038/nrg1047
Park S, Ahn ES, Lee S, Jung M, Park JH, Yi SY, Yeom CH (2009) Proteomic analysis reveals upregulation of RKIP in S-180 implanted BALB/C mouse after treatment with ascorbic acid. J Cell Biochem 106(6):1136–1145. doi:10.1002/jcb.22097 Pickard MR, Mourtada-Maarabouni M, Williams GT (2011)
Candi-date tumour suppressor Fau regulates apoptosis in human cells: an essential role for Bcl-G. Biochim Biophys Acta 1812(9): 1146–1153. doi:10.1016/j.bbadis.2011.04.009
Price KD, Price CS, Reynolds RD (2001) Hyperglycemia-induced ascorbic acid deficiency promotes endothelial dysfunction and the development of atherosclerosis. Atherosclerosis 158(1): 1–12
suppression of p38 MAP kinase activation and inhibition of HuR expression. FASEB J 20(12):2112–2114
Retana-Ugalde R, Casanueva E, Altamirano-Lozano M, Gonza´lez-Torres C, Mendoza-Nunez VM (2008) High dosage of ascorbic acid and alpha-tocopherol is not useful for diminishing oxidative stress and DNA damage in healthy elderly adults. Ann Nutr Metab 52(2):167–173
Riemersma RA, Carruthers KF, Elton RA, Fox KA (2000) Vitamin C and the risk of acute myocardial infarction. Am J Clin Nutr 71(5):1181–1186
Ronziere MC, Roche S, Gouttenoire J, Demarteau O, Herbage D, Freyria AM (2003) Ascorbate modulation of bovine chondro-cyte growth, matrix protein gene expression and synthesis in three-dimensional collagen sponges. Biomaterials 24(5):851– 861
Salonen RM, Nyyssonen K, Kaikkonen J, Porkkala-Sarataho E, Voutilainen S, Rissanen TH, Tuomainen TP, Valkonen VP, Ristonmaa U, Lakka HM, Vanharanta M, Salonen JT, Poulsen HE (2003) Six-year effect of combined vitamin C and E supplementation on atherosclerotic progression: the antioxidant supplementation in atherosclerosis prevention (ASAP) study. Circulation 107(7):947–953
Sanderson LM, de Groot PJ, Hooiveld GJ, Koppen A, Kalkhoven E, Muller M, Kersten S (2008) Effect of synthetic dietary triglyc-erides: a novel research paradigm for nutrigenomics. PLoS ONE 3(2):e1681. doi:10.1371/journal.pone.0001681
Sanges R, Cordero F, Calogero RA (2007) oneChannelGUI: a graphical interface to Bioconductor tools, designed for life scientists who are not familiar with R language. Bioinformatics 23(24):3406–3408
Shin DM, Ahn JI, Lee KH, Lee YS (2004) Ascorbic acid responsive genes during neuronal differentiation of embryonic stem cells. NeuroReport 15(12):1959–1963
Swali A, McMullen S, Hayes H, Gambling L, McArdle HJ, Langley-Evans SC (2011) Cell cycle regulation and cytoskeletal remod-elling are critical processes in the nutritional programming of embryonic development. PLoS ONE 6(8):e23189. doi:10.1371/ journal.pone
Traber MG, Stevens JF (2011) Vitamins C and E: beneficial effects from a mechanistic perspective. Free Radic Biol Med 51(5):1000–1013. doi:10.1016/j.freeradbiomed.2011.05.017 Underhill DM, Ozinsky A (2002) Toll-like receptors: key mediators
of microbe detection. Curr Opin Immunol 14(1):103–110 van Ommen B, Bouwman J, Dragsted LO, Drevon CA, Elliott R, de
Groot P, Kaput J, Mathers JC, Muller M, Pepping F, Saito J, Scalbert A, Radonjic M, Rocca-Serra P, Travis A, Wopereis S, Evelo CT (2010) Challenges of molecular nutrition research 6: the nutritional phenotype database to store, share and evaluate nutritional systems biology studies. Genes & Nutr 5(3):189–203. doi:10.1007/s12263-010-0167-9
Wang P, Wu P, Siegel MI, Egan RW, Billah MM (1994) IL-10 inhibits transcription of cytokine genes in human peripheral blood mononuclear cells. J Immunol 153(2):811–816
Wannamethee SG, Lowe GD, Rumley A, Bruckdorfer KR, Whincup PH (2006) Associations of vitamin C status, fruit and vegetable intakes, and markers of inflammation and hemostasis. Am J Clin Nutr 83(3):567–574; (quiz 726–567)
Webb AL, Villamor E (2007) Update: effects of antioxidant and non-antioxidant vitamin supplementation on immune function. Nutr Rev 65(5):181–217
Wintergerst ES, Maggini S, Hornig DH (2006) Immune-enhancing role of vitamin C and zinc and effect on clinical conditions. Ann Nutr Metab 50(2):85–94. doi:10.1159/000090495