From Traditional to Mobile and SMS-based Surveys
Iftikhar Alam
Department of Computer Science University of Peshawar
iftikharalam@upesh.edu.pk Shah Khusro
Department of Computer Science University of Peshawar
khusro@upesh.edu.pk Azhar Rauf
Department of Computer Science University of Peshawar
azhar.rauf@upesh.edu.pk Qamruz Zaman
Department of Statistics University of Peshawar ayanqamar@gmail.com
Abstract
Fresh, bias-free and valid data collected using different survey modes is considered an essential requirement for smooth functioning and evolution of an organization. Surveys play a major role in making in-time and correct decisions and generating reports. The aim of this study is to compare and investigate state-of-the-art in different survey modes including print, email, online, mobile and SMS-based surveys. Results indicate that existing methods are neither complete nor sufficient to fulfill the overall requirements of an organization which primarily rely on surveys. It also shows that SMS is a dominant method for data collection due to its pervasiveness. However, existing SMS-based data collection has limitations like limited number of characters per SMS, single question per SMS and lake of multimedia support. Recent trends emphasis on smartphones applications for data collection. However, in developing countries low-end mobile devices are still extensively used which makes the data collection difficult from man in the street. The paper concludes that existing survey modes and methods need an improvement to get maximum responses quickly in the lowest possible cost. The study has contributed to the area of surveying and data collection by analysing different factors such as cost, time and response rate. The results of this study can help practitioners in creating new methods and tools for data collection that can be effectively used for low budget projects in developed as well as developing countries.
Keywords: Mail-based surveys, Online surveys, Mobile-based surveys.
1. Introduction
popular and widely used methods for collecting data (Pfleeger and Kitchenham, 2001). Survey research can be conducted in different modes and is normally dependent on time, cost and response rates. Surveys conducted in traditional manners are time consuming and a costly job (Cobanoglu et al., 2001). Email and World Wide Web (WWW), also known as electronic surveys are alternative approaches for surveying. However, electronic surveys suffers from spam-mail problems and low-response rate (Evans and Mathur, 2005). The popularity of mobile technologies enabled a user to conduct efficient and low cost surveys in less time. However, mobile-based data collection has limitations as well, which are discussed in later sections. Researchers suggest the use of SMS-based data collection as a solution to the problems associated with mail, email and web-based surveys. However, existing SMS-based survey has limitations including limited characters per SMS (Brown et al., 2007), single question per SMS and lack of multimedia support. There is no single best mode of data collection that can fulfill the overall requirements of a surveyor. So mixed mode will continue to play an important role in survey research and data collection (Couper, 2011). Figure.1is constructed in the light of existing literature and survey conducted in this paper. This shows survey modes and usage in terms of time, cost and response rate.
Cost, time and good response rate are major concerns for any type of surveys including large-scale multinational surveys. Figure.1 shows that among all survey modes, SMS-based survey provides a best survey solution in terms of time, cost and response rate.
2. Conducting Surveys: An Overview
Survey is a type of quantitative research instrument that is used not only for data collection or information about an issue or phenomena, but a series of comprehensive steps for collecting information to describe, explain or compare knowledge, attitude and behaviour in certain circumstances. This type of research is a straightforward and effective method used by researchers to collect information about product, brand, context, event, employees and workers (Pfleeger and Kitchenham, 2001). Being a data collection tool a survey is capable of gathering demographics data from large sample of populations (Priscilla, 2005). Two popular methods for conducting survey research are questionnaire and interview (William M.K. 2006). In questionnaire-based approach, data is collected using pre-planned questions where responses are collected and analysed, while in interview-based approach an interview is conducted with a number of selected respondents and their live responses are collected and analysed.
In selection of any survey mode, the following errors must be kept in mind and should be minimized for obtaining accurate results (Dillman, 1991). An example is the sampling error, which occurs when the population is huge and heterogeneous. Web-based surveys in which the population is huge and heterogeneous are more affected by this type of errors and are difficult to overcome (Van Selm and Jankowski, 2006). To overcome this type of error up to some level, some heterogeneous members are excluded from the population for making the population homogeneous (Dillman, 1991). Recently, survey researchers are taking keen interests in social networking sites such as Facebook etc., because of huge number of users. However, social media users are not the true representatives of target population (Couper, 2011). The non-coverage errors occurs, if the selected sample has no chance to respond (Dillman, 1991). Online surveys have suffered a lot from this type of errors because of internet coverage especially in developing countries (Balabanis et al., 2007). The chances of occurrence of this type of error in mail-based surveys are low, because of the global availability of post offices (William K. P, 2004). While in Web-based it is high because of internet coverage bias (Couper, 2000). The non-response error occurs mostly in electronic-based surveys. The response rate in traditional mail based survey is high (Evans and Mathur, 2005). While in Web-based surveys response rate is low as compare to any other modes like mail, e-mail, fax, SMS(Poole and Loomis, 2009; (Dillman, 1991)). This is because non-response error is directly proportional to coverage error. If there is no internet coverage, then non-response error gets high. Measurement errors occur if a respondent is unable to provide accurate information. It mostly depends on the types questions of a survey (Dillman, 1991). Interviewer bias in telephone and face-to-face interview is a type of measurement error (Uma and Bougie, 2003). Personal likes and dislikes is also a type of measurement error.
occur. Security and privacy must be ensured by the survey services providers. Improved data recognition techniques must be adopted for repeated responses using cookies and Internet Protocol (IP) addresses for removing duplicate responses from the same user (Mingyue and Xicang, 2011). The survey services providers must provide a proper method for publishing surveys and an ensured protection against junk-mail/spam-mail. In developing countries, non-coverage errors must be kept in mind especially in electronic-based surveys due to limited internet coverage.
3. Survey Modes
The term “Mode” refers to the overall system of data collection chosen for a specific purpose. Historically, mail and face-to-face were the main modes of data collection from 1940 to 1970. In 1970 telephone surveys were widely adopted in USA and later in Europe. In 1990, internet-based surveys began to supersede telephone surveys (Couper, 2011). In this modern age, internet-based surveys (email-based, Web-based) approaches are also gaining popularity (Elhejaj et al., 2010). Mobile-based and SMS-based data collection is also widely used due to its pervasiveness and simplicity. The increased number of data collection modes and methods brings more complexity in management and conduction. As mentioned earlier, no one can fully rely on single mode of data collection. Mixed mode is popular and widely used for data collection (De Leeuw, E. D,
2005) and continues to evolve further (Couper, 2011). Also, Vannieuwenhuyze, 2014,
illustrated the budgetary advantages of mixed mode design in case where allowed error is small. The Table.1 is constructed from literature discussed in this article.
Table 1: Comparisons of surveys modes in term of cost, time, response rate and tools
Broad category
Surveys modes Cost Time Response
rate Automated Data analysis tools Ma il -b a se d S u rv ey
s Traditional mail-based Surveys
May be high(papers charges, postage charges, return envelope charges and data entry charges)
Slow response rate, Very time consuming
High Not available (Manually fulfillment) Inter v iew -b a se d Su rv ey s Face-to-Face Surveys
Very high Quick response collection
Average Available (CAI,CAPI,CATI)
Telephone-based Surveys
Very high Quick response collection
Average Available (CAI,CAPI,CATI) Inter n et -b a se d S u rv ey Email-based Surveys
Low ( sometime high because of reposes entry)
Slow response \collection
Low Not available (Manual entry of responses)
Web-based Surveys
Low (if third party is responsible for the conduction of survey)
Very quick and efficient: analyse data by automatic tools
Very Low
Available: Very efficient statistical tools are available for data analysis.
Mo b il e-b a se d S u rv ey Mobile browser-based Survey
Very low Slow response collection
Low Available: Mostly same as for web based surveys.
SMS-based Surveys
Very low Quick response collection
3.1 Mail-based Surveys
Mail-based, also known as traditional paper-based, approach of surveying is an oldest and most popular data collection still widely used. In this approach, paper-based questionnaire is distributed by post or by hand. Although hand-based distribution is a difficult job but is a more effective method for small-scale surveys. For large-scale surveys, envelop and post offices are used. Mail-based survey mode yields higher response rate than Web-based and email-based surveys (Poole and Loomis, 2009). This is because of selection of a large sample size is possible, huge geographic coverage, variety of questions may be asked and low cost per individual respondent (Evans and Mathur, 2005). The pre-notifications and follow-ups by telephones have significant effects on response rates (Kanuk and Berenson, 1975). Also, the award of incentives has a positive impact on response rates. Besides all mentioned benefits, the overall cost of traditional mail-based survey is high as compared to other survey modes due to paper postage charges, return envelope charges and data/responses entry charges. Also, it is a slow and time consuming approach as compare to other modes of surveying (William K. P, 2004). Other major problems includes incomplete questionnaire from respondents (Evans and Mathur, 2005), which in turn generate fake results. Another problem is that you have to pay to data entry operators for entry of responses. . The entry of responses is not only a time consuming job, but also the chances of errors are high (Hartung, 2012). Analysing the gathered data required a huge amount of money especially in this mode of surveys.
3.2 Interview-based Surveys
Interviewing is another popular method for data collection. Interview-based surveys are usually conducted face-to-face or through telephone. There are two types of interviews namely structured and unstructured. Structured interviews are conducted when there are some predefined questions and objectives with a specific sequence of questions, while in unstructured interviews random questions are asked with no special objectives. The data collected through interview should be free from measurement error which usually occurs if the purpose and questions of interview are not clear. Bias may also occur because of personal likes and dislikes. Establishing trust with interviewer can reduce these biases (Uma and Bougie, 2003). Interviews conducted through telephone have advantages of selecting a random sample, large geographic coverage, controlled surveys process, speed and timeliness completion of surveys, personal interaction with respondents and technological enhancement. Besides all mentioned advantages, it is a costly approach and is not feasible to interview a large number of peoples on national and international basis (Uma and Bougie, 2003). Other major problems are interviewer-bias, refusal from interview and low response rate (Evans and Mathur, 2005). Refusals and low response rates arise due to busy schedule of respondents.
using computers. Here, respondents can use their own computer with CAPI software. After responding to all questions, responses are sent back to server. This reduces the recording error during interview (Uma and Bougie, 2003). Using these automatic-interview approaches, responses can be collected from all over the world in less time.
3.3 E-mail-based Surveys
In this approach an email message with attached questionnaire is sent to targeted respondents. The respondent after answering questions may reply through an email with attached responses to a surveyor (Van Selm and Jankowski, 2006). E-mail-based surveys has the advantages of speed and low cost (Hayslett and Wildemuth, 2005) with higher response rate than web-based surveys (Elhejaj et al., 2010). This is because; email is a PUSH technology in which the message is sent to the respondent’s inbox whereas the Web is a PULL technology in which respondent must be attached to a web page. It should be noted that there must be a predefined list of e-mail addresses of all respondents. As the survey can be e-mailed to many respondents with no cost, email-based surveys are less costly however, situations where manual entry is required for data analysis, cost may get high. Other problems reported are spam/junk mail and internet coverage bias.
Nowadays an email can be sent through an ordinary Short Message Service (SMS). This can be done using email-to-SMS/SMS-to-email gateway which enable the sending and receiving of email using SMS even to low-end mobile devices. The gateway can send/receive only those emails that contain only text. Rich contents such as audio, video cannot be delivered through SMS, because of limited number of characters per SMS. E-mail to SMS services are offered by all mobile operators in Pakistan and is rarely used for data collection.
3.4 Web-based Surveys
Web-based surveying is an alternate and more advanced version of mail and email-based surveying. Today there are hundreds of web applications that offer a wide range of surveys from simple-to-complex and free-to-commercial survey solutions. These also offer a wide range of question types with more advanced administration options. The cost of the Web-based survey is low if a third party (normally web survey provider) is involved for overall survey conduction (survey preparation, distribution, response collection and analysis). For example, free service providers like Limesurvey1 may reduce the overall cost of a survey.
The Web-based survey is advantageous because of quick response collection and availability of automated analysis tools. So one doesn’t need to pay to data entry operators. The major problem of Web-based survey is low response rate due to internet coverage bias (William K. P, 2004, (Van Selm and Jankowski, 2006)). Also, in some situations the Web-users are not true representatives of the target population. Table.2 is an overview of state-of-the-art in online Web-based survey applications.
3.5 Mobile-based Surveys
Mobile-based surveying and data collection is also a popular method used worldwide by government agencies and Non-Governmental Organizations (NGOs). Mobile phones, which are not only voice-based communication device but offer short message services (SMS, instant messaging) and Web-based services and are used extensively. The mobile-based modes are expanding rapidly due to their multi-model capabilities (Couper, 2011). The growing cellular infrastructure and low-cost mobile phones provide an opportunity to change traditional paper-based data collection techniques to pervasive devices like mobiles (Hartung, 2012). The mobile data collection is based on two techniques. It may be either browser-based or SMS-based. The browser-based data collection needs an internet connection for sending and receiving of data. For examples Magpi2, Open-Data-Kit3 and OpenXdata4 offer mobile browser-based data collection. In SMS-based data collection an ordinary 160-character-SMS is used. The cost of SMS-based survey is low due to its pervasiveness. The responses are collected very quickly and efficiently. The automated tool for data analysis is
Table 2: Analysis of Web-based Survey applications
Services with their numbers:
Accounts (Trail=1.1, Free=1.2, Commercial=1.3), Designing=2, Multi-lingual support=3, Data collection=4, Survey publishing =5, Social networking sites integration=6, Reminders / Follow ups=7, Data Analysis=8, Data sharing=9, Offline survey facility=10, Software development (APIs) =11.
Access date: 10 March 2014
S.No Name Address Services / Features offered
1 e-survey creator http://www.esurveycreator.com 1.1, 1.3, 2, 3, 4, 5, 7, 8, 9 2 Form site http://www.formsite.com/ 1.2, 1.3, 2, 3, 4, 5, 8, 9 3 Polldaddy https://polldaddy.com/ 1.2, 1.3, 2, 3, 4, 5, 6, 8, 9 4 Question pro http://www.questionpro.com/ 1.2, 1.3, 2, 3, 4, 5, 6, 7, 8, 9, 10 5 SurveyGizmo http://www.surveygizmo.com/ 1.2, 1.3, 2, 3, 4, 5, 6, 8, 9, 11 6 Survey Monkey http://www.surveymonkey.com/ 1.2, 1.3, 2, 3, 4, 5, 6, 7, 8, 9 7 Lime Survey http://www.limesurvey.org 1.2, 1.3, 2, 3, 4, 5, 7, 8, 9, 11 8 Constant contact http://www.constantcontact.com 1.1, 1.3, 2, 4, 5, 6, 7, 8, 9 11 Agredea http://www.agredea.com/en/ 1.1, 1.3, 2, 4, 5, 6, 8, 9 12 Create survey http://www.createsurvey.com/ 1.2, 1.3, 2, 3, 4, 5, 6, 7, 8, 9, 13 Examinare http://www.examinare.com 1.3, 2, 3, 4, 5, 6, 7, 8, 9, 11 14 Kwik Surveys http://www.kwiksurveys.com/ 1.2, 1.3, 2, 3, 4, 5,6, 8, 9, 11 15 My survey lab https://www.mysurveylab.com/ 1.2, 1.3, 2, 3, 4, 5, 6, 8, 9 16 Net Q Surveys http://www.netq-survey.com/ 1.2, 1.3, 2, 3, 4, 5, 6, 7, 8, 9 17 2 ask http://www.2ask.net 1.1, 1.3, 2, 3, 4, 5, 7, 8, 9 18 Aytm http://aytm.com 1.3, 2, 4, 5, 6, 8, 9 19 Checkbox survey http://www.checkbox.com 1.3, 2, 3, 4, 5, 7, 8, 9, 11 20 Class Apps http://www.classapps.com 1.3, 2, 3, 4, 5, 7, 8, 9, 11
also its major advantage (Rittippant et al., 2009), Balabanis et al., 2007). Besides all mentioned advantages; both browser-based and SMS-based data collection have limitations like mobile browser compatibility issues, mobile screen compatibility issues, slow internet connections, limited number of characters per SMS, age factor, and low literacy rate especially in developing countries.
3.5.1 Data Collection using Well-formatted Forms and Browsers
Internet connection and installation of survey application on mobile are mandatory in this type of data collection. The forms can be downloaded from Web-application to a pre-loaded survey application on mobile. In form-based approach, the data can be collected using point-and-click approach with fewer chances of errors. However, this approach has the same inherit problem of internet coverage bias, slow internet connections. The following are a few well-known survey applications used for mobile and tablets.
(1) Open-Data-Kit5: Open Data Kit is an open-source set of tools for data collection using mobiles and tablets. In Pakistan, ODK is used for data collection by NGOs. In Afghanistan, it was used in 2010 for fraud monitoring in elections. ODK uses forms for data collection on mobile phones, but forms and forms-data are downloaded and uploaded using GPRS/Internet from a user mobile phones (Hartung et al., 2010). Internet coverage bias is likely to occur in ODK-based data collection.
(2) Magpi / Episurveyor6: Magpi (Ex-Episurveyor) is another well-known browser-based application used for data collection on mobile phones. The Magpi-forms can be downloaded to a pre-loaded Magpi-application on mobile phones. The answers can be sent back to a surveyor using internet or SMS, for which Magpi provides an international GMS modem number. It should be noted that forms cannot be downloaded without GPRS/Internet connection. Only the answers can be sent to the provided GMS modem numbers.
(3) OpenXdata7: OpenXdata is also an open source software for data collection using low price mobile devices. OpenXdata is an advanced and renamed version of Epihandy8. It uses Openrosa-and-Javarosa9 platform for data collection for J2ME and android-based mobile phones.
(4) FrontlineSMS10: FrontlineSMS is an open-source and free SMS management tool. It enables two-way communication using SMS with no need of internet connection. As SMS is available even for low-end mobile devices, therefore FrontlineSMS is highly effective and easy way to communicate with a huge number of peoples.
5 http://opendatakit.org/
6 https://www.magpi.com 7 http://www.openxdata.org
3.5.2 Data Collection using SMS
Short Message Service (SMS), which is considered as the most popular way of communication in developed as well as in developing countries(Rittippant et al., 2009),(Susanto and Goodwin, 2010). SMS is a bi-directional communication service for sending text messages through wireless communication system. It uses GSM 7-bit encoding with maximum capacity of 140 bytes (1120 bits/160 seven-bits characters or 140 characters using eight-bits or 70 characters using sixteen-bits for non-Latin alphabets such as Arabic, Urdu, Chinese, Korean, Japanese languages) (Brown et al., 2007), (Mahmoud et al., 2010).
SMS-based survey is recommended as a solution to slow, low-response rate and internet coverage problems. SMS-based survey is best alternative to probability Web-based surveys for high response rates (up to 56 % increase in response) (Balabanis et al., 2007). The success indictors for SMS are low-cost and pervasiveness. SMS-based surveys are a best way to collect quick responses (in 3.3 days), which is better than other survey modes (Rittippant et al., 2009).
3.5.3 Web-based SMS Services for Data Collection
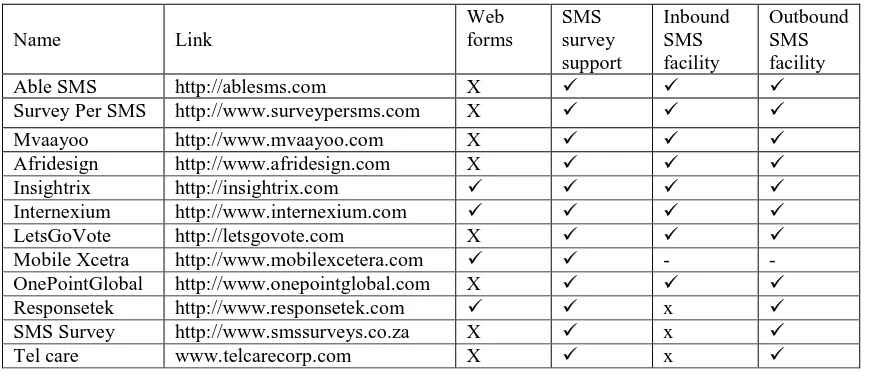
SMS is extensively used for alerts, public transport alerts, listening to people opinions in most of the developed countries like Australia, Indonesia, and UK (Susanto and Goodwin, 2010). There are some online SMS-based survey services providers mentioned in Table 3 “Web-based SMS survey providers”. The table shows some models of Web-based SMS survey providers. If we critically analyse Table.3, we can clearly see that most of the service providers used inbound or outbound techniques for SMS-based data collection. An inbound strategy invites people on TV, radio or print media while in outbound strategy a list of pre-selected mobile numbers are provided to these third-party survey-providers. Then third-party service providers are responsible for sending SMS invitations, questions and alerts, collect responses and analyse the collected data using statistical tools.
Table 3: Web-based SMS Survey providers
Name Link
Web forms
SMS survey support
Inbound SMS facility
Outbound SMS facility
Able SMS http://ablesms.com X
Survey Per SMS http://www.surveypersms.com X
Mvaayoo http://www.mvaayoo.com X
Afridesign http://www.afridesign.com X
Insightrix http://insightrix.com
Internexium http://www.internexium.com
LetsGoVote http://letsgovote.com X
Mobile Xcetra http://www.mobilexcetera.com - - OnePointGlobal http://www.onepointglobal.com X Responsetek http://www.responsetek.com x SMS Survey http://www.smssurveys.co.za X x
3.5.4 Limitations of Traditional SMS-based Surveys
By critically analysing the existing SMS-based survey approaches, it is clear that this approach has some serious limitations majorly from surveyor point of view. The quantitative evaluation of data entry and its accuracy on mobile phones shows that error-rate for SMS is 4.8%, which is high as compared to Web-forms error-error-rate 4.2%(Patnaik et al., 2009). The cost per SMS is low but target population is huge and may result in a huge cost at the end. Even in this modern age, most people do not know how to send and open SMS (Rittippant et al., 2009)). Studies shows that SMS-based surveys appealing to young and educated personals and nearly ignore the rest of population (Balabanis et al., 2007). Another potential disadvantage of SMS is its limited text format (Rettie and Brum, 2001), only 140 octets “160 characters of 7-bits” as discussed. Therefore, we cannot send rich content like audio, video and colour pictures to the respondent (Rittippant et al., 2009).The SMS-based survey is usually carried out in the form of single question per SMS, which is normally in the form of “YES/NO or True/False etc.”. If a questionnaire consists of multiple questions then the surveys is carried in multiple SMS i.e. ask another SMS question when previous question is answered. Another major problem is question/answer synchronization as it is difficult to synchronize the questions and its answers with respondents in case of multiple questions contain in a survey. Maintaining the order of questions is also a challenging task because in many cases the survey questions are inter-dependent, so the correct order of question is necessary in this situations. For this, the next question may be sent to a user if the previous one is answered. But, there are possibilities of SMS delay due to SMS traffic in rush hours, which may disturbs this order. Incomplete survey may also result as it is possible that a user may respond to some SMS questions and ignore the rest. These incomplete surveys and questionnaire generates fake reports. It should be noted that SMS is mostly used by young and teenage users. Therefore, the data collected through SMS is not the actual representation of the target population and represents a skewed distribution. The existing SMS applications are not capable to handle the surveys based on multiple choice questions.
4. Research Approach
The study reported in this research article was conducted using mixed mode surveys consisting of both Paper-based and SMS-based. The population was M.Phil and PhD faculty and scholars of the University of Peshawar. The reason for choosing this population is that surveys and data collection is extensively used by research scholars especially in Social Science departments. A random sample of 300 was selected from research scholars at University of Peshawar. The population is round about 1000 (approximately). The ratio of the questionnaire were (200 Paper and 200 SMS= Total 400), in which some respondents were selected for both methods (Paper and SMS). The respondents were asked to select “Like” one method of data collection that best suit their needs or they used as research tool from the five well-known methods (mail, email, web, mobile and SMS) along with their age. The responses were recorded as:
Paper-based responses: 150 (out of 200) mostly distributed/collected by hand.
4.1 Results and Discussion
Normally the ages of the research scholars and professors at the University of Peshawar ranges from 23 to 61+ years. The age factor and responses in paper-based surveying were recorded in table 4.
Table 4: The collected responses using Paper-based Surveys
Age:
23-61+ Paper Email Web Mobile SMS Total
23-30 2 6 5 9 13 35
31-37 4 3 3 9 10 29
38-45 6 5 4 7 10 32
46-53 10 2 2 5 9 28
54-61 12 2 2 3 7 26
Grand total 150
The above Table 4 and Figure 2 show that people in age group 23-45 (young peoples) are more like to collected data using electronic technologies like e-mail, web, mobile and SMS. The people in the age group 45-61+ years are more like to collect data using paper. They are not comfortable with electronic technologies like email, web and mobiles. However, this age group likes SMS as a data collection tool.
Figure 2: The responses collected using paper-based surveys with age factor
H0: There is no difference between the responses for all modes of data collection.
H0: µ1=µ2=µ3=µ4=µ5
H1: There is a difference between the responses for all modes of data collection.
ANOVA: Single Factor SUMMARY
Groups Count Sum Average Variance
Paper 5 34 6.8 17.2
Email 5 18 3.6 3.3
Web 5 16 3.2 1.7
Mobile 5 33 6.6 6.8
SMS 5 49 9.8 4.7
ANOVA
Source of Variation SS Df MS F P-value F crit
Between Groups 145.2 4 36.3 5.385757 0.004137 2.866081
Within Groups 134.8 20 6.74
Total 280 24
The results F> F crit (5.385757>2.866081) and hence reject the null hypothesis and conclude that there is a difference between the responses for data collection mode. The major difference is in-between internet-based mode and rest of the modes. This highlights internet coverage bias in developing countries. The t-test is used to test the null hypothesis for internet-based modes (email-based and web-based) to find the differences of collected responses.
H0: There is no differences between the email and web responses.
H1: The two population has different means.
t-Test: Two-Sample Assuming Unequal Variances
Email Web
Mean 3.6 3.2
Variance 3.3 1.7
Observations 5 5
Hypothesized Mean Difference 0
Df 7
t Stat 0.4
P(T<=t) one-tail 0.350541
t Critical one-tail 1.894579
P(T<=t) two-tail 0.701082
The t stat value lying in-between the t critical two tail values (-2.3646<0.4<2.3646) and depicted in the Figure 4. Hence we accept the null hypothesis and conclude that there no significant difference between the responses of email-based surveys and web-based surveys. Both modes are internet dependent and restrict a lay man from responding especially in developing countries.
Figure 4. Two tail T-test for internet-based surveys
SMS-based data collection is more dominant method of data collection. The figure.2 showed a skewed distribution as the young age group 23-to-45 has more tendency towards electronic technologies like email, web, mobile and SMS. While people in age group 54-60+ show more tendency towards paper and SMS. It means that SMS is more dominant in all age group of peoples. The three methods namely email, web and mobile browser-based application are internet dependent and are not liked by most of the respondents.
The age factor and responses in SMS-based survey were recorded in Table 5. The five methods of data collection liked by age groups were recorded.
Table 5: The collected responses using SMS-based Surveys
Age: 23-61+ Paper Email Web Mobile SMS Total
23-30 2 4 3 10 18 37
31-37 3 2 2 12 15 34
38-45 4 2 3 10 16 35
46-53 7 1 2 8 13 31
54-61+ 8 1 2 6 11 28
Figure 3: The responses using SMS-based survey and age factor
The SMS-based data collection in table.5 shows that SMS is more liked by all age groups.
Figure.3 shows that SMS is a dominant data collection method whereas mobile and paper-based data collection is more popular as compare to email and Web-based surveys. Paper-based data collection is more liked by the age group 54-61.
The responses collected using SMS-based mode in table.5 is tested using ANOVA test to find the differences between the collected responses.
H0: There is no difference between the responses for all modes of data collection.
H0: µ1=µ2=µ3=µ4=µ5
H1: There is a difference between the responses for all modes of data collection.
ANOVA: Single Factor
SUMMARY
Groups Count Sum Average Variance
Paper 5 24 4.8 6.7
Email 5 10 2 1.5
Web 5 12 2.4 0.3
Mobile 5 46 9.2 5.2
SMS 5 73 14.6 7.3
ANOVA
Source of Variation SS df MS F P-value F crit
Between Groups 564 4 141 33.57143 1.3E-08 2.866081
Within Groups 84 20 4.2
Total 648 24
The results for SMS-based data collection shows that F > F crit (33.57143>2.866081). Hence we reject the null hypothesis and accept the alternative hypothesis as there is difference between the responses.
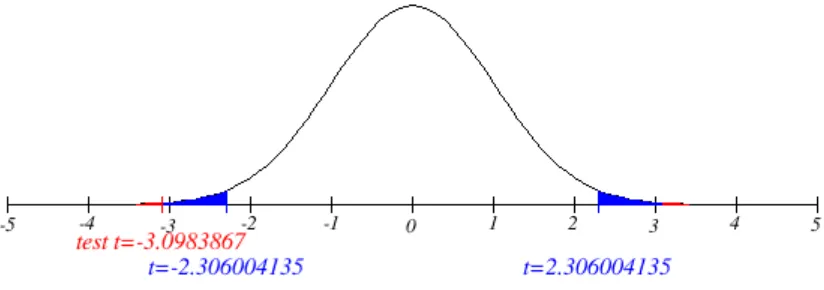
The two Modes (paper-based and SMS-based) used for response collection also yields interesting statistics by analysing the SMS columns in table.4 which is paper-based collection and table.5 which is SMS-based collection. Here we use t-test for analysis of columns of the table.4 and table.5.
H0: There is no difference between the responses collected using Paper mode and SMS mode.
H1: There is a difference between the SMS mode and Paper mode.
t-Test: Two-Sample Assuming Unequal Variances
SMS (Table.4)
SMS (Table.5)
Mean 9.8 14.6
Variance 4.7 7.3
Observations 5 5
Hypothesized Mean Difference 0
Df 8
t Stat -3.0983867
P(T<=t) one-tail 0.007350815
t Critical one-tail 1.859548038
P(T<=t) two-tail 0.014701629
t Critical two-tail 2.306004135
Figure 5. Two tail t-test for SMS columns in Table.4 and Table.5
The SMS-based data collection is dominant mode to target a specific population in low budget projects. Also it is very fast mode in term of collecting data. In our experiment we collected data in just four days while the paper-based took sixteen days in collection with lots of physical efforts.
5. Conclusion and Recommendations
The usage of SMS must be utilized in a better way not only for surveys but for other data collection needs like collecting student’s attendance and conducting quizzes in case of m-learning scenario. The existing SMS applications and SMS-based surveys applications are not suitable for surveys which are based on multiple questions. For example, in Web-based the survey questions can be displayed in attractive format using the radio buttons, list options, clear textboxes for open ended questions, rang-type questions, defaults options, while in SMS-based surveys such representation of questionnaire is not available. Therefore, we recommend the development of a better SMS-based survey application for Smartphones, Tablets and J2ME-based phones which can possibly represent a survey questionnaire in attractive format. This will help in SMS-based form processing and will be able to handle surveys which are based on multiple-questions and multiple-choice questions.
SMS has limited character capacity for sending and receiving of data, but better lossless compression, assembling and dissembling techniques can enhance their usage, speed and presentation.
We recommend an integrated and centralized survey application, which can handled both Web and SMS-based surveys in an efficient and uniform ways using existing GSM network or internet. This approach is necessary for building the trust of respondents and for security and privacy of data. Because, the sensitive data of an organization cannot be stored or recorded on third-party servers. The application should be installed and maintained locally by the surveyor with provision of strong security and privacy for both data and respondent.
References
1. Balabanis G, Mitchell VW, Heinonen-Mavrovouniotis S, (2007). SMS-based surveys: Strategies to improve participation. International Journal of Advertising, 26, 369-385.
2. Brown, J., Shipman, B., and Vetter, R. (2007). SMS: The short message service.
Computer, 40(12), 106-110.
3. Cobanoglu, C., Warde, B., and Moreo, P. J. (2001). A comparison of mail, fax and web-based survey Methods. International journal of market research, 43(4), 441-452.
4. Couper, M. P. (2011). The future of modes of data collection. Public Opinion Quarterly, 75, 889-908.
5. Couper, M. P. 2000. Review: Web surveys: A review of issues and approaches.
The Public Opinion Quarterly, 64, 464-494.
6. De Leeuw, E. D. (2005). To mix or not to mix data collection modes in surveys.
Journal of Official statistics-Stockholm, 21(2), 233.
8. Elhejaj, S. Y., Mutalib, A. A. and Wahab, M. H. A. (2010). Web-Based Survey Management system (W-SMS): Usefulness and Ease of Use, Proceedings of Regional Conference on Knowledge Integration in ICT, 445.
9. Evans, J. R. and Mathur, A. (2005). The value of online surveys. Internet Research, 15, 195-219.
10. Hartung, C., Lerer, A., Anokwa, Y., Tseng, C., Brunette, W., and Borriello, G. (2010). Open data kit: Tools to build information services for developing regions. In Proceedings of the 4th ACM/IEEE International Conference on Information and Communication Technologies and Development (p. 18). ACM.
11. Hartung, C. (2012). Open Data Kit: Technologies for Mobile Data Collection and Deployment Experiences in Developing Regions.
12. Hayslett, M. M. Wildemuth, B. M. 2005. Pixels or pencils? The relative effectiveness of Web-based versus paper surveys. Library and Information Science Research, 26, 73-93.
13. Kanuk, L. and Berenson, C. (1975). Mail surveys and response rates: A literature review. Journal of Marketing Research, 440-453.
14. Mahmoud, T. M., Abdel-Latef, B. A., Ahmed, A. A., and Mahfouz, A. M. (2010). Hybrid Compression Encryption Technique for Securing SMS. International Journal of Computer Science and Security (IJCSS), 3(6), 473.
15. Mingyue, F. and Xicang, Z. (2011). Research on Internet survey errors and control methods. International Conference on Business Management and Electronic Information (BMEI), IEEE, 346-349.
16. Patnaik, S., Brunskill, E. and Thies, W. Evaluating the accuracy of data collection on mobile phones: A study of forms, SMS, and voice. Information and Communication Technologies and Development (ICTD), 2009 International Conference, IEEE, 74-84.
17. Pfleeger, S. L. and KITCHENHAM, B. A. 2001. Principles of survey research: part 1: turning lemons into lemonade. ACM SIGSOFT Software Engineering Notes, 26, 16-18.
18. Poole, B. D. and Loomis, D. K. A comparative analysis of mail and internet surveys. Proceedings of the 2009 Northeastern Recreation Research Symposium, 2009. 29-31.
19. Priscilla A. Glasow (25988), April 2005, Fundamentals of Survey Research Methodology, Mitre Product, Washington C3 Center McLean, Virgini.
20. Rettie, R., and Brum, M. (2001). M-commerce: the role of SMS text messages.
Cotim-2001 Proceedings from E-Commerce to M-Commerce, University of Rhode Island, Kingston.
22. Susanto, T. D., and Goodwin, R. (2010). Factors Influencing Citizen Adoption of SMS-based e-Government Services. Electronic journal of e-government, 8(1), 55-70.
23. Uma, S. and Bougie, R. (2003). Research Methods for Business: A skill building approach. John Wiley and Sons Inc., New York.
24. Van Selm, M. and Jankowski, N. W. 2006. Conducting online surveys. Quality and Quantity, 40, 435-456.
25. Vannieuwenhuyze, J. T. (2014). On the Relative Advantage of Mixed-mode Versus Single-mode Surveys. Survey research methods 8(1), 31-42
26. William M.K. Trochim (2006). Social Research Methods, available at: http://www.socialresearchmethods.net/kb/survey.php (April 26, 2014)
27. William K. P, (2004). Comparative Advantages/ Disadvantages of Phone, Mail
and E-Mail/Web-Based surveys, available at: