© Author(s) 2010. This work is distributed under the Creative Commons Attribution 3.0 License.
Measurement
Techniques
Analysis of non-methane hydrocarbons in air samples collected
aboard the CARIBIC passenger aircraft
A. K. Baker, F. Slemr, and C. A. M. Brenninkmeijer
Max-Planck-Institut f¨ur Chemie (MPI), Air Chemistry Division, Johannes-Joachim-Becher Weg 27, 55128 Mainz, Germany Received: 19 August 2009 – Published in Atmos. Meas. Tech. Discuss.: 6 October 2009
Revised: 18 January 2010 – Accepted: 2 February 2010 – Published: 26 February 2010
Abstract. The CARIBIC project (Civil Aircraft for the Reg-ular Investigation of the atmosphere Based on an Instrument Container) is a long-term monitoring program making regu-lar atmospheric measurements from an instrument container installed monthly aboard a passenger aircraft. Typical cruis-ing altitudes of the aircraft allow for the study of the free troposphere and the extra-tropical upper troposphere as well as the lowermost stratosphere. CARIBIC measurements in-clude a number of real time analyses as well as the collection of aerosol and whole air samples. These whole air samples are analyzed post-flight for a suite of trace gases, which in-cludes non-methane hydrocarbons (NMHC).
The NMHC measurement system and its analytical per-formance are described here. Precision was found to vary slightly by compound, and is less than 2% for the C2–C6 alkanes and ethyne, and between 1% and 6% for C7–C8 alka-nes and aromatic compounds. Preliminary results from par-ticipation in a Global Atmospheric Watch (WMO) VOC au-dit indicate accuracies within the precision of the system. Limits of detection are 1 pptv for most compounds, and up to 3 pptv for some aromatics. These are sufficiently low to measure mixing ratios typically observed in the upper troposphere and lowermost stratosphere for the longer-lived NMHC, however, in air samples from these regions many of the compounds with shorter lifetimes (<5 days) were fre-quently below the detection limit. Observed NMHC con-centrations span several orders of magnitude, dependent on atmospheric region and air mass history, with concentrations typically decreasing with shorter chemical lifetimes.
Correspondence to: A. K. Baker
(angela.baker@mpic.de)
1 Introduction
Beginning in 2005 the CARIBIC project (Civil Aircraft for the Regular Investigation of the atmosphere Based on an Instrument Container; www.caribic-atmospheric.com) has made, and continues to make, monthly deployments of a container-based laboratory equipped to make atmospheric measurements from aboard a Lufthansa Airlines Airbus A340-600 passenger aircraft. Each month four long distance flights are conducted with the 1.5 ton container laboratory in-stalled in the forward cargo bay of the aircraft, followed by de-installation and return to the laboratory. CARIBIC is one of three measurement programs designed to regularly moni-tor atmospheric composition from aboard passenger aircraft (IGAC, 2007, and references therein). Among these endeav-ors, CARIBIC is unique in its ability to routinely measure a broad and comprehensive suite of atmospherically signifi-cant species. A detailed description of the CARIBIC project and container system can be found in Brenninkmeijer et al. (2007).
The CARIBIC instrument package is fully automated and during each flight carries out a variety of real-time trace gas and aerosol measurements. It also collects aerosol samples and whole-air samples, which are analyzed upon return to the laboratory. Measurements of the whole air samples include those for non-methane hydrocarbons (NMHC), for which the technique is presented here. As of December 2008 over 1000 air samples have been collected and analyzed, with measure-ments continuing in a near monthly rhythm.
CARIBIC is deployed typically intersect air masses that are representative of the free troposphere when in the tropics, and both the upper troposphere and lowermost stratosphere (UT/LMS) at mid- to high latitudes. Therefore, CARIBIC al-lows for the routine monitoring of these atmospheric regions; monitoring of the UT/LMS is of particular interest, as this is a complex, less frequently researched part of the atmosphere. Non-methane hydrocarbons have a wide range of source distributions and atmospheric residence times, and as such, measurements of these compounds lend themselves to dis-cussion of many atmospheric issues, such as tropospheric ozone formation, the significance of and changes in anthro-pogenic sources, and timescales associated with transport, mixing and chemistry (Smyth et al., 1996; Parrish et al., 2007); recently, NMHC have also been suggested as a tool for analyzing stratospheric residence times (Ehhalt et al., 2007). CARIBIC NMHC analysis consists of measurement of C2–C8alkanes, aromatics (benzene, toluene, ethylbenzene and the xylenes) and ethyne. Here we provide a description of the analytical procedure and system, along with a synopsis of results.
2 Experimental 2.1 Sample collection
Each month, 28 air samples are collected during CARIBIC flights using an automated air collection system, TRAC (Triggered Retrospective Air Collector); as of Decem-ber 2008 over 1000 air samples have been collected, 944 of which have been analyzed for NMHC. The air collection system consists of two TRAC sampling units, each of which contains 14 glass sampling flasks of nominally 2.67 l (Louw-ers Hapert, the Netherlands). Glass sampling flasks were preferred to stainless steel to accommodate measurements of other compounds (e.g. alkyl nitrates, CO2isotopologues). The inlet and outlet connections of each flask are connected by 1/1000stainless steel tubing to two 16-port electrically ac-tuated multi-position switching valves (Valco), with the inlet selector valve being connected to the pumping system and the outlet valve to ambient air via a further solenoid control valve. The multi-position valves at the inlet and outlet posi-tions also serve to seal the flasks. The pumping system con-sists of two dual-stage metal bellows pumps (Senior Flexon-ics model PWSC 28823-7) in series to one another; the first pump has the two bellows in parallel while the second has them in series. A pressure sensor (SENSYM) is placed be-tween the outlet of the pumping system and the inlet of the sampler to measure the final pressure in the flasks. A 2 µm sintered stainless steel particle filter (Swagelok) is placed at the inlet side of each TRAC to avoid contamination.
Sample collection is fully automated, and is set to begin once the pressure outside the aircraft falls below 480 mbar. The sampling process begins with the flasks being flushed
with ambient air for 300 s (corresponding to about 10 times turnover), after which the outlet side is closed, with the inlet side being closed upon reaching a pressure of 4.5 bar (usu-ally about 10s after closing the outlet). During the flush-ing period, pressure is built up, makflush-ing the actual samplflush-ing time a product of the average turnover time (determined in the laboratory for a wide range of external pressures), to-tal filling time, external pressure at the inlet, and final pres-sure of the flask. Calculated filling times are between 30 and 90 s, with an average of 45 s. Further details on the collec-tion of air samples and the relevant calculacollec-tions are given in Schuck et al. (2009). The average aircraft speed of about 230 m s−1 corresponds to spatial resolution between 7 and 21 km (10 km average) during sample collection. The trigger option has not been implemented and the samples are col-lected according to a fixed schedule where collection times are distributed evenly along the flight track. Samples are nor-mally analyzed within two weeks of collection for NMHC, and also greenhouse gases (Schuck et al., 2009), at the lab-oratory in Mainz, and are then circulated between partner laboratories for measurements of halocarbons (Fraser et al., 1999; O’Sullivan, 2007), as well as isotopic composition of CO2(Assonov et al., 2009). Also the D/H ratio of H2is de-termined for select flights. To assist with interpretation of the data, measurements made from the flasks are complimented by integrations of the in situ measurements over the sam-pling time period (e.g. CO, O3, H2O; see Brenninkmeijer et al., 2007). Additionally, for each sample meteorological pa-rameters are calculated based on ECMWF re-analyzed data, and 8-day backward and 2-day forward trajectories are cal-culated with the KNMI trajectory model, TRAJKS (Scheele et al., 1996; van Velthoven, 2009)
MFC
V1
MFC
MFC
V2 V3 V4 V5
TRAC
GC-FID
Drying Tube
Cryotrap
Cryofocusing loop (in LN2)
Fig. 1. Schematic of the pre-concentration and GC-FID system for measurement of NMHCs (see text). Lines shown in blue, green and red represent the flow of the analyte being introduced (in this case a standard), the hydrogen carrier and analyte to be delivered to the GC, and hydrogen for pre-concentration and drying agent regeneration, respectively. Bent and straight valve connections represent the two possible valve configurations used during analysis.
2.2 NMHC analysis
CARIBIC samples are analyzed for NMHC using an HP-6890 gas chromatograph (GC) coupled with a flame ion-ization detector (FID), where, prior to analysis, the samples are cryogenically pre-concentrated and focused; the analyt-ical process is fully automated and controlled by a micro-processor system. A schematic of the NMHC measurement system, with valves positioned as they are after just before starting a pre-concentration/measurement cycle, is shown in Fig. 1. At this stage the sample to be analyzed has been pre-concentrated and is being sent to the cryofocusing loop prior to introduction to the GC, and the drying agent is being re-generated with heating (not shown) and a reverse flow of hy-drogen. The TRAC samplers and the system standards are connected to the sampling system via a 10-port automated switching valve (Valco). The two samplers are analyzed se-quentially, along with a series of standards, on two consec-utive days, subsequent to a calibration analysis of the stan-dards employed. In general, only one NMHC analysis is possible for CARIBIC samples, as the large volume of air required for the measurements (1 l at STP) means that mul-tiple analyses would severely restrict the amount of sample remaining for other measurements.
At the start of the analysis, the analyte (either an aliquot of standard or air from the TRAC sampler) is introduced to the system and water vapor is removed by passing through a dry-ing tube containdry-ing magnesium perchlorate as a drydry-ing agent
(Mg(ClO4)2)at a flow rate of 50 ml min−1. The 700 glass drying tube (1/400internal diameter) is filled over 400with the drying agent, which is confined at each end by glass wool. The drying tube is at 55◦C while sample is flowing through and is regenerated by heating at 80◦C for 25 min while flush-ing with hydrogen. Heatflush-ing of the dryflush-ing agent serves not only as a regeneration step, but has also been shown to sig-nificantly reduce any loss of larger (C≥8) NMHC (Rudolph et al., 1986).
sometimes co-eluted with an unidentified compound, most likely an oxygenated volatile organic compound (OVOC); this was also the case for i-butane in two samples. These larger NMHC are also frequently below the limit of detec-tion for the system, making the influence of drying diffi-cult to determine, however, for a sufficient number of un-dried samples, peak areas could be reliably determined for i-pentane, n-pentane, hexane, benzene and toluene. These had differences of up to 5% between dried and undried sam-ples. Owing to the frequency of measurements below the limit of detection combined with the influence of co-eluting compounds, peak areas could not be reliably determined for the remaining C5–C8NMHC in those samples where the dry-ing agent was bypassed.
The low levels of NMHC in the atmosphere necessitate pre-concentration of the sample prior to analysis. There-fore, after drying the sample is pre-concentrated by pass-ing through a stainless steel loop (1/800, 15 cm long) filled
with Carbopack BHT adsorbent (mesh 60/80). For pre-concentration the loop is lowered into in a Dewar where it is held over, but not immersed in, liquid nitrogen and cooled to about−130◦C. This is sufficiently cold for the quantitative trapping of NMHC while providing for the near complete re-moval of major atmospheric constituents, such as nitrogen and oxygen, as well as minor constituents, such as methane and carbon dioxide. The sample flow through the system of 50 ml min−1is controlled by a mass flow controller (MKS Instruments, 100 sccm N2). Using a trapping time of 20 min, a 1 l aliquot of sample air (STP) is processed. The loop is iso-lated from the sample flow after the pre-concentration step, and, following a brief equilibrium period (30 s), the sample is desorbed and re-volatilized by lifting the loop from above the liquid nitrogen and heating to 90◦C. The re-volatilized
sample is then sent to the cryo-focusing loop, which is a 175 cm section of ultimetal WCOT CP7120 column (Varian Chrompack, 0.53 mm ID, 0.8 mm OD, 1.0 µm film thickness) in a flow of H2 carrier gas. A coiled 30 cm section of the cryo-focusing loop is immersed in liquid nitrogen, thereby trapping the sample. The loop is then lifted from the liquid nitrogen and allowed to heat up to room temperature, thus permitting the analyte to flow into the GC system. Cryo-focusing ensures an optimal peak shape, and also serves to more effectively separate the C2, and to a lesser extent the C3 and C4, hydrocarbons before reaching the GC column. Total sample preparation time is 60 min.
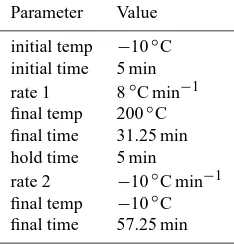
The HP6890 GC houses a 150 m Petrocol DH column (0.25 mm ID, 1.0 µm film thickness) connected to an FID, and the analysis is 60 min long (making the total measure-ment time with pre-concentration two hours for each sam-ple). The oven operates on a temperature program beginning at−10◦C, with a final temperature of 200◦C; full parameters are provided in Table 1. Nitrogen and synthetic air used for the system are supplied by cylinders (99.999% and 99.9% purity, respectively) and hydrogen is supplied by a Parker Balston Hydrogen Generator, model H2-300 (99.99999+%
Table 1. Parameters for the GC program.
Parameter Value
initial temp −10◦C initial time 5 min rate 1 8◦C min−1 final temp 200◦C final time 31.25 min hold time 5 min rate 2 −10◦C min−1 final temp −10◦C final time 57.25 min
purity). Prior to introduction to the system the synthetic air is passed over a Pt catalyst heated to 380◦C to oxidize any con-taminant hydrocarbons and then flows through a Supelcarb HC trap. For each analysis, multiple blanks of the synthetic air are analyzed to detect if there are any remaining contam-inants. The signal from the FID is output to a PC running Agilent Chemstation software. Each chromatogram is man-ually reprocessed to ensure correct peak identification, shape and consistent baseline determination. Chromatograms rep-resentative of the primary standard and a CARIBIC sample are shown in Fig. 2.
2.3 Standards and calibration
Multiple standards are employed during each analysis and include one primary standard and four whole air working standards (Table 2). The primary standard currently in use (NPL07) is a gravimetrically prepared mixture of 30 NMHC in nitrogen purchased from and calibrated by the National Physical Laboratory (Teddington, United Kingdom, NPL Primary Reference Gas Mixture), with a quoted uncertainty of 0.08 ppbv for each compound (∼2%) (NPL, 2008). Prior to 2007 a different NPL standard was used (NPL04) and this is a standard of similar preparation method, although with slightly different NMHC concentrations, as the NPL07 stan-dard. Comparison between the two shows good agreement (Table 2), and the two standards are occasionally compared to check for drift or instability.
i-o ctan e Eth yn e Eth an e P ro pane i-B utane n -B utane i-P en ta ne n -Pen tan e 2 -me -Pen tan e n -H ex an e Ben ze n e To lu en e n -O ctan e Eth yl b en ze n e o -X ylene m+ p -Xyle n e n -H ep tan e
Fig. 2. Chromatograms from analysis of the primary standard (top) and of a sample collected in the upper troposphere (bottom). Peaks analyzed for CARIBIC samples are labeled in the primary standard chromatogram; peaks not considered (e.g. alkenes, halocarbons) are unlabeled.
function of the dilution system. Overall linearity of the sys-tem was checked using multiple analyses at these dilutions as well as of the undiluted standard. For all compounds con-sidered the correlation coefficient was better than 0.995, with offsets being less than 1 pptv.
The primary standard is used to determine per carbon re-sponse factors (PCRFs) for individual compounds, and these are in turn used to determine mixing ratios of the CARIBIC samples. For compounds with six or fewer carbons, the PCRFs are nearly identical, and are also stable over long pe-riods of time (Fig. 3). However, compounds with higher car-bon numbers (i.e. compounds having longer retention times on the analytical column), give rapidly decreasing responses, while ethyne has a slightly larger response. This behavior has been observed by other laboratories measuring NMHC em-ploying similar techniques (i.e. pre-concentration followed by GC-FID analysis) and is considered to be a product of detector and system parameters and configuration (Colman et al., 2001; Apel et al., 2003). Sample mixing ratios are determined from the individual compound response factors, with the exceptions being 3-methylpentane and cyclohex-ane, which are not in the primary standard. The carbon response factors for 2-methlypentane and hexane, respec-tively, are used to determine per carbon response factors for 3-methylpentane and cyclohexane.
Table 2. Standards, limits of detection (LOD), and precision of the GC-FID system.
LOD NPL07a NPL04a 1x(%)b CFL1c SIL191c SIL192c SIL193c Precisiond
Ethyne 1 4.13±0.08 9.06±0.18 −1.8% 634±12 143±1.2 83±1.2 207±3.8 0.9% Ethane 1 4.08±0.08 8.17±0.16 −1.6% 2455±17 1099±7.2 565±4.2 793±5.3 0.2% Propane 1 4.08±0.08 3.63±0.07 −2.8% 1104±28 340±3.8 141±2.0 261±3.2 0.8% i-Butane 1 4.10±0.08 1.2±0.04 −2.5% 361±2.8 154±1.3 123±1.1 152±1.3 0.1% n-Butane 1 3.98±0.08 1.9±0.04 −2.4% 634±5.7 189±1.6 79±0.8 115±1.1 0.3% i-Pentane 1 3.97±0.08 1.39±0.03 −2.9% 363±3.5 161±1.5 122±1.1 191±1.5 0.3% n-Pentane 1 4.03±0.08 1.11±0.02 −1.8% 253±2.7 74±0.8 41±0.5 58±0.4 0.4% 2-methyl-Pentane 1 3.98±0.08 1.79±0.04 −2.2% 91±0.8 41±0.4 33±0.2 44±0.3 0.3% 3-methyl-Pentane 1 2.77±0.06 53±0.4 22±0.3 17±0.2 23±0.3 0.4% n-Hexane 1 3.98±0.08 3.15±0.06 −1.6% 79±0.6 30±0.7 19±0.4 21±1.1 1.5% Benzene 3 4.01±0.08 5.39±0.11 −2.8% 233±2.5 91±6.3 40±2.7 85±3.2 2.3%
Cyclohexane 1 4.76±0.1 45±0.5 92±0.9 8±0.2 0.6%
i-Octane 1 4.01±0.08 33±0.7 20±1.1 12±0.4 17±0.6 3.1%
n-Heptane 1 3.93±0.08 2.42±0.05 −1.7% 34±1.6 20±2.4 14±1.0 4.3% Toluene 1 3.97±0.08 4.16±0.08 −3.4% 379±9.7 179±6.9 149±5.0 160±3.2 1.6%
n-Octane 1 3.97±0.08 15±1.4 14±1.5 13±1.3 10±0.8 4.2%
Ethylbenzene 3 4.1±0.08 1.7±0.03 −2.9% 56±4.1 21±1.9 29±2.6 16±1.5 4.1% m+p-Xylene 3 4.06±0.08 2.11±0.04 2.8% 140±14 24±2.4 54±6.1 23±1.8 4.6% o-Xylene 3 4.03±0.08 1.39±0.03 −3.6% 35±3.6 11±1.1 23±2.6 11±0.9 5.4% avalues (in ppbv) given by NPL; error represents 95% confidence level
bdifference between the quoted value of NPL04 and that determined when measured against NPL07 as a percentage of the quoted value.
cvalues given in pptv; error represents standard deviation (1σ )
dmean percent relative standard deviation of whole air standard calibrations (n=5)
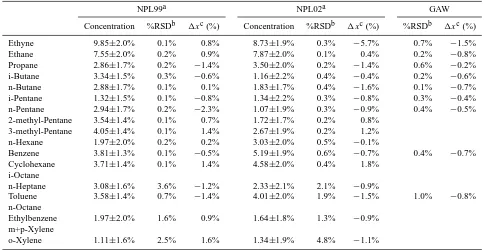
Table 3. Results of comparison with CARIBIC-1 and GAW standards (see text).
NPL99a NPL02a GAW
Concentration %RSDb 1xc(%) Concentration %RSDb 1xc(%) %RSDb 1xc(%)
Ethyne 9.85±2.0% 0.1% 0.8% 8.73±1.9% 0.3% −5.7% 0.7% −1.5%
Ethane 7.55±2.0% 0.2% 0.9% 7.87±2.0% 0.1% 0.4% 0.2% −0.8%
Propane 2.86±1.7% 0.2% −1.4% 3.50±2.0% 0.2% −1.4% 0.6% −0.2%
i-Butane 3.34±1.5% 0.3% −0.6% 1.16±2.2% 0.4% −0.4% 0.2% −0.6%
n-Butane 2.88±1.7% 0.1% 0.1% 1.83±1.7% 0.4% −1.6% 0.1% −0.7%
i-Pentane 1.32±1.5% 0.1% −0.8% 1.34±2.2% 0.3% −0.8% 0.3% −0.4% n-Pentane 2.94±1.7% 0.2% −2.3% 1.07±1.9% 0.3% −0.9% 0.4% −0.5% 2-methyl-Pentane 3.54±1.4% 0.1% 0.7% 1.72±1.7% 0.2% 0.8%
3-methyl-Pentane 4.05±1.4% 0.1% 1.4% 2.67±1.9% 0.2% 1.2% n-Hexane 1.97±2.0% 0.2% 0.2% 3.03±2.0% 0.5% −0.1%
Benzene 3.81±1.3% 0.1% −0.5% 5.19±1.9% 0.6% −0.7% 0.4% −0.7%
Cyclohexane 3.71±1.4% 0.1% 1.4% 4.58±2.0% 0.4% 1.8%
i-Octane
n-Heptane 3.08±1.6% 3.6% −1.2% 2.33±2.1% 2.1% −0.9%
Toluene 3.58±1.4% 0.7% −1.4% 4.01±2.0% 1.9% −1.5% 1.0% −0.8%
n-Octane
Ethylbenzene 1.97±2.0% 1.6% 0.9% 1.64±1.8% 1.3% −0.9% m+p-Xylene
o-Xylene 1.11±1.6% 2.5% 1.6% 1.34±1.9% 4.8% −1.1%
aconcentrations given in ppbv; error represents the 95% confidence limit (as a percentage of the concentration)
b%RSD = percent relative standard deviation (n=5)
cdifference between the measured and actual/quoted values, as a percentage of the actual concentration
Currently, the CARIBIC project is in its second phase of operation; the first phase began in 1996 and contin-ued through 2002, with measurements conducted from a different, but similarly equipped, instrument container in-stalled onboard an LTU Airlines Boeing 767 passenger air-craft (Brenninkmeijer et al., 1999). During the first phase (CARIBIC-1) NMHC were analyzed using GC-MS (gas chromatography - mass spectrometry) of air samples col-lected in stainless steel sampling flasks (M¨uhle et al., 2002; Rhee et al., 2005). To ensure that the calibration scales of the two data sets are in agreement, the NPL standards used during CARIBIC-1 analysis were measured against the cur-rent CARIBIC NPL standard using the curcur-rent GC system. For the majority of NMHC, measured concentrations were within the range of the quoted uncertainties given for the standards, which were between 1.3 and 2.2% (Table 3). The only two exceptions were n-pentane in NPL99 and ethyne in NPL02, although even their deviations were less than 5%. It should be noted that the ages of the standards were seven (NPL02) and ten (NPL99) years, which exceeds the guaran-tee period of two years set by NPL, and the influence of age on standard stability could be a factor influencing compari-son. However, overall agreement was good, and no appre-ciable long-term changes in stability were readily apparent from the measurements, ultimately indicating that measure-ments from the two phases of CARIBIC are using closely related, traceable scales.
The CARIBIC NPL standard was also compared with that of an outside institution (Institute of Meteorology and Cli-mate Research Forschungszentrum Karlsruhe, IMK-FKU) as part of a multi-institution inter-comparison (official au-dit) conducted for the World Meteorological Organization-Global Atmospheric Watch (WMO-GAW) program for volatile organic carbon (VOC) analysis. The audit consisted of a round-robin style inter-comparison of several standards. As the rotation between laboratories was not complete at the time of submission, the concentrations of the standards and official, overall results of the audit are not available for publication, and only relative results of one standard can be given here (Table 3). As with the internal comparison be-tween various CARIBIC NPL standards, agreement with the audit standard was very good. Agreement is, as can be deter-mined from Table 3, well within the WMO-GAW guidelines for VOC measurements which recommend precisions of 5% for C2–C5alkanes and/or ±15 pptv for mole fractions less than 100 pptv (WMO-GAW, 2007).
2.4 Sample data
Table 4. Overview of NMHC results for both the upper troposphere and lowermost stratosphere. Mixing ratios are given in pptv.
Upper Troposphere (n=640) Lowermost Stratosphere (n=304)
Mean (±1σ ) Min Max %BDLa Mean (±1σ ) Min Max %BDLa
Ethyne 90±43 18 220 0 31±22 LOD 117 5
Ethane 575±217 202 1717 0 352±164 88 1067 0
Propane 72±58 8 385 0 35±31 LOD 234 4
i-Butane 9±10 LOD 65 7 3±3 LOD 13 51
n-Butane 14±17 LOD 113 3 6±4 LOD 33 15
i-Pentane 6±8 LOD 67 33 2±2 LOD 9 74
n-Pentane 4±5 LOD 35 17 3±1 LOD 8 32
2-methylPentane 3±4 LOD 27 82 3±3 LOD 15 90
3-methylPentane 2±2 LOD 20 85 1±1 LOD 10 95
n-Hexane 2±2 LOD 25 42 2±1 LOD 6 56
Benzene 20±18 LOD 179 5 10±8 LOD 32 42
Cyclohexane 2±3 LOD 16 93 1±1 LOD 2 96
i-Octane 2±1 LOD 5 96 3±3 LOD 8 96
n-Heptane 2±1 LOD 13 54 2±1 LOD 6 65
Toluene 5±11 LOD 149 29 2±1 LOD 8 70
n-Octane 1±1 LOD 7 81 2±1 LOD 5 88
Ethylbenzene 2±2 LOD 7 95 100
m+p-Xylene 4±4 LOD 19 94 100
o-Xylene 3±2 LOD 8 98 100
a%BDL indicates the percentage of samples where the compound of interest was below the limit of detection
(LOD; see Table 3)
observed in the free and upper troposphere, and, the ranges of mixing ratios are larger than in air masses influenced by stratospheric air. The timescales of mixing and transport of air masses observed by CARIBIC are generally much longer than the chemical lifetimes of many of the NMHC measured. Upper tropospheric air masses that are encountered have usu-ally not been in the boundary layer for a week or more prior to sampling, and in the lowermost stratosphere air masses are considerably much older, as the timescales of troposphere-stratosphere exchange are on the order of weeks to months. This results in concentrations of many compounds frequently being below their limit of detection, and is particularly true in the extra-tropics, where about 40% of the flight time is spent in the transition layer above the tropopause.
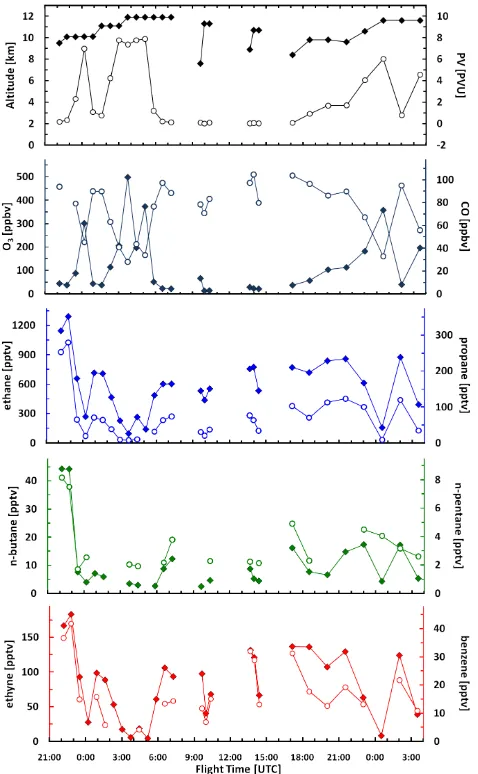
Typical NMHC results are exemplified during a series of flights between Frankfurt, Germany and Guangzhou, China and between Guangzhou and Manila in the Philip-pines during February of 2008 (Fig. 4). The flights began on 25 February, leaving Frankfurt at 21:00 UTC and arriv-ing in Guangzhou at 08:00 UTC on 26 February. A round-trip flight was conducted between Guangzhou and Manila between 09:00 and 15:00 UTC on 26 February, and the air-craft left Guangzhou at 20:00 UTC, returning to Frankfurt at 04:00 UTC on 27 February. This flight was selected both because it has a number of features that are characteristic of NMHC measured in CARIBIC samples and also because measurements of greenhouse gases from the same flight were discussed in another publication (see Schuck et al., 2009).
The two samples having the highest levels of NMHC were collected at the beginning of the flight from Frankfurt to Guangzhou and have 8-day back-trajectories originating in the boundary layer over the Atlantic Coast of North Amer-ica; the same air mass origin is also observed for the sec-ond to last sample, collected at 02:00 UTC, however ele-vations in NMHC are not as substantial. Conversely, the lowest values of NMHC represent samples collected in the tropopause layer and/or lowermost stratosphere; these sam-ples are also characterized by increased potential vortic-ity [PV>2PVU (10−6K kg−1m2s−1)] and ozone concen-trations (O3>100 ppbv), as well as decreased levels of car-bon monoxide (CO<50 ppbv). As stated above, the life-times of many of the NMHC measured are shorter than the times scales of troposphere-stratosphere exchange, and sig-nificantly lower mixing ratios are observed, as well as many below the detection limit. The remaining samples represent upper tropospheric air and backwards trajectories calculated for these samples indicate no recent influence by boundary layer air.
Fig. 4. Mixing ratios for select NMHC during a series of flights between Frankfurt, Guangzhou and Manila during February 2008 (see text for description). Closed diamonds refer to the scale on the left while open circles refer to the scale on the right of each plot. Samples collected through 08:00 UTC are from the flight from Frankfurt and Guangzhou; samples collected between 09:30 and 15:30 UTC are from the round trip flight between Guangzhou and Manila (3 on each leg); samples collected after 17:00 UTC represent the return from Guangzhou to Frankfurt.
between flights and there is no obvious latitudinal trend when considering CARIBIC data as a whole, as NMHC mixing ra-tios are also dependent on a number of other factors such as season, latitude, and prevailing meteorological conditions.
3 Summary and conclusions
Over 900 whole air samples have been collected since 2005 during monthly flights of the CARIBIC system and analyzed for NMHC, allowing for the regular analysis of NMHC in the upper troposphere and lowermost stratosphere. Hydrocarbon
7 8 9 10 11 12 13
0 200 400 600 800 1000 1200 1400
A
lti
tud
e
[k
m
]
Ethane [pptv]
Fig. 5. Relationship between ethane mixing ratios and altitude during return flights between Frankfurt, Guangzhou and Manila in February 2008. Tropospheric samples are represented by filled circles, open squares represent samples with backward trajectories originating in North America and open diamonds represent samples with stratospheric influence.
analysis comprises GC-FID measurements of a suite of 20 individual gases from 28 glass sampling flasks filled during a series of monthly flights. The precision of the system was found to be better than 6% for all compounds and better than 2% for most (at 1σ). Inter-comparison between standards from the first phase of CARIBIC and the second phase show that the two are using closely related and easily traceable scales, and inter-comparison of standards with an outside in-stitution indicate accuracies within the system precision as well as compliance with the WMO-GAW VOC guidelines.
Observed differences between NMHC in tropospheric and stratospheric regimes can be qualitatively attributed to air mass transport and chemical processing, and likely have po-tential to provide more quantitative information. As the CARIBIC container continues to be deployed monthly, it is hoped that the growing number of NMHC measurements will provide a wider statistical base for these discussions.
Acknowledgements. The authors would like to thank all of the
CARIBIC partners at our partner institutions, at Lufthansa Airlines and Lufthansa Technik. Particular thanks are owed to Martin Ko-erner for his assistance with NMHC analysis, to Claus Koeppel for his work on the TRAC system and Dieter Scharffe for the container operation. We would also like to thank Rainer Steinbrecher and Stephan Thiel of the IMK-FKU for their work on the WMO-GAW VOC audit. The GC system was initially set up by Bohdan Randa and Pavel Matuska. Further information about CARIBIC, as well as information on obtaining CARIBIC data can be found at http://www.caribic-atmospheric.com/.
The service charges for this open access publication have been covered by the Max Planck Society.
Edited by: D. Riemer
References
Apel, E. C., Calvert, J. G., Gilpin, T. M., Fehsenfeld, F., and Lonne-man, F: Nonmethane Hydrocarbon Intercomparison Experiment (NOMHICE): Task 4, ambient air, J. Geophys. Res., 108, 4300, doi:10.1029/2002JD002936, 2003.
Assonov, S., Taylor, P., and Brenninkmeijer, C. A.: A system for high quality CO2 isotope analysis of air samples collected by the CARIBIC Airbus A340-600, Rapid Commun. Mass Sp., 23, 1347–1363, 2009.
Brenninkmeijer, C. A. M., Crutzen, P. J., Fischer, H., G¨usten, H., Hans, W., Heinrich, G., Heintzenberg, J., Hermann, M., Immel-mann, T., Kersting, D., Maiss, M., Nolle, M., Pitscheider, A., Pohlkamp, H., Scharffe, D., Specht, K., and Wiedensohler, A.: CARIBIC – Civil aircraft for global measurement of trace gases and aerosols in the tropopause region, J. Atmos. Ocean. Tech., 16, 1373–1383, 1999.
Brenninkmeijer, C. A. M., Crutzen, P., Boumard, F., Dauer, T., Dix, B., Ebinghaus, R., Filippi, D., Fischer, H., Franke, H., Frieß, U., Heintzenberg, J., Helleis, F., Hermann, M., Kock, H. H., Koep-pel, C., Lelieveld, J., Leuenberger, M., Martinsson, B. G., Miem-czyk, S., Moret, H. P., Nguyen, H. N., Nyfeler, P., Oram, D., O’Sullivan, D., Penkett, S., Platt, U., Pupek, M., Ramonet, M., Randa, B., Reichelt, M., Rhee, T. S., Rohwer, J., Rosenfeld, K., Scharffe, D., Schlager, H., Schumann, U., Slemr, F., Sprung, D., Stock, P., Thaler, R., Valentino, F., van Velthoven, P., Waibel, A., Wandel, A., Waschitschek, K., Wiedensohler, A., Xueref-Remy, I., Zahn, A., Zech, U., and Ziereis, H.: Civil Aircraft for the reg-ular investigation of the atmosphere based on an instrumented container: The new CARIBIC system, Atmos. Chem. Phys., 7, 4953–4976, 2007,
http://www.atmos-chem-phys.net/7/4953/2007/.
Colman, J. J., Swanson, A. L., Meinardi, S., Sive, B. C., Blake, D. R., and Rowland, F. S.: Analysis of a wide range of volatile organic compounds in whole air samples collected during PEM-tropics A and B, Anal. Chem., 73, 3723–3731, 2001.
Ehhalt, D. H., Rohrer, F., Blake, D. R., Kinnison, D. E., and Konopka, P.: On the use of nonmethane hydrocarbons for the de-termination of age spectra in the lower stratosphere, J. Geophys. Res., 112, D12208, doi:10.1029/2006JD007686, 2007.
Fraser, P. J., Oram, D. E., Reeves, C. E., Penkett, S. A., and McCul-loch, A.: Southern hemispheric halon trends (1978–1998) and global halon emissions, J. Geophys. Res., 104, 15985–16000, 1999.
IGAC: Special Issue on routine measurements from mobile plat-forms (CARIBIC, MOZAIC, CONTRAIL, TROICA, cargo ships), IGAC Newsletter 37, 2–30, 2007.
M¨uhle, J., Zahn, A., Brenninkmeijer, C. A. M., Gros, V., and Crutzen, P. J.: Air mass classification during the INDOEX Ronald Brown cruise using measurements of non-methane hy-drocarbons, CH4, CO2, CO,14CO andδ18O(CO), J. Geophys. Res., 107, 8021, doi:10.1029/ 2001JD000730, 2002.
Grenfell, R., Brookes, C., Vargha, G., Quincey, P., Milton, M., Woods, P., and Harris, P.: EURAMET 886 comparison of mul-ticomponent ambient VOC measurements final report, National Physical Laboratory, London, UK, NPL Report AS29, 2008. O’Sullivan, D. A.: Temporal and spatial variability of halogenated
compounds and other trace gases, Ph.D. thesis, University of East Anglia, UK, 2007.
Parrish, D. D., Stohl, A., Forster, C., Atlas, E. L., Blake, D. R., Goldan, P. D., Kuster, W. C., and de Gouw, J. A.: Effects of mix-ing on hydrocarbon mixmix-ing ratios in the troposphere, J. Geophys. Res., 112, D10S34, doi:10.1029/2006JD007583, 2007. Plass-D¨ulmer, C., Schmidbauer, N., Slemr, J., Slemr, F., and
D’Souza, H.: European hydrocarbon intercomparison experi-ment AMOHA part 4: Canister sampling of ambient air, J. Geo-phys. Res., 111, D04306, doi:10.1029/2005JD006351, 2006. Pollmann, J., Helmig, D., Hueber, J., Plass-D¨ulmer, C., and Tans,
P.: Sampling, storage, and analysis of C2–C7non-methane hy-drocarbons from the US National Oceanic and Atmospheric Ad-ministration Cooperative Air Sampling Network glass flasks, J. Chromatogr. A, 1188, 75–87 2008.
Rhee, T. S., Brenninkmeijer, C. A. M., M¨uhle, J., van Velthoven, P. F. J., Hermann, M., Zahn, A., Oram, D. E., Scharffe, D. H., Koeppel, C., Fischer, H., and Lelieveld, J.: A case study of rapid mixing across the extratropical tropopause based on Civil Air-craft for the Regular Investigation of the Atmosphere Based on an Instrumented Container (CARIBIC) observations, J. Geophys. Res., 110, D22301, doi:10.1029/2005JD005890, 2005
Rudolph, J., Johnene, F. J., and Khedim, A.: Problems connected with the analysis of halocarbons and hydrocarbons in the non-urban atmosphere, Int. J. Environ. Anal. Chem. 27, 97–122, 1986.
Schuck, T. J., Brenninkmeijer, C. A. M., Slemr, F., Xueref-Remy, I., and Zahn, A.: Greenhouse gas analysis of air samples collected onboard the CARIBIC passenger aircraft, Atmos. Meas. Tech., 2, 449–464, 2009,
http://www.atmos-meas-tech.net/2/449/2009/.
Smyth, S., Bradshaw, J., Sandholm, S., Liu, S., McKeen, S., Gre-gory, G., Anderson, B., Talbot, R., Blake, D., Rowland, S., Brow-ell, E., Fenn, M., Merrill, J., Bachmeier, S., Sachse, G., Collins, J., Thornton, D., Davis, D., and Singh, H.: Comparison of free tropospheric western Pacific air mass classification schemes for the PEM-West A experiment, J. Geophys. Res., 101, 1743–1762, 1996.
van Velthoven, P. F. J.: Meteorological analysis of CARIBIC by KNMI, http://www.knmi.nl/samenw/campaign support/ CARIBIC/#LH, last access: 10 August 2009, 2009.