Open Access
Research
Development of a theoretical framework for analyzing
cerebrospinal fluid dynamics
Benjamin Cohen
1, Abram Voorhees
2, Søren Vedel
3and Timothy Wei*
1Address: 1Mechanical, Aerospace and Nuclear Engineering, Rensselaer Polytechnic Institute, 110 8th Street, Troy, NY 12180, USA, 2Siemens Healthcare, 51 Valley Stream Parkway, Malvern, PA 19355, USA and 3Department of Micro- and Nanotechnology, Technical University of Denmark, DTU Nanotech Building, 345 East, DK-2800 Kongens Lyngby, Denmark
Email: Benjamin Cohen - [email protected]; Abram Voorhees - [email protected]; Søren Vedel - [email protected]; Timothy Wei* - [email protected]
* Corresponding author
Abstract
Background: To date hydrocephalus researchers acknowledge the need for rigorous but utilitarian fluid mechanics understanding and methodologies in studying normal and hydrocephalic intracranial dynamics. Pressure volume models and electric circuit analogs introduced pressure into volume conservation; but control volume analysis enforces independent conditions on pressure and volume. Previously, utilization of clinical measurements has been limited to understanding of the relative amplitude and timing of flow, volume and pressure waveforms; qualitative approaches without a clear framework for meaningful quantitative comparison.
Methods: Control volume analysis is presented to introduce the reader to the theoretical background of this foundational fluid mechanics technique for application to general control volumes. This approach is able to directly incorporate the diverse measurements obtained by clinicians to better elucidate intracranial dynamics and progression to disorder.
Results: Several examples of meaningful intracranial control volumes and the particular measurement sets needed for the analysis are discussed.
Conclusion: Control volume analysis provides a framework to guide the type and location of measurements and also a way to interpret the resulting data within a fundamental fluid physics analysis.
Background
The central nervous system consists of the brain and spi-nal cord which are bathed in a clear, nearly cell-free fluid termed cerebrospinal fluid (CSF). CSF resides in the sub-arachnoid spaces surrounding the brain and spinal cord, and in four fluid reservoirs within the brain known as the cerebral ventricles. The primary mechanical role of CSF is protecting the brain from abrupt movements and
trans-mitting arterial volume displacement to venous blood which attenuates the intracranial pressure (ICP) pulse. Intracranial dynamics is defined as the complex physical coupling between the brain and the cerebral blood and CSF flows and pressures. A departure from equilibrium intracranial dynamics may lead to hydrocephalus, a com-plex spectrum of diseases, primarily defined by perturba-tion of the cranial contents (CSF volume) and ICP.
Published: 22 September 2009
Cerebrospinal Fluid Research 2009, 6:12 doi:10.1186/1743-8454-6-12
Received: 23 April 2009 Accepted: 22 September 2009
This article is available from: http://www.cerebrospinalfluidresearch.com/content/6/1/12 © 2009 Cohen et al; licensee BioMed Central Ltd.
The original theories of hydrocephalus, as a derangement of CSF bulk flow, an imbalance in production (by the choroid plexus) and absorption (or outflow resistance), led to the invention and ultimate adoption of the shunt as the primary treatment option. Indeed individuals experi-enced improvements after shunting, but shunts were not without complication (in fact have introduced new ones) and, as pointed out by Madsen et al., may have slowed progress, as hydrocephalus was viewed as a solved prob-lem [1]. Over the past two decades the bulk flow interpre-tation has been scrutinized as improvements in flow-sensitive magnetic resonance imaging (MRI) have shown pulsatile CSF flow at nearly all intracranial sites [2]. While much of the hydrocephalus research community remains divided as to the relative importance of the bulk and pul-satile components of CSF flow there is increasing interest across this divide to obtain and interpret clinical data to improve physiological understanding and mathematical modeling of disease development.
Past models of the intracranial space
Mathematical models of the intracranial space are impor-tant to our understanding of hydrocephalus. Historically modeling has been accomplished by simplifying assump-tions as to the physical mechanisms of primary impor-tance. In the case of hydrocephalus, examples of these assumptions would be: 1) CSF is an incompressible, New-tonian fluid, 2) most is produced by the choroid plexus at a constant rate, 3) CSF absorption occurs by a "valve" mechanism into the capillaries (in cases, specifically through the arachnoid granulations) 4) compliance repre-sents the volume storage capacity of tissue as the CSF pres-sure changes, 5) the intracranial space has a fixed volume (i.e. the Monroe-Kellie doctrine), 6) CSF flow is governed by similar equations for current in an electric circuit. Many of these assumptions are based on previous experi-ence and experiments, and are founded to varying degrees.
Numerous investigators have studied hydrocephalus using simplified mathematical models of the CSF spaces. Sivaloganathan et al. showed the commonality between all pressure volume models, derived a pressure evolution equation and provides various solutions based on the functional form of brain compliance [3]. CSF was mod-eled as an incompressible fluid and the single compart-ment's volume change was dictated by the mismatch in formation and absorption rate. An exponential pressure volume relationship, based on studies by Marmarou et al. [4,5], has received the most attention as a model of the intracranial compliance to date.
More detailed models compartmentalized the CSF system into a hydraulic network of pressure volume models,
which were commonly understood through electrical cir-cuit analogs [2,5-9]. Flow and pressure drop were related through the (hydraulic) resistance, in the same form found between current and voltage in an electric circuit (i.e. Ohm's Law). In this framework, large fluid spaces (e.g. ventricles or subarachnoid spaces) were modeled as lumped parameter compartments (pressure volume mod-els) and narrow conduits between them as resistors (or impedance). Early circuit models of this type (i.e. [5,6]) studied bulk flow. More recent models, based on pulsatile flow, utilized the concept of complex impedance (phasors) from RLC electric circuit analysis to study the amplitude modulation and phase lag observed between arterial and CSF flow and pressure variations [2,10].
Hakim et al. [11] stressed the importance of understand-ing the intracranial cavity in terms of classical physics and mechanics concepts, prior to trying to fully explicate com-plex physiological mechanisms in terms of biological phe-nomenon. Mechanically, the brain parenchyma was viewed as a sponge of visco-elactic material with 'cells' of various sizes (e.g. intraparenchymal venous blood and extracellular spaces). A hollow spherical model of homo-geneous elastic brain was used to theoretically determine the stress distribution to relate ventricular enlargement and transmantel pressure differences.
Advances in numerical methods and computational power led to still more detailed models of CSF flow and brain remolding; continuum based modeling. Nagashima
impact the solution; and therefore must be chosen care-fully to obtain a realistic picture of the system being stud-ied.
Investigations which seek to directly interpret clinical data (e.g. MRI, ICP monitoring, etc.) have been limited to pres-entations of relative amplitude and timing of flow, vol-ume and pressure waveforms [10,17-22] or comprehensive descriptions of the intracranial dynamics [23,24] without a clear method of accounting or interpre-tation based on physics principles. Alperin et al. [25] used principles of volume conservation, results of baboon and computational studies [14], and assumed an exponential ICP-volume relation to noninvasively estimate ICP and intracranial elastance.
Discrepancy between past models and control volume analysis
Regardless of the assumptions used to model the intracra-nial space, a clinician's decisions for diagnosis and treat-ment are based on, and limited by, the availability and interpretation of patient specific data in relation to the populations of healthy and diseased. Much has been learned about normal and hydrocephalic intracranial dynamics from previous investigations. Even so, advance-ments incorporating measureadvance-ments within a precise, physically meaningful, direct physics analysis will improve understanding and quantification of disease pro-gression and diagnosis. To date investigators acknowledge the need for elementary fluid mechanics in studying nor-mal and hydrocephalic flow and pressure dynamics and the lack of a comprehensive and accurate quantification of the three-dimensional flow based on basic fluid physics [15].
Two assumptions of the pressure volume models, the absorption mechanism and brain compliance, changed the variable of interest from volume to pressure. This was advantageous because pressure was more readily available than volume information, however the assumed compli-ance affects the intracranial response and hence is an inte-gral part of the phenomenological model. Likewise, circuit analogs introduced pressure into volume (mass) conservation principles; the pressure drop between fluid spaces and the connecting conduit's resistance (or more generally, impedance) dictates the volume flow rate. Therefore, flow through conduits was governed by the pressures within the adjacent compartments, which tran-siently depend on their compliance.
From a first principles fluids perspective mass and momentum conservation lead to independent constraints on the flow of fluid (in this case the primary concern is CSF and blood flow). Mass conservation, or for an
incom-pressible substance volume conservation, determines flow rates while momentum conservation is used to deter-mine the pressure in the flowing fluid. Therefore, utilizing compliance and hydraulic resistance to underscore com-plex intracranial processes to determine CSF pressure, flow and volume, while of clinical utility, my be an unwarranted simplification from a mechanics perspective. In control volume analysis these quantities are deter-mined through separate equations. Continuum based models represent a step in the right direction, however control volumes can be used to account for the same phys-ics in a more direct and simplified framework.
In order to improve our understanding of the normal intracranial state and progression to disorder, we seek to implement the most basic fluid dynamic analysis directly to control volumes within the cranium, allowing a direct mechanical interpretation of the data. The proposed framework is an elementary, foundational fluid mechan-ics formulation called integral control volume analysis [26,27]. The approach entails defining regions in the brain; in the fluid dynamics lexicon these are referred to as 'control volumes'. From a traditional fluid mechanics per-spective it is a first analysis approach because it does not require a detailed knowledge of the entire flow. Conserva-tion equaConserva-tions are written for each control volume being studied. Measurements based directly on the physical meanings of terms in the conservation equations dictate the type and location of data obtained and relates these to other measurements in the same individual. The requisite measurements are those of velocity and pressure at spe-cific locations on the control volumes' surfaces and vol-ume (change) measurements of the control volvol-umes themselves. In effect, this is a budgeting procedure, using fundamental conservation laws (mass and momentum) to keep track of and account for important parameters in the cranium.
Methods
Integral control volume analysis has been widely used among engineers and physicists to extract important phys-ical information about structures and devices within fluid flow. In mechanical and aerospace engineering, control volumes are typically used to calculate the thrust pro-duced by a jet engine based on the flow field through the engine. Likewise, lift on an airfoil (or drag generated by a obstruction to flow) can be computed based on knowl-edge of the velocity field. The same approach may be used to determine the acceleration of a rocket, rate of oil gain/ loss from a hydraulic accumulator and the pressure drop across a sudden expansion in a pipe. These important parameters can be obtained with a minimal knowledge of the flow, hence the utility of the control volume formula-tion. When more detailed analysis is desired, such as the velocity and pressure distribution within the jet engine or on the surface of an airfoil, respectively, then the differen-tial (continuum) forms of the conservation equations must be solved. It is important to note that in the limit as we create an infinite number of infinitesimally small con-trol volumes, we will obtain the differential forms of the mass and momentum conservation equations, the Navier-Stokes equations (e.g. see Ref. [26]), commonly used in hydrocephalus research. Control volume analysis requires similar clinical inputs as continuum models, i.e. velocity, volume and pressure data, but determines overall behav-ior of the device without detailed knowledge of the entire flow.
Theoretical development using fluid dynamics
Before proceeding with a discussion of control volume analysis applied to intracranial control volumes, it would be helpful to review the general theoretical underpinnings of the proposed fluid mechanics framework. The primary advantages of using control volume analysis (i.e. fixed region) as opposed to the system formulation (i.e. fixed mass) to study fluid flow are that: 1) the control volume and control surface are defined at all times and 2) the effect of flow on adjacent structures or devices may be determined and provides more pertinent information than the motion of a specified mass of fluid.
To start, a system may be defined as a collection of fluid particles comprising part of a flow of interest (e.g. a blob of ink, the system, in a hose, the flow of interest). The sys-tem boundaries (to continue the example, the outside sur-face of the ink blob) are such that the same fluid elements are always contained therein. Thus, even though the shape of the system will change in the flow as time progresses, the same particles will always be on the surface of the ink blob, separating ink inside from water outside. Necessar-ily, the mass of a system is constant, and it is in principle possible to write equations of motion for the system, i.e., solve for the system's motion given the applied forces.
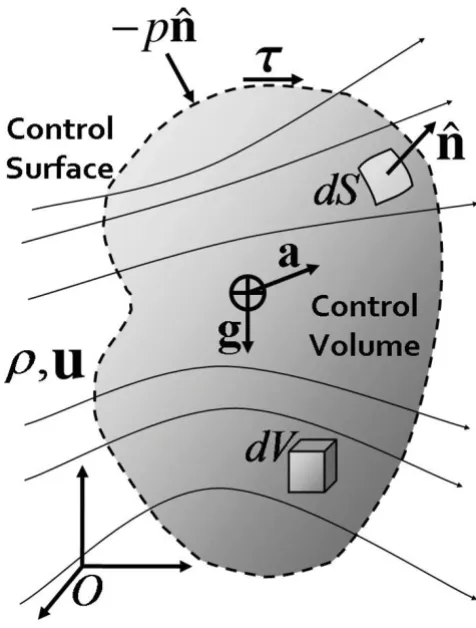
For many flows, however, such a formulation would be intractable or inconvenient at best, due to the difficulty of 'following' the evolving system (ink blob) as it flows (down the hose) and becomes increasingly distorted. For this reason, we define a control volume as a clearly defined space through which fluid may pass. Control volumes are mathematical regions used for analysis and typically coin-cide with some physical boundaries of the flow, but could be arbitrarily defined at the discretion of the user. Figure 1 shows a general or universal control volume within a fluid of mass density ρ with velocity field u flowing through. The external boundary of the control volume is referred to
Universal control volume for definition of terms
Figure 1
Universal control volume for definition of terms. A universal control volume represented by a shaded region within fluid of density ρand velocity vector field u. The con-trol surface is shown as dashed line at the boundary of the control volume. Differential volume and surface area ele-ments, dV and dS, respectively, are shown along with corre-sponding unit outward surface normal vector . Body forces caused by gravity g and acceleration a act on the center of mass of the control volume, while pressure -p
and viscous shear stresses τact on the control surface, nor-mal and tangentially, respectively. Reference frame O is a fixed inertial frame with respect to the control volume.
ˆ n
as the control surface, shown as a dotted boundary in the figure. The advantage of this approach is that the bound-ary of the control volume is prescribed at all times. Typi-cally, one dictates that the control surfaces coincide with some physically meaningful boundary in the flow, e.g., the walls of the hose, so that no fluid will pass through them. In places where the control surface does not coin-cide with physical boundaries, such as at the inlet and out-let to the hose, fluid may flow through the control surface, which does not physically exist. For the flow of blood and CSF, it may be expedient to allow the control volume to move or change shape depending on the flow of interest (i.e. because the ventricle walls move during the cardiac cycle).
It is possible to write the rate of change of any property of a system in terms of control volume parameters. This is the classic Reynolds transport theorem [26,28], which states that the change of any extensive property (e.g. mass, momentum and energy) of the system equals the change of that property in the control volume and the amount flowing through the control surface at any given instant.
One can think of a control volume as a corral built to sub-divide a rancher's pasture. In this analogy, the cranium would be the pasture. Depending on the rancher's needs, he/she will build as many or few corrals within the pasture as needed. So too with this research approach, we can define as many or as few control volumes as a function of the scientific drivers. Minimally, at least one control vol-ume for the CSF and one for the blood is required to study the important interactions that define the intracranial state. Just as the rancher keeps track of animals entering and leaving through the corral gates and the total number of animals inside the corral, control volume analysis is simplified by the fact that only effects occurring at the control surface and net changes within the volume are required. The rancher need not account for every animal at all times, as the system formulation would require.
In order to maintain continuity for the reader the explana-tion of the integral mass and momentum conservaexplana-tion equations, as applied to a general control volume, will be presented in the following two subsections. The first is a physical explanation in words of the conservation equa-tions. The latter, which may be skipped by readers not interested in the full mathematical description, is included for completeness. Both sections discuss the same material, from a written and mathematical prospective, respectively to fully explicate conservation principles as applied to control volumes.
Physical explanation of the integral conservation equations
Conservation laws are commonly used in physics to relate important variables of interest. Hydrocephalus research
and modeling has been no exception. Pressure volume models [3] and electric circuit analogs [2,6] both enforce the condition that mass may not be created or destroyed, or mass conservation. However, using a change in varia-bles, the mass (volume) constraint is written in terms of pressure. From basic fluid mechanics theory an additional constraint on the forces (and hence pressures) is required, as in Ref. [15], where mass and momentum conservation equations were solved numerically.
Mass conservation is simply the accounting of flow in and out of a control volume and the total mass within the con-trol volume. Just like the rancher keeps track of animals entering and leaving through the corral gates and the total number of animals inside the corral, information regard-ing the fluid velocity through the control surface and the total amount of fluid inside the control volume is needed. Note, the total fluid mass (in a control volume) could change because of production/absorption (of CSF), or from changes in volume (e.g. pulsatile volume change of a ventricle or blood vessel). The conservation of mass equation for a control volume states that the time-rate of change of fluid mass within the control volume must equal the net mass flow into the control volume through the control surface plus the net production (production minus absorption) of mass within the control volume. This simplifies analysis because only flow velocities at the control surface and net changes within the control volume enter in the formulation.
Newton's 2nd law stipulates conservation of momentum for all objects, including fluids. For a solid object of mass
Dynamic postural changes are inherently included in the momentum equation; as individuals reposition their heads (e.g. sit up or lay down), both the acceleration and relative alignment with gravity will change. From experi-ence, this will affect the flow and pressures in the control volume, which may be accounted for through the conser-vation equations. Pressure also drives fluid flow and therefore appears in the conservation of momentum equation, but only enters the analysis though its effect at the control surface.
Mathematical explanation of the integral conservation equations The conservation of mass equation for a general control volume is written in mathematical form as:
where:
(i) Rate of change of fluid mass in the control volume
(ii) Net mass flow rate across the control surface
(iii) Net mass production/absorption rate within the con-trol volume
Likewise, the conservation of momentum equations for a general control volume are written:
where:
(i) Rate of change of fluid momentum in the control vol-ume
(ii) Net fluid momentum flow rate across the control sur-face; force due to fluid flow
(iii) Net body forces acting on mass in the control volume
(iv) Net surface forces acting on the control surface
Here we focus on the dominant terms; body forces (3) caused by gravity and acceleration and surface forces (4) due to pressure and viscous shear stresses, respectively.
In these equations the symbols represent physical quanti-ties presented in Table 1 and displayed schematically in Figure 1. The equations and schematic follow the presen-tation in Ref. [26].
Applying control volume analysis
The computationalist or mathematical modeler will actu-ally attempt to solve these or similar equations. For hydro-cephalus, this is extremely difficult and currently requires many assumptions and simplifications, as discussed pre-viously with regard to continuum based models. As exper-imentalists, we ask, "is it possible to use clinical data to evaluate the balance equations directly?" In this manner, it is possible to gain new information if one can isolate a term which cannot be measured or for which nothing is known. For example, in pipe flow, an applied pressure dif-ference causes flow, so that if the pressure drop is known the flow may be determined. Using control volume anayl-sis if the velocity field is known then the pressure drop can be found by applying the momentum equation (2) to the fluid in the pipe. Alternatively, one can use the balance equations to understand what, why, and how changes in the system lead to hydrocephalus.
Control volume analysis is a framework to guide experi-mental method using the most basic fluid dynamics prin-ciples in their simplest form. In addition, using the conservation equations with finite control volumes is an effective way to comprehensively couple spatially sepa-rated and physically distinct clinical data sets (e.g. pres-sure, velocity and volume). It is important to note that as many or as few control volumes may be defined depend-ing on the information desired by the clinician. In general, as a minimum, at least one control volume for the CSF
∂
∂t
∫
CV dV+∫
⋅ dS= iCS ii
iii
M
r r
N
u nˆ(1)
∂
∂t
∫
CV dV+∫
⋅ dS= + iCS ii
B iii
S
ru ru u n)
F
F
(
Σ
NΣ
iiv N (2) ˆΣFB g a CV
dV
=
∫
r( − ) (3)ΣFS n
CS CS
p dS dS
=
∫
− ˆ +∫
tt (4) Table 1: Physical quantities and corresponding symbols used in mathematical formulation of conservation equationsPhysical Quantity Symbol
Fluid mass density ρ
Velocity vector field u Net mass production rate
Pressure field p
Viscous stress vector τ Gravitational acceleration g Control volume acceleration a Ventricle wall displacement vector δw
Differential volume element dV Differential control surface area element dS
Unit outward surface normal vector
M
and one for the blood is required to study the important interactions that define the intracranial state, however these spaces may be broken into several smaller control volumes to study the intracranial dynamics on several scales (e.g. see Figure 2). To apply control volume analy-sis, the first step is to define the control volumes of inter-est and to write and simplify the conservation equations as they pertain to each individual control volume. With the exact physical meanings of the terms then understood, measurements are taken to obtain these quantities directly.
Clinical measurements for control volume analysis Measurements obtained by clinicians have been inter-preted through mathematical models and based on rela-tive magnitude and timing of measured flow, pressure and volume waveforms. Other investigations link meas-urements at single sites in the CSF system to onset or pro-gression of hydrocephalus, such as aqueductal stroke volume [18,29], in an effort to simplify diagnosis and show correlation with measurements and other symp-toms. The control volume framework is a general formu-lation of conservation laws typically used in
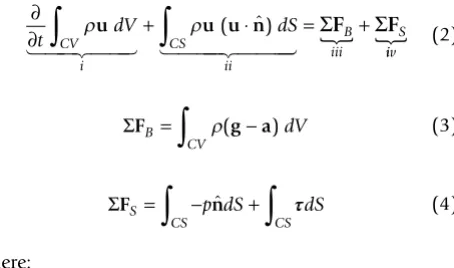
Examples of in vivo control volumes
Figure 2
Examples of in vivo control volumes. The generality of control volume analysis shown through example of four in vivo
hydrocephalus modeling, however it represents the most direct and expedient way to interpret clinical data sets.
Velocities of the intracranial contents have been measured throughout the cardiac cycle using velocity encoded cine Phase-Contrast Magnetic Resonance (PC-MR) imaging. In vivo blood 21,23,25,30,31] and CSF velocities [17-19,21,23-25,29,32-35] have been measured using this technique. PC-MR imaging is commonly used for making velocity measurements like those needed for the control volume formulation. Summing the spatial velocity data, within fluid areas of interest, allows volume and momen-tum flow rates to be computed directly from the images.
The control volume formulation also requires time resolved pressure measurements at several intracranial sites. CSF pressure measurements have been obtained invasively in dogs [10,36], baboons [25], and humans [37-40]. Invasive ICP monitoring is most commonly achieved with ventricular, subdural, or intraparenchymal microtransducers, however lumbar CSF pressure is com-monly measured manometrically in patients with hydro-cephalus [37]. Penn et al. [36] obtained real time (sampling at 256 Hz) and long term pressure at three intracranial sites: the lateral ventricle, the frontal lobe, and the subarachnoid space. Pressure measurements, such as those made with implanted microtransducers, are needed at the sites where velocity is measured. Blood pressure (and velocity) was measured within the large human arteries using a catheter tip strain gauge transducer (and electromagnetic flowmeter) [41]. Zou et al. recently reported blood pressure measurements in the carotid arteries of mongrel dogs using a micro pressure transducer [10]. Blood and CSF pressure measurements will be needed to fully characterize the momentum balance.
In addition to velocity and pressure, the volume (changes) of the fluid spaces also needs to be measured. Several investigators have estimated volume changes directly from medical images [18,19,42,43] or by integrat-ing measured fluid volume flow rate waveforms [20,22,25]. Regardless of the technique used to measure volume change, it is necessary to determine the control volume's extent as a function of time. To supplement pre-vious techniques, we are amending an in-house Digital Particle Image Velocimetry (DPIV) processing program to determine the displacement of the ventricles' walls in MR images. This data can be used, independent of flow meas-ures, to obtain volume changes by adding the change in volume (area change multiplied by slice thickness) for multiple slices. DPIV was developed in the early 1990's to improve upon PIV, which utilized optical interrogation of
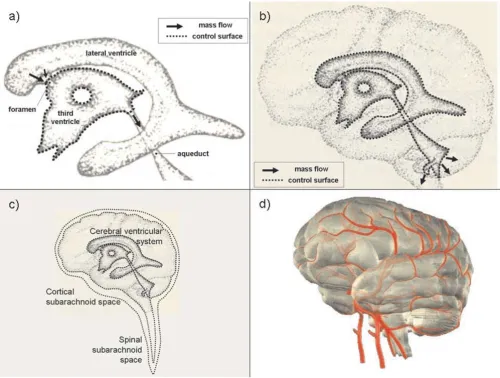
film negatives to determine velocity magnitude and direc-tion. With DPIV, digital images were post-processed on computers to obtain the same information, automating analysis and making it simpler. This technique was ini-tially developed to accurately and reliably estimate 2D velocity vector fields based on intensity variations within particle images of fluid flow [44]. Our DPIV processing program consists of a two-pass intensity correlation tech-nique to determine, with sub-pixel accuracy, the displace-ment of features within digital images [45,46]. The resulting regular array of displacement vectors is then interpolated onto the ventricular walls, as shown in Figure 3. Here the calculated wall displacement vectors, δw, (vec-tor lengths magnified for clarity) are colored based on the magnitude of the wall normal displacement, δw· . Red represents a local distension of the ventricular space while blue is a local contraction of the ventricles; nominal motions labeled with green vectors. This data throughout the cardiac cycle allows the volume change to be esti-mated, and hence for an incompressible fluid (of constant density, ρ) the change in mass can be found. The MR imaging was approved by the institutional committee on research with humans and each volunteer gave written consent prior to the imaging session. DPIV represents an additional method to calculate and validate measures of volume change.
ˆ n
DPIV volume change estimation technique
Figure 3
Velocity, pressure and volume change represent the types of measurements required, and the methods currently available to obtain the pertinent clinical data sets was dis-cussed. Currently, clinical utilization of these techniques and resulting data sets have been restricted by an inade-quate ability to interpret these diverse measurements directly to intracranial volumes of interest.
Results and Discussion
To illustrate the versatility and generality of the control volume framework consider Figure 2, which shows four control volumes of possible interest to understanding intracranial dynamics. As stated previously several control volumes will be needed to fully quantify the important interactions of the intracranial dynamics. Control vol-umes of various sizes may be used to study interactions occurring at different scales.
Figure 2a depicts a control volume containing the CSF within the third ventricle. The arrows represent mass flow (in the nominal direction of bulk flow) at the locations where fluid crosses through the control surface, repre-sented by a dotted line. However, it may be more interest-ing to create a control volume which encloses all the CSF within the ventricular system as shown in Figure 2b, or all the CSF within a given individual as in Figure 2c. Within the latter control volume (Figure 2c) accounting in a sin-gle CSF compartment would simplify such that the change in mass is equal to formation minus absorption with no mass flow term. For an incompressible fluid, the control volume equations simplify to the same volume constraint presented in Ref. [3]. Likewise, blood flow and pressure are of interest in hydrocephalus research. A control vol-ume enclosing all (or a portion) of the cerebral blood is shown in Figure 2d and will be important in the overall intracranial accounting. For each of the example control volumes in Figure 2 the same form of the conservation equations are used initially. However, the equations will take different forms depending on the physical meaning of the terms in the equations. It is to say, each control vol-ume will allow different information to be extracted from the conservation equations, making the choice of control volumes to study very important.
The first step in applying control volume analysis, is to define the control volume(s) of interest and to write and simplify the conservation equations as they pertain to each control volume. Then, once the physical meanings of the terms are determined, data is obtained to calculate these quantities directly. Consider applying the proposed framework to the CSF within the third ventricle, as shown in Figure 2a. Control surfaces coincide with the CSF/brain interface (which may move and deform) and 'imaginary' (or mathematical accounting) surfaces across the foramina and aqueduct bounding the third ventricle.
Control volume analysis typically begins with the mass budget (1) because it is simpler to evaluate and leads to constraints which carry over to the momentum equation. Term (i) in Equation (1), in this case, represents the change of CSF (mass) in the third ventricle. Volume change may be estimated using a variety to techniques, as mentioned previously. Generally, volume (change) meas-urements are based on processing of image data, be it velocity or static images. As mentioned previously, an in-house DPIV processing program is being used to calculate the displacement of the ventricular walls, as shown in Fig-ure 3, directly from MR images. Reliability of volume esti-mates depend on image resolution, the volume change amplitude and technique limitations.
PC-MR produces images in which the pixel intensity is proportional to velocity. Typically, for ease of computa-tion, through plane velocities are obtained when volume flow information is desired. Velocity (image) data taken throughout the cardiac cycle allows volume flow wave-forms to be computed, as has been done previously by numerous investigators for various fluid pathways [17-20,22,25,29,31]. In this example, for the third ventricle, CSF flows through the control surface at the interventricu-lar foramina (of Monroe) from the paired lateral ventri-cles and at the aqueduct/ventricle 'boundary'. PC-MR measurements are possible at these locations (e.g. see [17,21]) and allow direct measurement of the mass flows crossing the control surface, the physical representation of (ii) in the mass budget. It can be seen then that (iii), the net production/absorption rate in the third ventricle, could be estimated with reliable measurements of the other two terms, namely the time varying CSF mass (or volume) of the third ventricle and the net CSF mass (vol-ume) flow through the control surfaces, respectively.
vis-cous forces on the ventricle's walls (which are difficult to measure and generally small e.g. [25]) may be grouped into a 'resistive' term. The body forces (i.e. gravity and acceleration) in equation (3) can be found as long as the volume (change) of the system is known, since these terms are constant throughout the control volume for any head motion. Integral control volume analysis, then, nat-urally incorporates the changes which take place during dynamic postural changes, which can have a significant impact on normal intracranial dynamics as recently shown [47]. So with the flow and pressure measurements, as well as volume (change) estimates, the 'resistance' in the system can be isolated for examination. If the 'resist-ance' is assumed or found to be small, then pressure at a location where measurements may not be possible can be found using the momentum balance equation. Momen-tum conservation, as presented in control volume analy-sis, represents a new way to account for pressure and relate it to flow.
One can see, then, that the power of control volume anal-ysis lies in the fact that only terms accounting for net changes within the system and flow and pressure at the control surface are encountered. Thus the use of control volumes preclude the need for velocity and pressure field information everywhere in the cranium, greatly simplify-ing the analysis. Measurements are directly tied to the physical meaning of terms in the conservation equations, (1) and (2), and obtained using a blend of modern tech-niques such as MR imaging, implantable micro-pressure-transducers, and DPIV processing. With this approach, measurements taken at different locations can be related through the control volume budgets directly using funda-mental conservation principles. In addition, interactions between systems and subsystems can be studied, by using several control volumes of various scales, and are poten-tial locations for key deviations from equilibrium.
Conclusion
Current understanding and accounting of intracranial dynamics and progression to disorder is limited by the availability of clinical data and the ability of the investiga-tor to interpret the data in a relevant, physically meaning-ful way. The control volume formulation incorporates diverse measurements into a fundamental fluid dynamic conservation analysis, yielding a direct mechanical inter-pretation of the data. The application of control volume analysis to intracranial control volumes was discussed and suggestions are made for utilizing this technique in future studies of intracranial dynamics.
Competing interests
The authors declare that they have no competing interests.
Authors' contributions
BC and TW contributed equally to this work by formulat-ing the control volume analysis to general intracranial control volumes. BC drafted the manuscript. TW pro-posed the initial idea of using control volume analysis to guide and interpret intracranial data. SV and AV worked on the DPIV ventricle dilatation processing technique. All authors have read and approved the final version of the manuscript.
Acknowledgements
The authors would like to thank Dr. Mark Wagshul and Dr. Michael Egnor for providing MR data for the ventricle volume change processing.
References
1. Madsen JR, Egnor M, Zou R: Cerebrospinal fluid pulsatility and hydrocephalus: the fourth circulation. Clin Neurosurg 2006, 53:48-52.
2. Egnor M, Rosiello A, Zheng L: A model of intracranial pulsations.
Pediat Neurosurg 2001, 35:284-298.
3. Sivaloganathan S, Tenti G, Drake JM: Mathematical pressure vol-ume models of the cerebrospinal fluid. Appl Math Comp 1998, 94:243-266.
4. Marmarou A, Shulman K, LaMorgese J: Compartmental analysis of compliance and outflow resistance of the cerebrospinal fluid system. J Neurosurg 1975, 43:523-534.
5. Marmarou A, Shulman K, Rosende RM: A nonlinear analysis of the cerebrospinal fluid system and intracranial pressure dynam-ics. J Neurosurg 1978, 48:332-344.
6. Rekate HL, Brodkey JA, Chizeck HJ, Sakka WE, Ko WH: Ventricular volume regulation: a mathematical model and computer simulation. Pediatr Neurosci 1988, 14:77-84.
7. Rekate HL: Circuit diagrams of the circulation of cerebrospi-nal fluid. Pediatr Neurosurg 1994, 21:248-253.
8. Clarke MJ, Meyer FB: The history of mathematical modeling in hydrocephalus. Neurosurg Focus 2007, 22:1-5.
9. Bergsneider M, Alwin AA, Falkson L, Rubinstein EH: The relation-ship of pulsatile cerebrospinal fluid flow to cerebral blood flow and intracranial pressure: a new theoretical model. Acta Neurochir 1998, 71:266-268.
10. Zou R, Park EH, McCormack Kelly E, Egnor M, Wagshul ME, Madsen JR: Intracranial pressure waves: characterisation of a pulsa-tion absorber with notch filter properties using systems anal-ysis. J Neurosurg Pediatr 2008, 2:83-94.
11. Hakim S, Venegas JG, Burton JD: The physics of the cranial cav-ity, hydrocephalus and normal pressure hydrocephalus: mechanical interpretation and mathematical model. Surg Neurol 1976, 5:187-210.
12. Nagashima T, Tamaki N, Matsumoto S, Horwitz B, Seguchi Y: Bio-mechanics of hydrocephalus: a new theoretical model. Neu-rosurgery 1987, 21:898-903.
13. Jacobson EE, Fletcher DF, Morgan MK, Johnston IH: Fluid dynamics of the cerebral aqueduct. Pediatr Neurosurg 1996, 24:229-236. 14. Loth F, Yardimci MA, Alperin N: Hydrodynamic modeling of
cer-ebrospinal fluid motion within the spinal cavity. J Biomech Eng
2001, 123:71-79.
15. Linninger AA, Xenos M, Zhu DC, Somayaji MR, Kondapalli S, Penn RD: Cerebrospinal fluid flow in the normal and hydrocephalic human brain. IEEE Trans Biomed Eng 2007, 54:291-302.
16. Greitz D: Radiological assessment of hydrocephalus: new the-ories and implications for therapy. Neurosurg Rev 2004, 27:145-165.
17. Baledent O, Henry-Feugeas MC, Idy-Peretti I: Cerebrospinal fluid dynamics and relation with blood flow: a magnetic reso-nance study with semiautomated cerebrospinal fluid seg-mentation. Invest Radiol 2001, 36:368-377.
Publish with BioMed Central and every scientist can read your work free of charge "BioMed Central will be the most significant development for disseminating the results of biomedical researc h in our lifetime."
Sir Paul Nurse, Cancer Research UK
Your research papers will be:
available free of charge to the entire biomedical community
peer reviewed and published immediately upon acceptance
cited in PubMed and archived on PubMed Central
yours — you keep the copyright
Submit your manuscript here:
http://www.biomedcentral.com/info/publishing_adv.asp
BioMedcentral
19. Zhu DC, Xenos M, Linninger AA, Penn RD: Dynamics of lateral ventricle and cerebrospinal fluid in normal and hydro-cephalic brains. J Magn Reson Imaging 2006, 24:756-770. 20. Bateman GA: Vascular compliance in normal pressure
hydro-cephalus. Am J Neuroradiol 2000, 21:1574-1585.
21. Enzmann DR, Pelc NJ: Normal flow patterns of intracranial and spinal cerebrospinal fluid defined with phase-contrast cine MR imaging. Radiology 1991, 178:467-474.
22. Enzmann DR, Pelc NJ: Cerebrospinal fluid flow measured by phase-contrast cine MR. AJNR 1993, 14:1301-1307.
23. Greitz D: Cerebrospinal fluid circulation and associated intracranial dynamics. A radiologic investigation using MR imaging and radionuclide cisternography. Acta Radiol Suppl
1993, 386:1-23.
24. Naidich TP, Altman NR, Gonzales-Arias SM: Phase contrast CINE magnetic resonance imaging: normal cerebrospinal fluid oscillation and applications to hydrocephalus. Neurosurg Clin N Am 1993, 4:677-705.
25. Alperin NJ, Lee SH, Loth F, Raksin PB, Lichtor T: MR-intracranial pressure(ICP): A method to measure intracranial elastance and pressure noninvasively by means of MR imaging: baboon and human study. Radiology 2000, 217:877-885.
26. Fox RW, McDonald AT, Pritchard PJ: Introduction to Fluid Mechanics
sixth edition. New York: John Wiley and Sons, Inc; 2004.
27. Panton RL: Incompressible Flow first edition. New York: John Wiley and Sons, Inc; 1984.
28. Benaroya H, Wei T: Hamilton's principle for external viscous fluid-structure interaction. J Sound Vib 2000, 238:113-145. 29. Wagshul ME, McAllister JP, Rashid S, Li J, Egnor MR, Walker ML, Yu
M, Smith SD, Zhang G, Chen JJ, Benveniste H: Ventricular dilation and elevated aqueductal pulsations in a new experimental model of communicating hydrocephalus. Exp Neurol 2009, 218:33-40.
30. Dumoulin CL, Souza SP, Walker MF, Yoshitome E: Time-resolved magnetic resonance angiography. Magn Reson Med 1988, 6:275-286.
31. Pelc LR, Pelc NJ, Rayhill SC, Castro LJ, Glover GH, Herfkens RJ, Miller DC, Jeffrey RB: Arterial and venous blood flow: noninvasive quantitation with MR imaging. Radiology 1992, 185:809-812. 32. Enzmann DR, Pelc NJ: Brain motion: measurement with
phase-contrast MR imaging. Radiology 1992, 185:653-660.
33. Feinberg DA, Mark AS: Human brain motion and cerebrospinal fluid circulation demonstrated with MR velocity imaging.
Radiology 1987, 163:793-799.
34. Quencer RM, Donavan Post MJ, Hinks RS: Cine MR in the evalua-tion of normal and abnormal CSF flow: intracranial and intraspinal studies. Neuroradiol 1990, 32:371-391.
35. Thomsen C, Stahlberg F, Stubgaard M, Nordell B: Fourier analysis of cerebrospinal fluid flow velocities: MR imaging study. Radi-ology 1990, 177:659-665.
36. Penn RD, Lee MC, Linninger AA, Miesel K, Lu SN, Stylos L: Pressure gradients in the brain in an experimental model of hydro-cephalus. J Neurosurg 2005, 102:1069-1075.
37. Czosnyka M, Pickard JD: Monitoring and interpretation of intracranial pressure. J Neurol Neurosurg Psychiatry 2004, 75:813-821.
38. Czosnyka M, Czosnyka Z, Keong N, Lavinio A, Smielewski P, Momjian S, Schmidt EA, Peterella G, Owler B, Pickard JD: Pulse pressure waveform in hydrocephalus: what it is and what it isn't. Neu-rosurg Focus 2007, 22:1-7.
39. Eide PK: Assessment of childhood intracranial pressure recordings using a new method of processing intracranial pressure signals. Pediatr Neurosurg 2005, 41:122-130.
40. Owler BK, Fong KC, Czosnyka Z: Importance of ICP monitoring in the investigation of CSF circulation disorders. Br J Neurosurg
2001, 15:439-440.
41. Mills CJ, Gabe IT, Gault JH, Mason DT, Ross J Jr, Braunwald E, Shil-lingford JP: Pressure-flow relationships and vascular imped-ance in man. Cardiovasc Res 1970, 4:405-417.
42. Lee E, Wang J, Mezrich R: Variation of lateral ventricular vol-ume during the cardiac cycle observed by MR imaging. Am J Neuroradiol 1989, 10:1145-1149.
43. Rekate HL, Erwood S, Brodkey JA, Chizeck HJ, Spear T, Ko W, Mon-tague F: Etiology of ventriculomegaly in choroid plexus papil-loma. Pediat Neurosci 1985, 12:196-201.
44. Willert CE, Gharib M: Digital particle image velocimetry. Exp Fluids 1991, 10:181-193.
45. Grega LM, Wei T, Leighton RI, Neves JC: Turbulent mixed-boundary flow in a corner formed by a solid wall and a free surface. J Fluid Mech 1995, 294:17-46.
46. Hsu TY, Grega LM, Leighton RI, Wei T: Turbulent kinetic energy transport in a corner formed by a solid wall and a free sur-face. J Fluid Mech 2000, 410:343-366.