R E S E A R C H A R T I C L E
Open Access
Experimental Study of Cement Sandstone/Shale
-Brine - CO
2
Interactions
Susan A Carroll
*, Walt W McNab and Sharon C Torres
Abstract
Background:Reactive-transport simulation is a tool that is being used to estimate long-term trapping of CO2, and wellbore and cap rock integrity for geologic CO2storage. We reacted end member components of a heterolithic sandstone and shale unit that forms the upper section of the In Salah Gas Project carbon storage reservoir in Krechba, Algeria with supercritical CO2, brine, and with/without cement at reservoir conditions to develop experimentally constrained geochemical models for use in reactive transport simulations.
Results:We observe marked changes in solution composition when CO2reacted with cement, sandstone, and shale components at reservoir conditions. The geochemical model for the reaction of sandstone and shale with CO2and brine is a simple one in which albite, chlorite, illite and carbonate minerals partially dissolve and
boehmite, smectite, and amorphous silica precipitate. The geochemical model for the wellbore environment is also fairly simple, in which alkaline cements and rock react with CO2-rich brines to form an Fe containing calcite, amorphous silica, smectite and boehmite or amorphous Al(OH)3.
Conclusions:Our research shows that relatively simple geochemical models can describe the dominant reactions that are likely to occur when CO2is stored in deep saline aquifers sealed with overlying shale cap rocks, as well as the dominant reactions for cement carbonation at the wellbore interface.
Background
Carbon dioxide is actively being stored at depth in a sand-stone saline reservoir as part of the In Salah Gas Project in Krechba, Algeria [1]. It is one of few commercial scale CO2storage projects and serves as an important platform
to study the scientific and technical issues for safe and effective long-term CO2storage in deep saline reservoirs
[2-11].
Wellbores are a potential risk pathway for leakage of
CO2 from the storage reservoir to overlying drinking
water aquifers and back into the atmosphere. Carbonation of cements, used in wellbores to seal off fluid flow from the reservoir, can bring about changes in permeability and alter the movement of fluids within the wellbore environ-ment. Field, experimental and modeling studies suggest that carbonation of hydrated cements lowers porosity and has the potential to heal fractures within the cement [12-18].
Risk of leakage from a CO2storage reservoir would be
significantly reduced if the CO2could be stored as a solid
carbonate mineral and if these reactions improved the seal within the cap rock above the reservoir. Field and laboratory experiments have shown mineral dissolution in CO2-rich brines leads to increased concentrations of
Ca, Fe, and Mg and, in some cases, to the formation of
carbonate minerals [19-24]. The amount of CO2 stored
as carbonate minerals over geologic times estimated from reactive transport simulations varies substantially and
depends on the reaction rates and the amount of CO2
injected into the subsurface [25-30]. The possibility of even small amounts of carbonate mineralization in shale cap rock may significantly improve seal integrity by redu-cing porosity. Simulation results suggest seal integrity is enhanced due to carbonate mineral precipitation after 100 years of reaction with CO2-rich fluids [31]. Another
modeling study predicts that redistribution of calcite within 0.1 m of the cap rock - reservoir interface effec-tively seals reservoir from the overlying strata [32].
The focus of this work was to determine the key geo-chemical reactions involving common cements used in
* Correspondence: carroll6@llnl.gov
Lawrence Livermore National Laboratory, 7000 East Avenue, Livermore CA 94550, USA
wellbore construction, formation mineralogy, and super-critical CO2 stored at the Krechba site. We reacted the
end member components of the heterolithic sandstone and shale unit that forms the upper section of the carbon storage reservoir with supercritical CO2and representative
brine with and without cement at 95°C and 10 MPa in gold bag autoclaves. Separate cement experiments without
CO2 were conducted to measure cement hydration at
temperature prior to the injection of CO2. The
experimen-tal results can be used to develop geochemical models for estimating long-term trapping of CO2, and wellbore and
cap rock integrity at the Krechba site.
Methods Materials
The heterolithic sandstone and shale in units C10.2 and C10.3 form the upper section of the carbon storage reser-voir at the Krechba Field, In Salah, Algeria. Reported mineralogy among 17 core samples collected from Krechba reservoir ranged from a quartz-dominated sand-stone to a shale-like material containing abundant illite clay [33]. Iron-rich chlorite appears as coatings on quartz grains in the sandstone and in abundances as high as 30 percent by volume in the shale. Other aluminosilicates include minor quantities (e.g., typically less than 5 percent) of kaolinite and feldspar. Carbonate phases have been described as siderite [33], ankerite plus dolomite (unpub-lished mineralogical analyses conducted by Statoil), or cal-cite (unpublished XRD analyses of Krechba core samples). The shale end member, Sample 14, consisted of 44% illite, 30% chlorite, 20% quartz, 4% kaolinite, 2% feldspar and trace amounts of pyrite by weight. The sandstone end member, Sample 7, consisted of 88% quartz, 6% chlorite, 4% kaolinite and 2% siderite by weight. Limited availability of the heterolithic sandstone and shale necessitated the use of rock fragments in the experiments rather than a well-defined powdered size fraction.
The powdered class G oil well cement used in the experiments was provided by Mountain Cement Company and consists of 56% Ca3SiO5, 39% Ca2SiO4, 5% Ca3AlO4.5,
+ 0.5% Na2O and K2O by weight as determined by
stan-dardASTM C 150. In some experiments small amounts of bentonite were added to the cement to reflect mixtures identified in well logs from the Krechba site (bentonite to cement ratio = 1:39 by weight). Any curing of the cement occurred in the reaction vessels at the experimental condi-tions. Combination of powdered cement and rock frag-ments did not compromise the results because the primary objective of the experiments was to determine the dominant geochemical reactions controlling the solution composition.
Initial solutions were distilled and deionized water, 0.13 m CaCl2, and synthetic Krecha brine consisting of
1.8 molal NaCl, 0.55 molal CalCl2, and 0.1 molal MgCl2.
All salts used to synthesize the brines were reagent grade. The experiments were conducted in a synthetic brine to capture the major ion chemistry measured at the site. A more complex reservoir brine was not used to avoid masking relevant geochemical reactions. High
purity liquid CO2 was pressurized at temperature and
pressure to generate supercritical CO2 for the
experiments.
Cement Hydration Experiments
Distilled and deionized, 0.13 m CaCl2, and synthetic
Krechba solutions were used to determine ion activity pro-ducts for cement hydration at different solid:solution ratios at 115 and 95°C (Table 1). Solutions and solids were reacted in teflon-lined Parr reaction vessels, sealed, and placed into an oven to maintain temperature. Sealed reac-tion vessels were quenched in cold water prior to taking filtered aqueous samples for chemical analyses. Solids were washed with distilled and deionized water and dried at 60°C prior to analysis by an environmental scanning
Table 1 Cement Hydration Experiments
ID Solid Solution Solid:Soln (g/g) T °C Days pH(c,25)
G3 A 0.13 m CaCl2 1:10 115 43 11.9
G6 A Brine 1:10 115 43 not measured
G7 B MQ water 1:10 115 58 12.2
G8 B MQ water 1:10 115 87 12.3
G9 B MQ water 2:10 115 58 12.3
G10 B MQ water 2:10 115 87 12.1
G11 B MQ water 1:10 95 74 12.3
G12 B MQ water 2:10 95 43 12.3
G13 B MQ water 2:10 95 74 12.1
G14 B Brine 1:10 95 88 11.4
G15 B Brine 2:10 95 88 12.3
electron microscopy with energy dispersive x-ray spectro-scopy (ESEM/EDX) and powder x-ray diffraction (XRD).
Cement - Rock - Brine - CO2 Experiments
Static Dickson-type Au reactors housed in water-filled pressure vessels were used to react cement, sandstone, shale, synthetic brine and supercritical CO2at 95°C and
10 MPa. Specific weights of cement, sandstone, shale, and brine are listed in Table 2. Coherent sandstone or shale rock fragments were used in the experiments due to limited availability from core. We monitored reaction kinetics and the approach to equilibrium by sampling the solution as a function of time. The reactor setup allows sequential sampling of the aqueous phase while the experiment is at pressure and temperature. All metals measured in solution were from the rock-fluid interac-tions, because the supercritical CO2and the brine
con-tact only gold or passivated titanium. After one month of reaction, supercritical CO2was injected into the gold bag
and reacted for an additional month. About 20 grams of
supercritical CO2 were added to the reaction vessel to
ensure excess CO2during the reaction. To add the CO2,
liquid CO2was pressurized above the run pressure and
injected into the reaction vessel through the sample tube. The liquid CO2transitions to supercritical CO2 at the
run pressure and temperature. The amount of CO2
injected was estimated from change in volume of the
liquid CO2. Several brine samples were taken and
ana-lyzed for solution chemistry over the duration of the experiment. At the end of the experiment, the reaction
vessel was cooled to room temperature, excess CO2was
removed, and solid reactants were rinsed with distilled and deionized water several times to remove brine. The solids were dried at 60°C prior to XRD and ESEM/EDX analysis. Samples for dissolved Al, Ca, Fe, Mg, and Si ana-lyses were filtered, and directly diluted with acidified dis-tilled and deionized water (using high purity HNO3).
Samples for total dissolved inorganic carbon were
injected directly into 1 N NaOH to trap the CO2,
fil-tered to remove any solids that precipitated, and ana-lyzed for dissolved inorganic carbon, calcium, and magnesium. Total dissolved carbon should be equal to the measured inorganic carbon in the filtered sample
plus the amount of carbon trapped as calcite minerals in the NaOH extraction. Comparison of results from the NaOH extraction with estimates from Duan and Sun (2003) caused us to question the viability of using the extraction technique to quantify dissolved carbon in the experiments. Although the median value of the dissolved carbon concentrations estimated from the extraction technique (0.78 molal) agrees with the theoretical pre-diction (0.69 molal), there is a significant amount of scatter in the extracted values over time (ranging from 1.12 to 0.53 molal). The scatter largely correlates to changes in measured dissolved calcium, because calcium
is predicted to be trapped as CaCO3 solid rather than
some mixture of CaCO3 + Ca(OH)2 solids (any Mg is
predicted to be trapped as Mg(OH)2 and was not
con-sidered in the NaOH extraction method). We have cho-sen to use the theoretical dissolved CO2 concentrations
in the development of the geochemical model because of the uncertainty associated with the NaOH extraction chemistry. However, we report both the extraction and theoretical values, because caustic extractions are com-monly used to quantify total dissolved CO2.
Analysis
Major and trace metals in the aqueous samples and the stock solution were analyzed using inductively coupled plasma mass spectroscopy (ICP-MS, Make/Model: Thermo Electron Corp/X Series Q-ICPMS). Samples were prepared volumetrically using an internal standard solution in 2% nitric acid. A fully quantitative analysis using a linear calibration curve based on known stan-dards was performed. The internal standard was cor-rected for instrument drift and suppression from the sodium chloride matrix. Silica was run in collision cell technology (CCT) mode to avoid polyatomic interfer-ences. Detection levels were established from duplicate blanks and serial dilution preparations. Matrix spike sam-ples were analyzed for quality control. Detection limits were about 3, 0.2, 0.5, 4, and 0.35 ng/g for Ca, Mg, Al, Si, and Fe, respectively.
Total inorganic carbon (TIC) concentrations are determined using an automated OI Analytical Aurora 1030W Carbon Analyzer. The Aurora 1030W uses a
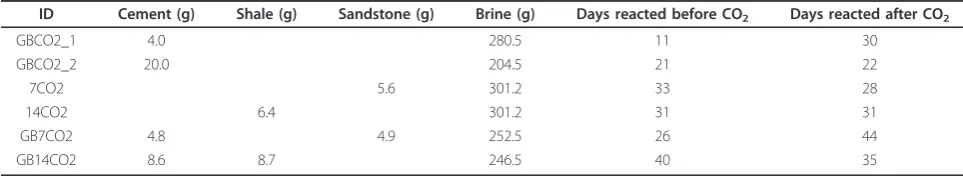
Table 2 Cement-Rock-Brine-CO2Experiments
ID Cement (g) Shale (g) Sandstone (g) Brine (g) Days reacted before CO2 Days reacted after CO2
GBCO2_1 4.0 280.5 11 30
GBCO2_2 20.0 204.5 21 22
7CO2 5.6 301.2 33 28
14CO2 6.4 301.2 31 31
GB7CO2 4.8 4.9 252.5 26 44
GB14CO2 8.6 8.7 246.5 40 35
syringe pump to transfer samples and reagents to a tem-perature-controlled reaction chamber. TIC samples are
reacted with 5% phosphoric acid to evolve CO2 gas
purged by a stream of N2 gas and quantified using a
NDIR detector.
Solid mineralogy was determined from data collected from random orientation powder samples with a Scintag
PAD V instrument using a Cu-Ka source at 45 kV and
35 mA from 5° to 70° 2Θin 0.02° steps. XRD cannot
detect amorphous solids or minerals that are present at less than 2 wt%.
Unreacted and reacted samples were analyzed using a Quanta 200 Environmental Scanning Electron Microscope in low vacuum mode with EDX. Images were collected with secondary and backscatter detectors from pressures ranging from 0.23 to 0.90 torr and 20-25 kV. EDX was use to determine the local chemical composition of materials using at 20kV and 11 mm working distance. All analyses are semi-quantitative.
Geochemical Modeling
Solution compositions from the batch experiments were modeled using the PHREEQC 2.15.0 geochemical code [34], and the SUPCRT92 thermodynamic database [35] augmented by CEMDATA07v2 [36]. The CEMDATA provides Gibbs free energies, heat capacity, and volume data for cement phases as a function of temperature and pressure [37,38]. The standard state for minerals and pure water is unit activity, and for all aqueous species other than dissolved CO2 is unit activity in a hypothetical 1
molal solution referenced to infinite dilution at any
pres-sure and temperature. The dissolved CO2concentrations
were calculated assuming equilibrium withfCO2estimated
from CO2 equation of state at 10 MPa [39]. No other
mass balance reactions were corrected for pressure. This introduces an error of about ± 0.1 log K. pH was estimated from the forward model simulations. The B-dot ion inter-action model was used to approximate the non-ideal beha-vior of solutions at elevated ionic strength and temperature. The B-dot equation is an extended form of the Debye-Huckel equation and was used in this study because it can be applied to NaCl based solutions with high ionic strengths (3 molal) over a wide range of tem-perature. However, it is generally recognized that the B-dot equation becomes increasing less accurate at I > 0.5 molal. Despite these limitations, we chose to use B-dot equation to correction for species activity because the Pit-zer equations are lacking for many elements at tempera-tures above 25°C. The use of the B-dot equation typically yields brines with slightly higher solution pH (≈0.1 pH units). The thermodynamic and kinetic inputs to the geo-chemical model for reaction of cement, sandstone and shale with CO2-rich Na-Ca-Mg chloride brines are shown
in Tables 3, 4, 5, 6, and 7.
All sandstone and shale reactions are assumed to be kinetically controlled and are modeled using
r=±kA(1− LAP Ksp
) (1)
whereris the dissolution or precipitation rate per unit time per unit area,kis the kinetic rate constant,Ais the mineral surface area,IAPis the ion activity product, and
Kspthe solubility constant. Surface area is adjusted to fit
the solution composition (Table 4). All of reactive sur-face area was assumed to be available for reaction for the sandstone experiments, whereas only 10 percent of the shale reactive surface area was assumed to partici-pate in reactions. The rate constant for Fe(OH)3
precipi-tation in the sandstone experiments was fitted to the solution composition and is normalized the mineral moles (Table 7). All other rate constants are from Palandri and Kharaka [40] (Table 6):
k=knu
25exp −Enu a R 1 T− 1 298.15 +kH
25exp −EH a R 1 T− 1 298.15
{H+}n (2)
whereRis the universal gas constant, T the absolute
temperature, {H+} the activity of the hydrogen ion, nan exponential factor, andk25nu andk25H the neutral and
acid rate constants at 25°C andEanuand EaHthe neutral
and acid activation energies, respectively.
Table 3 Mineral weight percents used in geochemical simulations
Phase Sandstone Shale
Albite 1.5% 2%
Chlorite 6% 30%
Dolomite 0.5% 0.75%
Illite 1.5% 44%
Kaolinite 4% 4%
Quartz 86% 20%
Siderite 1.5% 0.75%
(Ankerite was modeled as a 25 - 75 siderite-dolomite mixture for sandstone and a 50 - 50 siderite-dolomite mixture for the shale.)
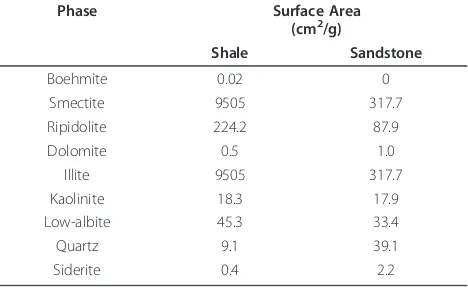
Table 4 Surface areas used in the modeling calculations
Phase Surface Area (cm2/g)
Shale Sandstone
Boehmite 0.02 0
Smectite 9505 317.7
Ripidolite 224.2 87.9
Dolomite 0.5 1.0
Illite 9505 317.7
Kaolinite 18.3 17.9
Low-albite 45.3 33.4
Quartz 9.1 39.1
A few additional constraints to the geochemical model were needed to match Al, Fe, and Si solution chemistry and involve the precipitation of secondary phases. We added dissolved O2to account for the attenuation of the
initial spike in Fe in the sandstone experiment as second-ary precipitation of Fe(OH)3. Quartz precipitation is
sup-pressed and dissolved Si concentrations are limited by chalcedony equilibrium with no kinetic controls. Smec-tite precipitation is tied to illite surface area and is
modeled as Ca-beidellite, Ca0.165Al2.33Si3.67O10(OH)2.
Boehmite, AlO(OH), precipitation is suppressed until the solution is slightly supersaturated (log SI = 1). Uptake of Fe(II) during cement carbonation is modeled as an ideal
continuous FeCO3 - CaCO3 solid solution. No other
solid solutions are included in this model. We model cement carbonation from an assemblage of portlandite, psuedowollastonite, brucite, hydrotalcite, Fe-hydrogarnet, and anhydrite estimated from the hydration of initial
Table 5 Geochemical model for reaction of cement, sandstone and shale with CO2and Na, Ca, Mg chloride brines
Cement Hydration
Phase Mass Balance Log K 95°C Log SI 95°C
Portlandite Ca(OH)2+ 2H+⇔Ca2++ 2H2O 18.30 0.04 ± 0.04
Psuedowollastonite CaSiO3+ 2H+⇔SiO2+ Ca2++ H2O 10.97 0.3 ± 1.3
Brucite Mg(OH)2+ 2H+⇔Mg2++ 2H2O 12.65 0.7 ± 0.1
1Hydrotalcite Mg
4Al2O7(OH)2:10H2O + 14H+⇔2Al3++ 4Mg2++ 17H2O 53.67 2.8 ± 0.2 1
Fe-Hydrogarnet Ca3Fe2(OH)12+ 12H +
⇔3Ca2++ 2Fe3++ 12H2O 68.50 -3.4 ± 2.7
Anhydrite CaSO4⇔Ca
2+
+ SO4
2--5.08 -0.3 ± 0.1
Cement, Sandstone, and Shale Carbonation
Phase Mass Balance Log K 95°C
Albite NaAlSi3O8+ 4H
+
⇔Al3++ Na++ 2H2O + 3SiO2 0.46 1
Amorphous Al(OH)3 Al(OH)3+3H
+
⇔Al3++ 3H2O 5.42
1
Amorphous Fe(OH)3 Fe(OH)3+3H+⇔Fe3++ 3H2O 2.86
Boehmite AlO(OH) + 3H+⇔Al3++ 2H2O 3.75
Calcite CaCO3+ H+⇔Ca2++ HCO3- 0.85
Chalcedony SiO2⇔SiO2,aq -2.88
Dolomite CaMg(CO3)2+ 2H+⇔Ca2++ Mg2++ 2HCO3- 1.41
Ripedolite 14Å Mg3Fe2Al2Si3O10(OH)8+16 H+⇔2Al3++ 3SiO2,aq+ 3Mg2++ 2Fe2++ 12H2O 41.45
Illite K0.6Mg0.25Al2.3Si3.5O10(OH)2+ 8H+⇔0.25Mg2++ 0.6K++ 2.3Al3++ 3.5SiO2+ 5H2O 2.56
Kaolinite Al2Si2O5(OH)4+ 6 H+⇔2 Al3++ 2 SiO2+ 5 H2O 1.35
Magnesite MgCO3+ H+⇔Mg2++ HCO3- 0.71
Quartz SiO2⇔SiO2,aq -3.10
Siderite FeCO3+ H
+
⇔Fe2++ HCO3
--1.40 Smectite
(Ca-Beidellite)
Ca0.165Al2.33Si3.67O10(OH)2+ 7.32H +
⇔+ 0.165Ca2++ 2.33Al3++ 4.66H2O + 3.67SiO2 -0.62
Unless otherwise noted the values are estimated from SUPCRT92 [35];1
values from CEMDATA [36].
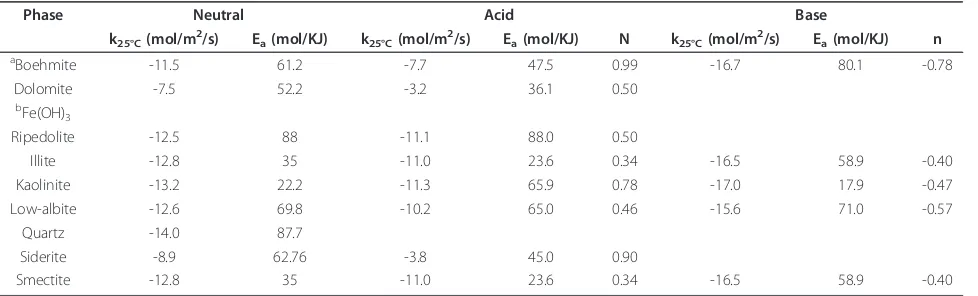
Table 6 Rate parameters from Palandri and Kharaka [40]
Phase Neutral Acid Base
k25°C(mol/m2/s) Ea(mol/KJ) k25°C(mol/m2/s) Ea(mol/KJ) N k25°C(mol/m2/s) Ea(mol/KJ) n
aBoehmite -11.5 61.2 -7.7 47.5 0.99 -16.7 80.1 -0.78
Dolomite -7.5 52.2 -3.2 36.1 0.50
bFe(OH) 3
Ripedolite -12.5 88 -11.1 88.0 0.50
Illite -12.8 35 -11.0 23.6 0.34 -16.5 58.9 -0.40
Kaolinite -13.2 22.2 -11.3 65.9 0.78 -17.0 17.9 -0.47
Low-albite -12.6 69.8 -10.2 65.0 0.46 -15.6 71.0 -0.57
Quartz -14.0 87.7
Siderite -8.9 62.76 -3.8 45.0 0.90
Smectite -12.8 35 -11.0 23.6 0.34 -16.5 58.9 -0.40
a
Gibbsite dissolution rates were applied for boehmite.b
anhydrous cement composition using the experimental cement to brine ratios (Table 2). We use pseudowollasto-nite to represent the amorphous hydrated calcium silicate (“CSH”) because its solubility is consistent with our experimental measurements. Brucite and hydrotalcite were needed to account for the observed removal of Mg from the brine during cement hydration and its enhanced solubility during carbonation, even though these phases were not identified in the XRD pattern. Attempts to model the poorly crystalline phase as Mg-Ca silica hydrate introduced excessive amounts of dissolved silica. Anhydrite accounts for the sulfate noted in the anhy-drous components.
Carbonation of the hydrated mineral assemblage was
modeled with calcite, amorphous SiO2 (as chalcedony),
Fe(OH) 3, and boehmite for cement: brine < 1:50 or
amorphous Al(OH)3 for cement: brine > 1:25 (Table 2).
Fitted rate constants for the cement phases reflect the
varied extent of cement hydration and carbonation in each experiment and are normalized to mineral moles (Table 7). It is important to note that the fitted reaction rates are conditional to these experiments and likely represent diffusion of the reactants into the cement, which had a tendency to solidify at the bottom of the reaction vessel even though the experiments were rocked.
Model Uncertainty
It is important to note that the lithology and cement geo-chemical models represent possible realizations of the dominant geochemical reactions. The non-uniqueness of the lithology model reflects the wide range of minerals that can be used to describe major element chemistry and was made apparent in our efforts to fit the dissolved Si prior to the injection of CO2in the sandstone
experi-ment. The best matches required either using unrealisti-cally high illite in the sandstone (higher than in the shale) or alternatively excessive high quartz surface areas (which were also higher than in the shale). Presumably, some combination of aluminosilicate dissolution and enhanced quartz dissolution (in the sandstone) is responsible for
the Si accumulation prior to CO2injection.
Composi-tional variations among carbonates, chlorite, and illite could not be considered owing to a lack of thermody-namic data. Additionally, phases such as boehmite or Fe (OH)3represent idealizations of aluminum- or ferric
oxy-hydroxides that may, in reality, may be characterized by different stoichiometries or crystal structure than those phases represented in the thermodynamic database.
A significant number of factors contribute to the uncertainty in the cement carbonation geochemical model. Mineralogy, including the pertinent stoichiometry and equilibrium constants, of the hydrated cement is poorly constrained by the experimental data. Moreover, the mineralogical sink for magnesium is unconstrained and may or may not be associated with the CSH phase. Solid solutions may be important for a number of phases in the hydrated cement and carbonated mineral datasets as well as in the reservoir lithology. We employ either pure phase or ideal solid solution because data to con-strain non-ideal solid solutions are lacking.
Experimental Results
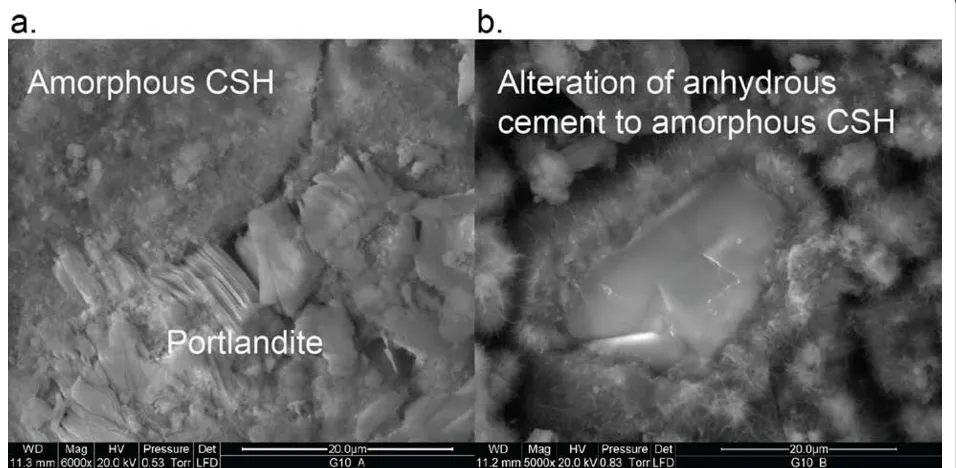
Cement Hydration at 95 and 115°C
Cement hydration with reservoir brines altered both the brine chemistry and the hydrated cement phases in experiments at 95 and 115°C (Table 8). Our results show that when Class G cement reacts with distilled water or 0.13 molal CaCl2brine, the water composition is largely
controlled by the solubility of portlandite and an amor-phous calcium silica hydrate (CSH). Portlandite was iden-tified as the only crystalline phase by XRD. ESEM analysis also showed crystalline portlandite, as well as an
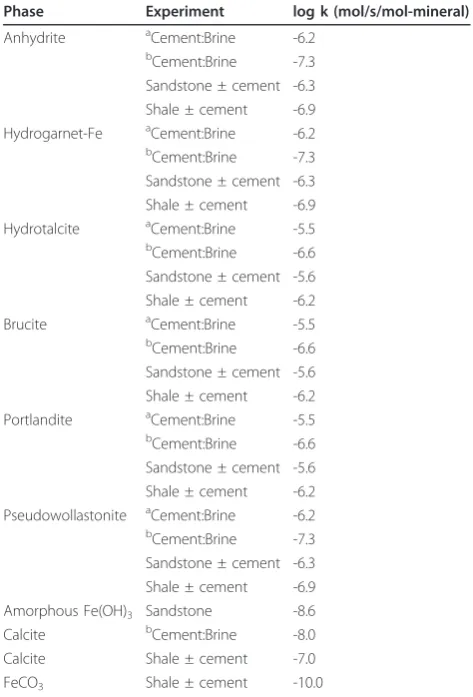
Table 7 Conditional rate constants for the cement phases estimated from fits of the solution composition and anhydrous cement composition for each experiment
Phase Experiment log k (mol/s/mol-mineral)
Anhydrite aCement:Brine -6.2 bCement:Brine -7.3
Sandstone ± cement -6.3 Shale ± cement -6.9 Hydrogarnet-Fe aCement:Brine -6.2
b
Cement:Brine -7.3 Sandstone ± cement -6.3 Shale ± cement -6.9 Hydrotalcite aCement:Brine -5.5
b
Cement:Brine -6.6 Sandstone ± cement -5.6 Shale ± cement -6.2 Brucite aCement:Brine -5.5 bCement:Brine -6.6
Sandstone ± cement -5.6 Shale ± cement -6.2 Portlandite aCement:Brine -5.5 bCement:Brine -6.6
Sandstone ± cement -5.6 Shale ± cement -6.2 Pseudowollastonite aCement:Brine -6.2
b
Cement:Brine -7.3 Sandstone ± cement -6.3 Shale ± cement -6.9 Amorphous Fe(OH)3 Sandstone -8.6
Calcite bCement:Brine -8.0 Calcite Shale ± cement -7.0 FeCO3 Shale ± cement -10.0
The range in values reflects incomplete hydration and diffusion-controlled transport.a
Cement:Brine refers to experiment GBCO2_1 andb
amorphous calcium silicate, which we assume to be CSH (Figure 1).
The storage reservoir brine is likely to be distinct from the dilute waters used to mix the cement prior to injec-tion in the well. The experiments in synthetic brine show that mineral assemblage at the cement - brine interface will be different than in the interior of the cement. The primary difference is that Mg has a very low solubility when the brine reacts with the anhydrous cement. Cement hydration produced a less alkaline and
Mg-poor brine (Mg = 10-5molal). Although the solution
was supersaturated with respect to brucite, Mg(OH)2,
the resulting Mg-bearing phase was poorly crystalline and could not be identified by XRD.
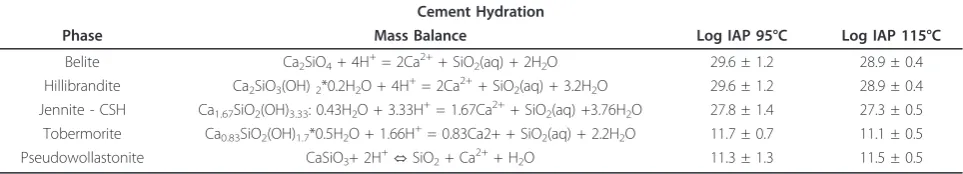
There is a large amount of uncertainty associated with the identification of stable or metastable cement miner-als in the wellbore environment, because cements can range in composition and are often amorphous. Possible
cement phases include anhydrous belite (Ca2SiO4)
which was present as a residual reactant in most of the experiments, and CSH phases such as hillebrandite (Ca2SiO3(OH)2*0.17H2O), jennite (Ca1.67SiO2(OH)3.33:
0.43H2O), and tobermorite-CSH (Ca0.83SiO2(OH)
1.7*0.5H2O). Average ion activity products calculated
from the solution chemistry at 95 and 115°C are listed in Table 9. It is likely that cements will alter to crystal-line phases with time, because the transformation from amorphous to stable phases has been observed at 150°C
Table 8 Measured solution composition for cement hydration and the experiment end
ID Al molal
Ca molal
Fe molal
Mg molal
Si molal
F -molal
Cl -molal
NO3
-molal
SO4
2-molal
G3 1.39E-05 0.109 3.68E-07 ND 1.73E-05
G6 1.91E-05 4.68E-01 9.64E-07 1.34E-05 4.87E-06
G7 1.70E-05 7.83E-03 1.07E-07 ND 8.53E-06 5.86E-05 1.73E-05 2.38E-05 1.81E-03 G8 1.89E-05 6.62E-03 2.21E-07 ND 3.99E-05 6.01E-05 1.66E-04 2.21E-05 1.77E-03 G9 3.30E-05 4.42E-03 6.30E-08 ND 9.89E-06 8.06E-05 1.54E-05 2.91E-05 3.64E-03 G10 2.76E-05 6.01E-03 7.99E-08 ND 3.44E-05 1.21E-04 2.30E-05 2.60E-05 3.85E-03 G11 2.05E-05 7.82E-03 7.30E-08 ND 3.30E-05 5.51E-05 2.42E-05 2.43E-05 2.33E-03 G12 4.22E-05 5.74E-03 6.89E-08 ND 8.56E-06 7.06E-05 1.93E-05 2.59E-05 4.10E-03 G13 3.12E-05 5.90E-03 7.43E-08 ND 5.31E-05 6.96E-05 3.89E-05 2.77E-05 4.85E-03 G14 3.05E-06 5.88E-01 1.46E-06 5.41E-06 1.89E-07 2.97
G15 3.35E-06 5.82E-01 1.38E-06 5.95E-06 2.05E-07 3.00
Blank values indicate that the ions were not measured. ND indicates concentrations were below detection.
Figure 1ESEM images of Class G cement reacted in 0.13 molal CaCl2solution showing crystalline portlandite, residual anhydrous
for tobermorite [41]. Given the amorphous nature of CSH in our experiments, we have chosen to model it as
psuedowollastonite (CaSiO3) because measured solution
compositions are near psuedowollastonite equilibrium (Table 5).
Cement - Rock - Brine - CO2 Experiments
In this section we describe the experimental results from
the reaction of supercritical CO2 and synthetic brine
with reservoir rock, cap rock, and wellbore cement. The sandstone and shale used in the experiments are meant to represent storage reservoir and the cap rock respec-tively (although the materials themselves are from the heterolithic sandstone and shale unit that forms the upper section of the carbon storage reservoir at the Krechba Field, In Salah, Algeria). Interpretation of the rate and solubility controlling reactions will be discussed in Geochemical Model.
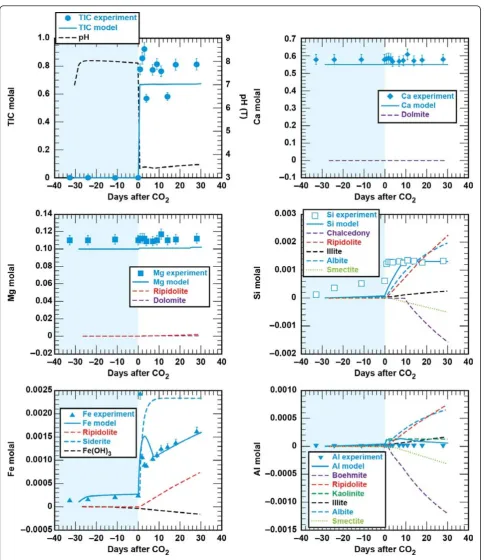
Sandstone - brine - CO2
The sandstone consists of tightly carbonate-cemented quartz grains with about 7 wt % chlorite lining the pores [33]. Figures 2 and 3 show the solution profiles with time and images of the unreacted and reacted sandstone. Reaction of sandstone with brine produced a fairly neutral solution with low dissolved CO2, dissolved
Ca and Mg near the initial brine concentrations, dis-solved Si and Fe that increased slowly with time, and very low dissolved Al. Injection of supercritical CO2 into
the reaction vessel resulted in marked increases in dis-solved CO2, Si, and Fe. Dissolved CO2 and Si increase
rapidly to a constant concentration. Dissolved Fe peaked
upon injection of CO2, dropped to a minimum value
and then increased linearly with time. No abrupt changes were observed in dissolved Ca, Mg, or Al.
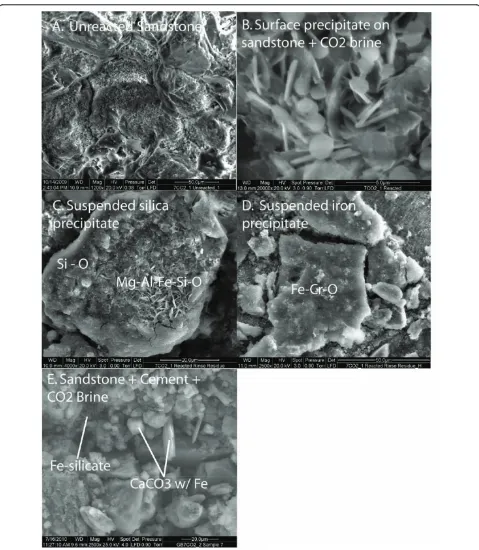
Secondary precipitates were either amorphous to XRD or present in amounts below the XRD detection limit for crystalline phases to be identified. ESEM images show relatively large amounts of silica and iron precipi-tates as well as thin hexagonal sheet silicates (Figure 3). It is not possible to identify the composition with EDX because the beam samples an area larger than the sur-face precipitates. It is also possible that the precipitates formed as the solution was cooled prior to taking apart the reaction vessel and recovering the solids for analysis.
Shale - brine - CO2
Figures 4 and 5 show the solution profiles with time and images of the unreacted and reacted shale. Similar to the sandstone experiment, reaction of shale with brine produced a fairly neutral solution with low dissolved CO2, dissolved Ca and Mg near the initial brine
compo-sition, dissolved Si that increased slowly, and very low dissolved Fe and Al. Injection of supercritical CO2 into
the reaction vessel produced a marked increase in dis-solved CO2, Si, Fe, and Al, with no change in the
dis-solved Ca and Mg.
We see very little indication of alteration of the shale
by CO2-rich brines at the experiment end by ESEM/
EDX analysis (Figure 5). We detect only small precipi-tates on the shale surface and in the suspension, which may have formed when the sample was quenched from 95°C to room temperature. Particle size was too small to confirm the chemical composition with EDX.
Cement - brine - CO2
Cement altered to aragonite, calcite, and amorphous silica by the CO2-rich brines. XRD analyses show
arago-nite, calcite, and residual anhydrous Ca2SiO3. We
assume that Si from the CSH phase was altered to amorphous silica. Figures 6 and 7 show the change in solution composition for the reaction of cement, brine,
and supercritical CO2 at 95°C and 10 MPa as solution
pH (95°C), total dissolved CO2, Ca, Mg, Si, Fe, and Al.
These experiments had solid to brine ratios of 1:68 and 1:10 on g/g basis. Trends in dissolved Ca and Mg sug-gest that starting materials may not have been fully hydrated prior to the injection of CO2. Extrapolation of
the linear decrease in Mg to values measured in the solubility experiments, suggest that the cements would fully equilibrate with the brine within 20 days of reac-tion at 95°C. The lack of complete hydrareac-tion is of little consequence because the cement system is very reactive
in brines with supercritical CO2. Upon injection of
supercritical CO2, there was a marked increase in
dis-solved CO2, dissolved Ca decreased, dissolved Mg
increased toward their initial brine concentration, dis-solved Si increased to a constant value, and disdis-solved Fe and Al were quite low.
Experiments with higher amounts of cement resulted in solidification of cement at the bottom of the reactor.
Table 9 Calculated ion activity products (IAP) for select CSH phases
Cement Hydration
Phase Mass Balance Log IAP 95°C Log IAP 115°C
Belite Ca2SiO4+ 4H+= 2Ca2++ SiO2(aq) + 2H2O 29.6 ± 1.2 28.9 ± 0.4
Hillibrandite Ca2SiO3(OH)2*0.2H2O + 4H+= 2Ca2++ SiO2(aq) + 3.2H2O 29.6 ± 1.2 28.9 ± 0.4
Jennite - CSH Ca1.67SiO2(OH)3.33: 0.43H2O + 3.33H+= 1.67Ca2++ SiO2(aq) +3.76H2O 27.8 ± 1.4 27.3 ± 0.5
Tobermorite Ca0.83SiO2(OH)1.7*0.5H2O + 1.66H+= 0.83Ca2+ + SiO2(aq) + 2.2H2O 11.7 ± 0.7 11.1 ± 0.5
Pseudowollastonite CaSiO3+ 2H +
⇔SiO2+ Ca 2+
We suspect that dissolution was ultimately limited by diffusion at the cement-solution interface. Less than
40% of the cement reacted with CO2-rich brine based
on the dissolved Mg. We estimate the extent of the
cement carbonation reaction from the recovery of Mg in solution, because the brines are undersaturated with
respect to magnesite (MgCO3) and there is no
indica-tion of Mg in the carbonate precipitates. Another
Figure 3ESEM images of reacted sandstone.(A) Unreacted sandstone consisted of quartz, carbonate cement, and chlorite which lines the pore spaces. Reaction of sandstone with CO2-rich brine produced (B) aluminum hydroxide or aluminosilicate reaction products deposited on the
sandstone surface and (C-D) coagulated Si-rich and Fe-rich precipitates in the brine. Reaction of the sandstone with cement and CO2-rich brine
difference between this experiment and the one at lower cement: brine was that the dissolved Ca increased with time.
Cement - sandstone - brine - CO2
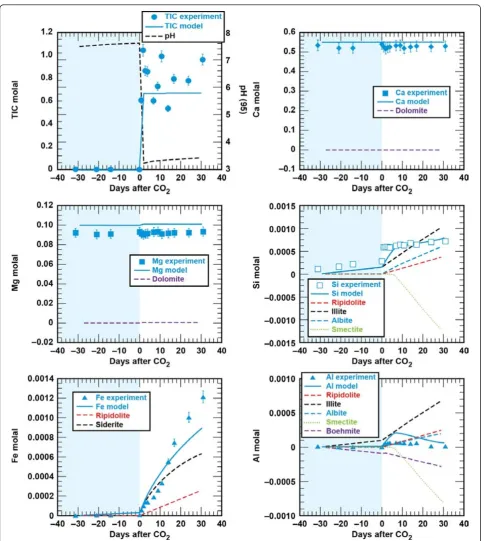
Comparison of the solution chemistry profiles from the cement and cement - sandstone experiments suggest that
cement carbonation will drive reaction chemistry in the wellbore environment where the cement contacts sand-stone geology (Figures 2 and 8). In the first phase of the experiment, cement hydration produced alkaline solu-tions with elevated Ca and depleted Mg. The cement mineral assemblage underwent rapid carbonation when
supercritical CO2was injected into the brine. Dissolved
CO2increased by several orders of magnitude to values
between 0.6 and 0.8 molal, dissolved Ca decreased, dis-solved Mg increased to the initial brine concentration, dissolved Si also increased to a constant value, and dis-solved Al was quite low.
Despite the dominance for the cement carbonation reactions, there is a chemical signature from the
sand-stone. Upon injection of the CO2, the dissolved Fe
increased by 3 orders of magnitude to a peak concentra-tion, and then decreased over time to a constant value. This is in sharp contrast to the continued increase in
dis-solved Fe when sandstone was reacted with CO2-rich
brines in the absence of cement. Qualitative EDX ana-lyses show some Fe in rhombahedral and bladed shaped
calcium carbonate alteration products (Figure 3). Fe was also detected in the thin bladed micron-sized silicates that are either residual chlorite or a secondary smectite or iron hydroxide. Cr is also detected in these micron-sized crystals.
Cement - shale - brine - CO2
Similar to cement - sandstone - CO2 experiment, the
cement carbonation chemistry drives the dominant alteration products when shale is reacted with cement
and CO2-rich brines (Figure 9). Cement hydration in
this experiment was analogous to the other experiments, producing an alkaline solution with elevated Ca and depleted Mg. Reaction of supercritical CO2, brine, shale
and cement yielded Mg, Si, and Fe profiles that are dif-ferent from their respective profiles in the cement and
Figure 5ESEM images of reacted shale.(A) Unreacted shale consisted of fine-grained quartz, illite, and carbonate. When the shale was reacted with CO2-rich brine (B) submicron reaction products deposited on the shale surface and in solution. When the shale reacted with
cement - sandstone experiments. About 80% of the Mg removed from the brine during the cement hydration phase of the experiment was recovered in the solution at the experiment end suggesting that 80% of the bulk cement was carbonated. Dissolved Si increased to a level
below that observed for experiments with cement and cement - sandstone. Dissolved Fe approached a value similar to the final concentrations measured in the cement - sandstone experiments, and dissolved Al was quite low.
SEM images show that sheet silicates were altered when the shale reacts with the cement and CO2-rich brines
(Fig-ure 5). Extensive dissolution groves formed along the edges of the sheet silicates and fibrous precipitates formed on the planar surfaces of the sheet silicates, in addition to calcium carbonate precipitation from cement carbonation.
Geochemical Model
Geochemical modeling was used to identify a plausibleset
of reactionsconsistent from (1) the reported mineralogy from the Krechba reservoir, (2) the changes in brine chem-istry observed during each of the experiments, and (3) the alteration products identified at the end of the
experiments. Our objective in creating the geochemical model was to preserve key attributes, such as mineral composition and dissolution rates, across all experiments to better constrain conceptual models for the assessment
of long-term CO2trapping mechanisms and wellbore and
cap rock integrity using reactive-transport simulations. It is important to note that the geochemical model repre-sents one realization that describes six experiments. Details of the modeling approach and related uncertainties can be found in Modeling Uncertainty.
Sandstone Reservoir and Shale Cap Rock Geochemical Model
The geochemical model for the reaction of sandstone and shale with CO2and brine is a simple one, in which chlorite,
illite, albite, quartz and carbonate minerals partially dissolve
and boehmite, smectite, Fe(OH)3and amorphous silica
precipitate (Table 5). The same geochemical model is used to describe both the storage reservoir and the cap rock, because the mineralogy is the same for both rock types, although the relative proportion of the minerals differs.
Comparison of the measured and simulated data shows that this simple model adequately describes the
experiments (Figures 2 and 4). In both experiments dolomite dissolution predicts dissolved Ca and Mg to within 5% of the experimental values. Upon injection of
CO2 into the sandstone experiment dissolved Si from
albite, chlorite, and lesser amounts of illite dissolution is offset by silica precipitation once chalcedony saturation is exceeded and some smectite precipitation. In the sandstone experiment small amounts of illite limit the amount of smectite precipitation, which is tied to the illite surface area. However, in the shale experiment, where there is significantly more illite (44%) than in the sandstone experiment (1.5%), smectite precipitation effectively limits the dissolved Si to concentrations
below chalcedony saturation. Pre-CO2 and the abrupt
changes in dissolved Si, possibly from the dissolution of fines that occurred when CO2was first injected into the
sandstone experiment, are not captured in the model fits. Both siderite and chlorite dissolution contribute to the dissolved Fe concentrations in both experiments. The sharp decrease in dissolved Fe in the sandstone
experiment can be modeled as Fe(OH)3 precipitation
and the depletion of dissolved oxygen present in the stock solutions that were prepared at atmospheric con-ditions. Any dissolved oxygen appears to have been quickly consumed in the shale experiment as no con-centration peaks were observed. The low dissolved alu-minum concentrations are a product of secondary precipitation of boehmite, kaolinite, and smectite.
Wellbore Geochemical Model
We derive the wellbore geochemical model by combining the lithologic model with cement hydration and carbona-tion models described below. Carbonacarbona-tion of the hydrated cement assemblage was modeled with a set of carbonate minerals, amorphous SiO2(as chalcedony), Fe(OH)3, and
boehmite or amorphous Al(OH)3 (dependent on the
cement: brine; Table 5, Figures 6 and 7). Comparison of the measured and simulated data shows that this simple model adequately describes the data and captures the effects of reacting varying amounts of cement with the CO2-rich brine. At low solid to brine ratios (1:68 g/g),
cal-cite precipitation results in a decrease in dissolved Ca, bru-cite and hydrotalbru-cite dissolution result in the recovery of dissolved Mg to initial values, and SiO2, Fe(OH)3and
boehmite precipitation limit the amount of dissolved Si, Fe, and Al as CSH, Fe-hydrogarnet and hydrotalcite dis-solved during the carbonation process. At higher solid to brine ratios (1:10 g/g), where roughly 60% more cement reacted with brine (based on percent recovery of dissolved Mg and the initial amount of cement), the model captures the increase in dissolved Ca with cement carbonation and higher dissolved Al concentrations when amorphous Al (OH)3 is used to control Al solubility. Recall, that rates
used here are conditional to the experiments and scale with dissolved Mg recovery.
The combination of the lithology - brine - CO2and
cement carbonation models reproduces brine chemistry evolution observed during the carbonation phases of the composite experiments (Figures 8 and 9). As might be expected, cement carbonation dominates the geochem-ical reactions in the wellbore environment, largely because cement reactivity masks contributions from the much less reactive sandstone and shale minerals. Dis-solved Ca can be accounted for by the carbonation of portlandite and CSH. Dissolved Mg can be accounted for by dissolution of brucite and hydrotalcite (where the extent of cement carbonation is fit to the proportion of Mg recovered). Although chalcedony precipitation accounts the bulk of Si during carbonation, the higher inputs of Si and Ca result in smectite precipitation in both the cement - sandstone and cement - shale experi-ments. This model result agrees with the appreciable amount of smectite observed in the cement - shale experiment. One added parameter specific to the
lithol-ogy - cement - brine - CO2 experiments was the
intro-duction of a ferroan calcite solid solution, which limited the dissolved Fe from chlorite dissolution in the sand-stone and shale experiments.
Conclusions
Our research shows that relatively simple geochemical models can describe the dominant reactions that will occur when CO2is stored in deep saline aquifers sealed
with overlying shale cap rocks, and when CO2 reacts at
the interface between cement and reservoir and shale cap rock. Although the experiments and modeling reported here are specific to the CO2storage at the Krechba site,
the model may be applicable to other storage sites with similar geology. Development of these relatively simple
geochemical models is needed to assess long-term CO2
trapping mechanisms, cap rock and wellbore integrity in more computationally intensive reactive-transport simu-lations that couple chemistry, flow, and possibly geome-chanics. As is expected, Al/Fe silicate dissolution drives the geochemical alterations within the reservoir and cap rock pore space. Addition of CO2lowers the pH and
pro-motes silicate dissolution and amorphous silica, smectite and boehmite precipitation. The dissolved Fe may be a
source of long-term mineral trapping of CO2 and the
precipitation of secondary Fe-carbonates, clays and hydroxides could alter reservoir and seal permeability by clogging pores and fracture networks. In agreement with other studies we find that alkaline cements are highly
reactive in the presence of CO2-rich brines and are
the transformation of portlandite, and Ca- and Mg-silicates to aragonite or calcite and amorphous silica. Finally, we find that dissolved Mg common in deep saline brines will react with the wellbore cement to form poorly-crystalline solids. Additional research is required to assess mineral structure of the Mg-rich cement phase, as it could not be identified in this study and to assess what the impact of the Mg - induced alteration may have on wellbore integrity.
Acknowledgements
This document was prepared as an account of work sponsored by an agency of the United States government. Neither the United States government nor Lawrence Livermore National Security, LLC, nor any of their employees makes any warranty, expressed or implied, or assumes any legal liability or responsibility for the accuracy, completeness, or usefulness of any information, apparatus, product, or process disclosed, or represents that its use would not infringe privately owned rights. Reference herein to any specific commercial product, process, or service by trade name, trademark, manufacturer, or otherwise does not necessarily constitute or imply its endorsement, recommendation, or favoring by the United States government or Lawrence Livermore National Security, LLC. The views and opinions of authors expressed herein do not necessarily state or reflect those of the United States government or Lawrence Livermore National Security, LLC, and shall not be used for advertising or product endorsement purposes.
This work performed under the auspices of the U.S. Department of Energy by Lawrence Livermore National Laboratory under Contract DE-AC52-07NA27344.
We thank three anonymous reviewers for their comments which significantly improved the manuscript. We acknowledge funding from and data provided by the Joint Industry Project (a consortium of BP, Statoil and Sonatrach) and the U.S. Department of Energy to investigate the importance of
geochemical alteration at the In Salah CO2storage project. We also thank
Bill Ralph for his contributions to experiments early in the project and Mike Singleton and Pihong Zhao for chemical analyses, and Phil Ringrose for interest in geochemistry.
Authors’contributions
SAC is the primary author. She designed and directed the experiments, WWM modeled the experiments, and SCT conducted the experiments. All authors have read and approved the final manuscript.
Competing interests
The authors declare that they have no competing interests.
Received: 1 March 2011 Accepted: 11 November 2011 Published: 11 November 2011
References
1. In Salah Gas Stockage de CO2.[http://www.insalahco2.com].
2. Oldenburg CM, Jordan PD, Nicot J-P, Mazzoldi A, Gupta AK, Bryant SL:
Leakage risk assessment of the In Salah CO2storage project: Applying the certification framework in a dynamic context.Energy Procedia2011,
4:4154-4161.
3. Dodds K, Watson M, Wright I:Evaluation of risk assessment
methodologies using the In Salah CO2stroage project as a case history.
Energy Procedia2011,4:4161-4169.
4. Iding M, Ringrose P:Evaluating the impact of fractures on the performance of the In Salah CO2storage site.I J Greenhouse Gas Control
2010,4:242-248.
5. Rutqvist J, Vasco DW, Myer L:Coupled reservoir-geomechanical analysis of CO2injection and ground deformations at In Salah, Algeria.I J
Greenhouse Gas Control2010,4:225-230.
6. Michael K, Globab A, Shulakova V, Ennis-King J, Allinson G, Sharma S, Aiken T:Geological storage of CO2in saline aquifers - A review of the
experience from existing storage operations.I J Greenhouse Gas Control 2010,4:659-667.
7. Vasco DW, Ferretti A, Novali F:Reservoir monitoring and characterization using satellite geodetic data: interferometric synthetic aperture radar observations from the Krechba field Algeria.Geophysics2008,73: WA113-WA122.
8. Vasco DW, Ferretti A, Novali F, Bissel F, Ringrose P, Mathieson A, Wright I:
Satellite-based measurements of surface deformation reveal fluid flow associated with the geological storage of carbon dioxide.Geophysical Research Letters2010,37:L03303.
9. Morse JP, Hao Y, Foxall W, McNab W:A study of injection-induced mechanical deformation at the In Salah CO2storage project.I J
Greenhouse Gas Control2011,5:270-280.
10. Mathieson A, Wright IW, Roberts D, Ringrose P:Satellite imaging to monitor CO2movement at Krechba, Algeria.Energy Procedia2009, 1:2201-2209.
11. Onuma T, Ohkaws S:Detection of surface deformation related with CO2 injection by DInSAR at In Salah, Algeria.Energy Procedia2009,
1:2177-2184.
12. Kutchko BG, Strazisar BR, Dzombak DA, Lowry GV, Thaulow N:Degradation of well cement by CO2under geologic sequestration conditions.
Environmental Science and Technology2007,41:4787-4792. 13. Barlet-Gouedard V, Rimmele G, Porcherie O, Quisel N, Desroches J:A
solution against well cement degradation under CO2geological storage environment.I J Greenhouse Gas Control2009,3:206-216.
14. Carey JW, Wigand M, Chipera SJ, WoldeGabriel G, Pawar R, Lichtner PC, Wehner SC, Raines MA, Guthrie GD:Analysis and performance of oil well cement with 30 years of CO2exposure from the SACROC Unit, West Texas, USA.I J Greenhouse Gas Control2007,1:75-85.
15. Crow W, Williams B, Carey JW, Celia M, Gasda S:Wellbore integrity of a natural CO2producer.Energy Procedia2009,1:3561-3569.
16. Duguid A:An estimate of the time to degrade the cement sheath in a well exposed to carbonated brine.Energy Procedia2009,1:3181-3188. 17. Wigand M, Kazuba JP, Carey JW, Hollis WK:Geochemical effects of CO2
sequestration on fractured wellbore cement at the cement cap rock interface.Chemical Geology2009,265:122-133.
18. Huet BM, Prevost JH, Scherer GW:Quantitative reactive transport modeling of Portland cement in CO2-saturated water.I J Greenhouse Gas
Control2010,4:561-574.
19. Emberley S, Hutcheon I, Shevalier M, Durocher K, Mayer B, Gunter WD, Perkins EH:Monitoring of fluid-rock interaction and CO2storage through produced fluid sampling at the Weyburn CO2-injection enhanced oil recovery site, Saskatchewan, Canada.Appl Geochem2005,20:1131-1157. 20. Kaszuba JP, Janecky DR, Snow MG:Carbon dioxide reaction processes in a
model brine aquifer at 200°C and 200 bars: implications for geologic sequestration of carbon.Appl Geochem2003,18:1065-1080.
21. Janecky DR, Snow MG:Experimental evaluation of mixed fluid reactions between supercritical carbon dioxide and NaCl brine: relevance to the integrity of a geologic carbon repository.Chemical Geology2005,
217:277-293.
22. Palandri JL, Rosenbauer RJ, Kharaka YK:Ferric iron in sediments as a novel CO2mineral trap: CO2-SO2reaction with hematite.Appl Geochem2005, 20:2038-2048.
23. Kharaka YK, Hovorka SD, Gunter WD, Knauss KG, Freifeld BM: Gas-water-rock interactions in Frio Formation following CO2injection: Implications for the storage of greenhouse gases in sedimentary basin.Geology2006,
34:577-580.
24. Lu P, Fu Q, Seyfried WE Jr, Hereford A, Zhu C:Navajo Sandstone-brine-CO2 interaction: implications for geologic carbon sequestration.Environ Earth Sci2011,62:101-118.
25. Xu T, Apps JA, Pruess K:Reactive geochemical transport simulation to study mineral trapping for CO2disposal in deep arenaceous formations.
J Geophysical Research-Solid Earth2003,108:2071.
26. Xu T, Kharaka YK, Daughty C, Freifeld BM, Daley TM:Reactive transport modeling to study changes in water chemistry induced by CO2injection at the Frio-I Brine Pilot.Chemical Geology2010,271:153-164.
28. White SP, Allis RG, Moore J, Chidsey T, Morgan C, Gwynn W, Adams M:
Simulation of reactive transport of injected CO2on the Colorado Plateau, Utah, USA.Chemical Geology2005,217:387-405. 29. Zerai B, Saylor BZ, Matisoff G:Computer simulation of CO2trapped
through mineral precipitation in the Rose Run Sandstone, Ohio.Appl Geochem2006,21:223-240.
30. Lui F, Lu P, Zhu C, Xiao Y:Coupled reactive flow and transport modeling of CO2sequestration in the Mt. Simon sandstone formation, Midwest U. S.A.Intern J Greenhouse Gas Control5:294-307.
31. Gherardi F, Xu T, Pruess P:Numerical modeling of limiting and self-enhancing cap rock alteration induced by CO2storage in a depleted gas reservoir.Chemcial Geology2007,244:103-129.
32. Guas I, Azaroual M, Czernichowski-Lauriol I:Reactive transport modeling of the impact of CO2injection on the clayey rock at Sleipner (North Sea).
Chemical Geology2005,217:319-337.
33. Armitage PJ, Worden RH, Faulkner DR, Aplin AC, Butcher AR, Iliffe J:
Diagenetic and sedimentary controls on porosity in Lower Carboniferous fine-grained lithologies, Krechba field, Algeria: A petrological study of a cap rock to a carbon capture site.Marine and Petroleum Geology2010,
27:1395-1410.
34. Parkhurst DL, Appelo CAJ:User’s Guide to PHREEQC (Version 2) - A Computer Program for Speciation, Batch-reaction, One-dimensional Transport, and Inverse Geochemical Calculations.U.S. Geological Survey Water-Resources Investigations Report 99-42591999, 312.
35. Johnson JW, Oelkers EH, Helgeson HC:SUPCRT92: A software package for calculating the standard molal thermodynamic properties of minerals, gases, aqueous species, and reactions from 1 to 5000 bar and 0 to 1000°C.Computers and Geoscience1992,18:899-947.
36. CEMDATA Thermodynamic data for hydrated solids in Portland cement system (CaO-Al2O3-SiO2-CaSO4-CaCO3-Fe2O3-MgO-H2O).[http://www.
empa.ch/cemdata].
37. Matschei T, Lothenbach B, Glasser FP:The AFM phase in Portland cement.
Cement and Concrete Research2007,37:118-130.
38. Lothenbach B, Matschei T, Möschner G, Glasser FP:Thermodynamic modeling of the effect of temperature on the hydration and porosity of Portland cement.Cement and Concrete Research2008,38:1-81.
39. Duan ZH, Sun R:An improved model calculating CO2solubility in pure water and aqueous NaCl solutions from 273 to 533 K and from 0 to 2000 bar.Chemical Geology2003,193:257-271.
40. Palanrdi JL, Kahraka YK:A complication of rate parameters of water-mineral interactions kinetics for application to geochemical modeling.
USGS Open File Report 2004-1068.
41. Houston J, Maxwell RS, Carroll S:Transformation of meta-stable calcium silicate hydrates to tobermorite: reaction kinetics and molecular structure from XRD and NMR spectroscopy.Geochemical Transactions 2009,10:1.
doi:10.1186/1467-4866-12-9
Cite this article as:Carrollet al.:Experimental Study of Cement
-Sandstone/Shale - Brine - CO2Interactions.Geochemical Transactions2011
12:9.
Submit your next manuscript to BioMed Central and take full advantage of:
• Convenient online submission
• Thorough peer review
• No space constraints or color figure charges
• Immediate publication on acceptance
• Inclusion in PubMed, CAS, Scopus and Google Scholar
• Research which is freely available for redistribution