R E S E A R C H A R T I C L E
Open Access
Certainty and safe consequence responses
provide additional information from
multiple choice question assessments
M.J. Tweed
1*, S. Stein
2, T.J. Wilkinson
3, G. Purdie
4and J. Smith
5Abstract
Background:Clinicians making decisions require the ability to self-monitor and evaluate their certainty of being correct while being mindful of the potential consequences of alternative actions. For clinical students, this ability could be inferred from their responses to multiple-choice questions (MCQ) by recording their certainty in correctness and avoidance of options that are potentially unsafe.
Methods:Response certainty was assessed for fifth year medical students (n= 330) during a summative MCQ examination by having students indicate their certainty in each response they gave on the exam. Incorrect responses were classified as to their inherent level of safeness by an expert panel (response consequence). Analyses compared response certainty, response consequence across student performance groupings.
Results:As students’certainty in responses increased, the odds they answered correctly increased and the odds of giving unsafe answers decreased. However, from some ability groups the odds of an incorrect response being unsafe increased with high certainty.
Conclusions:Certainty in, and safeness of, MCQ responses can provide additional information to the traditional measure of a number correct. In this sample, even students below standard demonstrated appropriate certainty. However, apart from those scoring lowest, student’s incorrect responses were more likely to be unsafe when they expressed high certainty. These findings suggest that measures of certainty and consequence are somewhat independent of the number of correct responses to MCQs and could provide useful extra information particularly for those close to the pass-fail threshold.
Keywords:Assessment, Certainty, Consequence, Multiple choice question, Safety
Background
A clinician may consider alternative diagnoses and/or treatments for a patient. The clinician will weigh up the need to seek further information based on self-assessed ability and on the potential benefits and harm to the pa-tient. This weighing up may not lead to the need to check resources if potential benefits are near equivalent and potential for harm minimal. In contrast, if options have potential for harm, and/or the clinician is uncer-tain, that clinician may decide to defer to others or seek
extra information. As such, certainty, safety and know-ledge could be independent but intertwined factors.
Effective self-monitoring, evaluation of performance in the moment, along with regulation and self-assessment are bases of current professional practice [1–7]. Clinicians consider their decisions regarding whether they need to seek assistance, or additional information, in confirming their decisions [8]. Self-monitoring of a clinical decision is manifest by con-sidering, “when to look it up” or “defer to others” and is an example of reflection-in-action of daily practice [1, 6, 7, 9]. Factors influencing these considerations in-clude beliefs about capabilities, consequences and alter-natives [10–12]. In clinical practice, an inappropriate degree of certainty in a decision, or not considering * Correspondence:[email protected]
1Department of Medicine, University of Otago Wellington, PO Box 7343,
Wellington 6242, New Zealand
Full list of author information is available at the end of the article
consequences of a decision, holds potential for adverse outcomes and patient harm [13–15]. There is probably an underestimate of the patient harm that results from a failure to make the correct diagnosis and manage-ment [16]. In hospital practice, 10% of adverse events are contributed to by diagnostic error, with 74 to 96% of these errors including some cognitive factors [17].
Those who are less able have been found also to be less aware of their deficiencies, resulting in an inappro-priately high certainty in their correctness of decisions [18–20] and higher incidence of error [21, 22]. Some previous studies, that linked lower performance scores with lower awareness and with undue certainty, were limited as they used norm-referenced scores to define ability groups [23, 24].
Concern has also been raised about those who have sufficiently good examination performance to score above a pass threshold in assessments but whose incor-rect responses are considered dangerous, possibly dem-onstrating a lack of consideration of consequences of decisions [25–28]. Thus, getting enough correct re-sponses to pass is not offset by noting their incorrect dangerous responses. Making a guess, while not consid-ering the consequences, is not appropriate in clinical practice [29]. Studies raising these concerns are limited in that the results are mostly from retrospective analyses of responses, when the examinees were not informed that this analysis would be undertaken. These limitations are significant because instructions relating to unsafe re-sponses can alter response patterns [30]. Errors of com-mission are worse than an acceptance of no knowledge [31], but if the instruction of the assessment, either ex-plicit or implied, is “guess if you don’t know to increase your score”, the meaning of these apparent errors cannot be evaluated.
Planning this study
This study addresses the question of whether, when assessing healthcare professionals or students, there is potential value in considering their demonstration of certainty in responses to questions related to decision-making situations and avoidance of responses that would be potentially unsafe in practice [32–34].
The development of an assessment system that could include certainty in, and safeness of, responses, has proven possible in the context of a research project [32, 34]. However student response behaviour within a research project is likely to differ from that in a summative assess-ment setting that is consequential to students. This re-search builds on prior work by combining certainty and safety responses in assessment with summative conse-quences and by making comparisons with the concurrent measures of assessment performance, as judged by num-ber of correct responses, including a passing standard.
The nature of the relationship, or lack of it, between the number of assessment items answered correctly, as a sur-rogate for ability, and appropriate certainty and/or conse-quence when incorrect needs exploration in a prospective manner and in summative assessment. This has not been undertaken before and is the focus of this study.
This research set out to address three questions:
1. What is the relationship between response certainty and odds of correctness?
2. What is the relationship between response certainty and the odds of potentially adverse consequence? 3. How do these relationships of certainty with
correctness and consequence vary with ability groupings, derived from the number correct on the assessment?
Method Setting
The Medicine degree course at the University of Otago is a six year course that is divided into four distinct pe-riods. The first is a common health science year. This is followed by years two and three at a single campus. Fol-lowing this, the students undertake years four and five at one of three geographically separate campuses. The final year is a Trainee Intern Year, with students spread across many different healthcare locations, working as mem-bers of healthcare teams.
The fifth year at one of these campuses includes a five-week module in General Medicine and Subspe-cialties (respiratory, cardiology, oncology, nephrology). Six groups of students rotate through this module each year with approximately 14 students per rotation. The module includes clinical education in a variety of con-texts including wards, outpatients, procedure clinics, emergency department and medical assessment unit. In addition there is a tutorial programme to complement the learning in context. Assessment for the module in-cludes a multiple choice question (MCQ) examination, an Observed Structured Clinical Examination, case re-ports, peer review, engagement in a variety learning op-portunities, and observations of professional behaviour.
Participants
Question pool
The MCQ examinations used in this research comprised 20 single best answer multiple-choice questions that in-clude certainty in, and safeness of, responses. Six exami-nations each of 20 questions drawn from a pool of 43 questions were developed. Each question consisted of a clinical scenario and a related query. Each question had 10 possible response choices. The tenth response choice was the same for each question: “I do not know, so would ask someone or seek a reference”.
Question review
A panel of six practising clinicians developed and reviewed the questions focussing on content and correct response. Once finalised, the six clinicians also indicated the degree of safeness of each of the incorrect options. Each incorrect option was independently judged by the clinicians as ‘not unsafe’,‘low unsafe’,‘moderately unsafe’ or ‘highly unsafe’ for a starting year 6 student. This range of options including‘not unsafe’reflects the range that will occur in practice [8]. The median for these four possible category responses from the clinicians was taken as the safeness level. The median was used be-cause this is ordinal data and enabled results to be ar-ranged simply on the scale from ‘not unsafe’ to ‘high unsafe’. If the median was between categories, the more unsafe one was used.
The 43 questions each had 8 incorrect responses, giv-ing a total of 344. All incorrect response were reviewed but not by all panellists, the mean number of reviews per incorrect response was 4.2 (range 2-6). Kappa statis-tic for agreement in these judgments was estimated as 0.29 (using Stata/IC 14.1, StataCorp LP, College Station, TX, USA).
Of the 344 incorrect responses: 135 were deemed‘not unsafe’, 127 were‘low level unsafe’, 68 were ‘moderately unsafe’and 14 were classified as ‘highly unsafe’. Hence, the random chance of students choosing any response was: correct 0.10; ‘not unsafe’ 0.31; ‘low unsafe’ 0.30; ‘moderately unsafe’ 0.16; ‘highly unsafe’ 0.03; and ‘don’t know’0.10.
Judgments by these clinicians were also used to standard-set the questions using the modified Angoff method [35], with each clinician estimating the propor-tions of students with performance at a minimum stand-ard to enter year 6, who would get each question correct.
Question selection
The 20 questions selected for each examination for each module group varied for each group within a year, but each was blueprinted to ensure a similar mix of clinical scenarios and to ensure that the standard of minimum performance to progress to year 6, defined using the modified Angoff method, was 12/20 correct.
Question delivery
The assessment process was explained to the students by a member of the academic staff, at the start of the module. In addition, there was written information and practice questions on the students’learning management system (LMS).
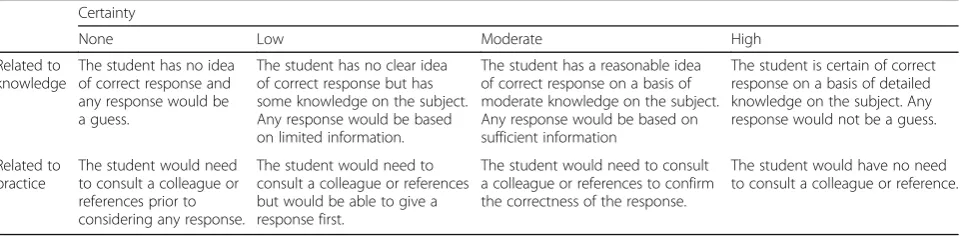
Questions were delivered using the LMS. The front page of the site included a reminder to the students of the descriptors for levels of certainty (Table 1). These descriptors were chosen as they are authentic to reflection-in-action of daily practice [1]. To respond to the questions, the students clicked one check box for their response choice and, unless the “don’t know” re-sponse was selected (corresponding to no certainty), a second check box was provided in which they could in-dicate their level of certainty (low, moderate or high). The time allowed was 40 min to answer 20 questions.
Feedback sent to students was in the form of a matrix, displaying for each question, the question topic, the certainty of their responses and safeness. In addition, there was specific notice drawn to the topics of those questions with responses higher in certainty and unsafeness [32].
Use of assessment results: what the students were told
In addition to providing feedback to the students for their use in future learning, the response pattern was used for a summative purpose to inform pass/fail deci-sions for the module. Information of certainty in, and
Table 1Descriptors of certainty
Certainty
None Low Moderate High
Related to knowledge
The student has no idea of correct response and any response would be a guess.
The student has no clear idea of correct response but has some knowledge on the subject. Any response would be based on limited information.
The student has a reasonable idea of correct response on a basis of moderate knowledge on the subject. Any response would be based on sufficient information
The student is certain of correct response on a basis of detailed knowledge on the subject. Any response would not be a guess.
Related to practice
The student would need to consult a colleague or references prior to considering any response.
The student would need to consult a colleague or references but would be able to give a response first.
The student would need to consult a colleague or references to confirm the correctness of the response.
safeness of, responses was used to make these decisions not based solely on number correct. The students were aware of the pass/fail criteria in advance.
The following constituted a fail:
More than 2/20 highly or moderately unsafe responses that were held with high certainty, irrespective of the number correct.
A score of fewer than 8/20 correct.
The following constituted a pass:
A score of 12/20 or more correct.
The following constituted an excellent pass:
A score more than 15/20 correct, with 3 or more of correct responses held with high certainty would constitute a pass noted as‘excellent’performance.
A score of 8-11/20 could be tolerated, allowing the stu-dent time to improve, unless information from other as-sessments indicated more global substandard performance. These levels of tolerance and classification were de-cided by a consensus discussion by module staff.
Statistical analysis
With regard to general data analysis, internal consistency for correct responses was calculated, irrespective of cer-tainty. From this and the standard deviation of total cor-rect for each student, the standard error of measurement for number correct was calculated [36].
To address the research questions, the following statis-tical analyses were undertaken.
For each research question a mixed model logistic re-gression analysis was used which controlled for module group and student by including those as random terms. To examine the relationship between being correct and response certainty the log of the odds of being correct (vs not) was modelled with terms for level of certainty (as categories). For the relationship between a potentially adverse consequence and response certainty both the log of the odds of any unsafe response (vs not) and the log of the odds of a moderately or highly unsafe response (vs low or not unsafe) were modelled with terms for level of certainty (as categories). The relationships with unsafe responses were examined for all (correct and in-correct) responses and among incorrect responses. The models included random terms for level of certainty and student module group with students as subjects nested in the module groups. To test whether these relation-ships with certainty and consequence vary with score groupings additional models, for each outcome, were
analysed with terms for these score groups (as categor-ies), and their interactions with level of certainty, were added to the models. When interactions were significant, whether there were differences between levels of cer-tainty within each group, and whether differences be-tween levels of certainty were different bebe-tween groups, were tested. Ap-value <0.05 was considered significant.
When there were significant differences among the levels of certainty, comparisons between levels of cer-tainty (three comparisons) were adjusted for multiple comparisons with the Holm–Bonferroni method. When there was a significant interaction, tests for any differ-ences between levels of certainty (four comparisons, one for each score group), comparisons between levels of certainty within each significant score group (three com-parisons), and comparisons of differences between level of certainty between score groups (six comparisons, be-tween pairs of score groups) were also adjusted for mul-tiple comparisons with the Holm–Bonferroni method. When these later tests were significant, differences be-tween levels of certainty (three comparisons) were also adjusted. Each adjustment was made independently. The adjusted criteria for consideringp-values significant were 0.05/(the number of comparisons) for the smallest p -value, 0.05/(the number of comparison –1) for the next smallest, and similarly for others with 0.05/(the number of comparison – the number already considered). Once a p-value was considered not significant, no further p -values were examined.
The glimmix procedure of SAS 9.4 (SAS Institute Inc., Cary, NC, USA) was used, with Laplace’s method and the between-subject and within-subject method for the denominator degrees of freedom.
The scores of 8/20, 12/20 and 16/20, which had been used for decision-making thresholds, having been gener-ated from the Angoff procedure and consensus discus-sion amongst module staff, were used to group the students by performance in the assessment. Score groupings were:
1. low scorers (<8/20 correct)
2. below standard scorers (8-11/20 correct) 3. above standard scorers (12-15/20 correct) 4. excellent scorers (>15/20 correct).
Results General data
the above standard group (SG3), and 18 in the excellent group (SG4).
Of the 6600 question attempts 284 (4.3%) were an-swered don’t know and 3747 (56.8%) were anan-swered cor-rectly. Of the correct responses 807 (21.5%) were low certainty, 1675 (44.7%) moderate certainty and 1265 (33.8%) high certainty. Of the 2569 incorrect responses 1407 (54.8%) were not unsafe, 986 (38.4%) lowly unsafe, 146 (5.7%) moderately unsafe and 30 (1.2%) highly un-safe, and 930 (36.2%) were low certainty, 1192 (46.4%) moderate certainty and 447 (17.4%) high certainty.
There were 4 responses held with high certainty deemed to be highly unsafe, each from a different student, one of whom was in the SG4, two from SG2 and one from SG1, and no student had 3 or more highly or moderately unsafe responses that were held with high certainty.
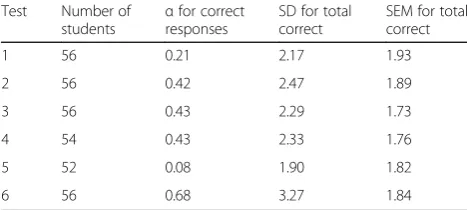
Each test consisted of 20 MCQ questions, with limited internal consistency (α) for correctness, and SEM for total correct between 8 and 10%, as shown in Table 2.
Relationship between levels of certainty and the odds of correctness
Students were more likely to give a correct response with increasing certainty overall and from low to moder-ate and from modermoder-ate to high certainty. The odds ratio (OR) for being correct was: 1.7 (95%CI 1.5–2.0) for moderate vs low certainty; 2.1 (95%CI 1.9–2.5) high vs moderate certainty; and 3.7 (95%CI 3.1–4.3) for high vs low certainty (allp< 0.0001).
The differences among levels of certainty were signifi-cantly different between score groups (interaction of score group and level of certainty F = 3.6 degrees of freedom df = 6570p= 0.002) (Table 3). The differences in odds of being correct among levels of certainty for all score groups were significantly different (p = 0.045 for SG1 and p< 0.0001 for each of the other groups). After adjusting for multiple comparisons, there were no sig-nificant differences between levels of certainty for SG1. There were significant differences between all levels of certainty for the other score groups, except for SG4 be-tween moderate and high certainty (p= 0.39).
After adjusting for multiple comparisons for differ-ences between groups, the ORs for SG2 were signifi-cantly different to SG4 (p = 0.003). Other differences between score groups were not significant, SG1 and SG2, SG3 and SG4 (p= 0.010,p= 0.14 andp= 0.29 re-spectively), SG2 and SG3 (p = 0.14) and SG3 and SG4 (p= 0.018).
Relationship between levels of certainty and the odds of unsafeness among all (correct and incorrect) responses
Students were less likely to give an unsafe response with moderate or high certainty than low certainty. The OR for moderate certainty vs low was 0.71 (95%CI 0.61– 0.83; p < 0.0001), high vs low 0.65 (95%CI 0.55–0.78;
p< 0.0001).
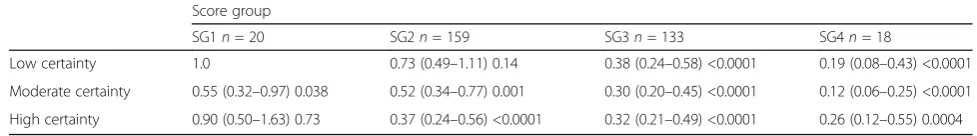
The differences among levels of certainty were signifi-cantly different between score groups (interaction of score group and level of certainty F = 2.7 df = 6570
p = 0.013) (Table 4). There were significant differences in the odds of an unsafe response between levels of cer-tainty for SG2 (p < 0.0001, where all differences were significant), but not the other groups of scorers (SG1
p= 0.095, SG3p= 0.20, SG4p= 0.25).
After adjusting for multiple comparisons, the differ-ences in OR between groups were not significant, SG1 compared to SG2, SG3 and SG4 (p= 0.041,p= 0.37 and
p= 0.75 respectively), SG2 compared to SG3 (p= 0.019) and SG4 (p= 0.039), and SG3 and SG4 (p= 0.33).
Relationship between levels of certainty and the odds of an unsafe response among incorrect responses
When students gave an incorrect response, questions answered with high certainty were more likely to be un-safe than those answered with low certainty (OR 2.2; 95%CI 1.7–2.8; p < 0.0001) or moderate certainty (OR 2.3; 95%CI 1.8–2.8;p< 0.0001).
The differences among levels of certainty were signifi-cantly different between score groups (interaction of score group and level of certainty F = 3.4 df = 6446
p = 0.002) (Table 5). There were significant differences among levels of certainty for SG2 (p = 0.0007), SG3 (p < 0.0001) and SG4 (p = 0.014), but not for SG1 (p= 0.13). For SG2 and SG3 high certainty was signifi-cantly more likely to be associated with an unsafe re-sponse than moderate certainty (OR 1.8; 95%CI 1.3–2.4;
p = 0.0001; OR 3.6; 95%CI 2.4–5.6 p < 0.0001 respect-ively). For SG2, SG3 and SG4 scorers high certainty was significantly more likely to be associated with an unsafe response than low certainty (OR1.5; 95%CI 1.1–2.1;
p = 0.006; OR 4.3; 95%CI 2.8–6.6; p < 0.0001; OR 9.2; 95%CI 2.0–42.0;p= 0.004 respectively).
After adjusting for multiple comparisons, SG2 respond differently in terms of unsafe, with incorrect, with in-creasing certainty compared to SG3 (p = 0.001). SG1 Table 2Measures of internal consistency of correct responses
and variance in total correct across the 6 tests
Test Number of
students α
for correct responses
SD for total correct
SEM for total correct
1 56 0.21 2.17 1.93
2 56 0.42 2.47 1.89
3 56 0.43 2.29 1.73
4 54 0.43 2.33 1.76
5 52 0.08 1.90 1.82
were not significantly different from SG2 (p= 0.76), SG3 (p = 0.027) or SG4 (p = 0.038). SG2 were not signifi-cantly different from SG4 (p = 0.043). SG3 and SG4 were not significantly different (p= 0.35). The ORs of an unsafe response for high versus low certainty were sig-nificantly higher for SG3 than SG2 (p= 0.0002). The OR for high versus moderate certainty for SG3 (OR 3.6) was significantly higher than SG2 (OR 1.8) (p= 0.007).
Relationship between levels of certainty the odds of moderate or highly unsafe responses among all (correct and incorrect) responses
Highly unsafe responses have the potential to be most important with regards to adverse consequences. How-ever, the number of highly unsafe responses chosen was only 30/6600. Therefore to analyse for those unsafe re-sponses that were likely to have the greatest adverse consequences, those deemed moderate and highly unsafe were combined.
Students were less likely to give a moderately or highly unsafe response with increasing certainty. The odds ratio for moderate certainty vs low was 0.53 (95%CI 0.36– 0.77; p = 0.0009), high vs low 0.35 (95%CI 0.23–0.53;
p < 0.0001) and high vs moderate 0.66 (95%CI 0.46– 0.93;p= 0.019).
The differences between levels of certainty were not significantly different between score groups (interaction of score group and level of certainty F = 1.4 df = 6570
p= 0.21) (Table 6).
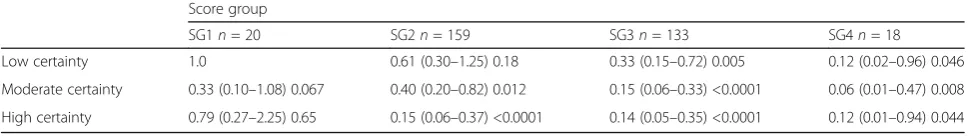
Relationship between levels of certainty the odds of moderate or highly unsafe responses among incorrect responses
When students gave an incorrect response, there was no significant difference in the chance of a moderately or highly unsafe response between levels of certainty
(F = 2.3 df = 2452p= 0.098). The odds ratio for moder-ate certainty vs low was 0.70 (95%CI 0.50–0.98;
p= 0.038), high vs low 0.74 (95%CI 0.47–1.16;p= 0.19) and high vs moderate 1.06 (95%CI 0.67–1.66;p= 0.82).
The differences between levels of certainty were not significantly different between the score groups (inter-action of score group and level of certainty F = 0.8 df = 6446p= 0.54) (Table 7).
Discussion
Within the cohort as a whole and the four performance groups, students had greater odds of correct responses as certainty increased, except for the lowest (SG1) and highest (SG4) score groups where there was no signifi-cant difference between moderate and high certainty. In addition, within the cohort as a whole and the below standard score (SG2) groups, students had lower odds of incorrect and unsafe responses for moderate and high certainty. Such findings are to be expected and are re-assuring for self-monitoring in practice as markers of appropriate certainty and consideration of consequence.
When a student response was incorrect, the odds of such responses being unsafe were higher with high cer-tainty. This was seen in all groups except the lowest per-formers. If this were true in practice, when practitioners happen to be incorrect, if they are also more certain, then they are also more likely to be unsafe, clearly a situ-ation that could compound circumstances towards pa-tient harm. One reassurance was that for those unsafe responses that are more likely to be clinically significant (moderate or highly unsafe), the odds of such responses amongst incorrect responses did not significantly vary with certainty.
The low numbers in SG1 and SG4 do mean that for some analyses the failure to demonstrate a statistically Table 3Odds ratio of a correct response by certainty and score group
Score group
SG1n= 20 SG2n= 159 SG3n= 133 SG4n= 18
Low certainty 1.0 1.6 (1.0–2.4) 0.036 3.4 (2.2–5.3) <0.0001 5.7 (3.1–10.5) <0.0001
Moderate certainty 1.8 (1.1–3.1) 0.032 2.5 (1.6–3.7) <0.0001 5.5 (3.6–8.4) <0.0001 19.9 (10.8–36.6) <0.0001
High certainty 1.9 (1.1–3.5) 0.027 6.3 (4.1–9.8) <0.0001 10.6 (6.8–16.7) <0.0001 14.4 (7.2–29.1) <0.0001
Odds ratio, (95% confidence interval),p-value
Table 4Odds ratio of an unsafe response among all (correct and incorrect) responses by certainty and score group
Score group
SG1n= 20 SG2n= 159 SG3n= 133 SG4n= 18
Low certainty 1.0 0.73 (0.49–1.11) 0.14 0.38 (0.24–0.58) <0.0001 0.19 (0.08–0.43) <0.0001
Moderate certainty 0.55 (0.32–0.97) 0.038 0.52 (0.34–0.77) 0.001 0.30 (0.20–0.45) <0.0001 0.12 (0.06–0.25) <0.0001
High certainty 0.90 (0.50–1.63) 0.73 0.37 (0.24–0.56) <0.0001 0.32 (0.21–0.49) <0.0001 0.26 (0.12–0.55) 0.0004
significant difference may be due to low power. Likewise low numbers of responses may limit the ability to detect statistically significant differences when analysing higher levels of unsafe responses.
Appropriate certainty from below standard scorers
The lower scoring groups (SG1 and SG2) did show evi-dence of accurate self-monitoring. The lowest scoring group (SG1) had increasing odds of being correct be-tween low certainty and moderate certainty and bebe-tween low certainty and high certainty, but there was no sig-nificant difference between moderate and high certainty. The below standard group (SG2) demonstrated increas-ing odds of beincreas-ing correct with increasincreas-ing certainty across all levels of certainty. In part, this confirms some recent literature [7, 37], but is contrary to a body of gen-eral literature [19, 21, 38–42], and healthcare literature [43–45] which finds that those of lesser skill are also less aware of their underperformance. The reasons our re-sults may differ from other literature may relate to the manner in which certainty was assessed. Unlike those with contrary results, the current study used certainty descriptors that refer to seeking assistance; this is more authentic to practice [46]. Other researchers have used probabilistic predictions for certainty, such as estimating a probability that a response is correct [6, 47], a format that may not be appropriate in all contexts [48]. Instead, written descriptors for certainty may be preferable in some situations [49], such as in complex healthcare deci-sions [46]. In other words, clinicians do not commonly ask if they are 30% likely to be correct or not. Instead they ask themselves if they need extra information or help. The wording of certainty descriptors can alter re-sponses and therefore meaning [50]. In the current study, certainty reflects self-assessment of performance
done ‘in the moment’ rather than retrospectively [51], and is reflection-in-action authentic to daily practice [1], recognising the role of external cognitive support [8]. An assessment that addresses reflection-in-action of daily practice could be more important for ensuring safe and effective clinical performance [1]. Other means of assessing question by question self-monitoring have in-cluded a linear confidence scale [6] and flagging ques-tions [7]. Exploring a student’s certainty based on descriptors is preferable to a student’s self-assessment relative to peers or estimating their mark [1].
Incorrect and unsafe with increasing certainty
The higher odds for unsafe responses when incorrect as certainty increased is consistent with our prior research findings using a similar format but in a non-summative assessment setting [30]. Replicating aspects of previous findings in different student groups increases the gener-alisability of the results. Previously, others reported that the number of unsafe responses is proportional to the numbers of incorrect responses, and therefore this add-itional metric adds nothing [25, 27]. However, all previ-ous investigations have been retrospective, where the candidates were not given any scoring disincentive for responding unsafely [25–27].
Why might some students (SG2, SG3 and SG4) have a greater proportion of incorrect responses that are unsafe when they are highly certain? There are several possible explanations, which are not mutually exclusive.
First, the students have only experienced number cor-rect scoring with feedback that related to corcor-rectness or not, rather than to safety [30]. Feedback that is verifica-tion without elaboraverifica-tion is less useful in guiding learning [52]. Could it be that simply scoring on the number Table 5Odds ratio of an unsafe response among incorrect responses by certainty and score group
Score group
SG1n= 20 SG2n= 159 SG3n= 133 SG4n= 18
Low certainty 1.0 0.9 (0.6–1.4) 0.62 0.7 (0.4–1.1) 0.12 0.4 (0.2–1.1) 0.083
Moderate certainty 0.7 (0.4–1.3) 0.22 0.8 (0.5–1.2) 0.26 0.8 (0.5–1.3) 0.34 1.2 (0.5–3.28) 0.70
High certainty 1.4 (0.7–2.8) 0.35 1.4 (0.8–2.3) 0.21 2.9 (1.6–5.1) 0.0003 4.0 (1.0–15.6) 0.043
Odds ratio, (95% confidence interval),p-value
Table 6Odds ratio of a moderately or highly (clinically significant) unsafe response among all (correct and incorrect) responses by certainty and score group
Score group
SG1n= 20 SG2n= 159 SG3n= 133 SG4n= 18
Low certainty 1.0 0.61 (0.30–1.25) 0.18 0.33 (0.15–0.72) 0.005 0.12 (0.02–0.96) 0.046
Moderate certainty 0.33 (0.10–1.08) 0.067 0.40 (0.20–0.82) 0.012 0.15 (0.06–0.33) <0.0001 0.06 (0.01–0.47) 0.008
High certainty 0.79 (0.27–2.25) 0.65 0.15 (0.06–0.37) <0.0001 0.14 (0.05–0.35) <0.0001 0.12 (0.01–0.94) 0.044
correct, which these students had experienced, encour-ages a “guess when unsure” strategy, despite this being inappropriate in clinical practice [29]? The students’ typ-ical assessment behaviour could therefore be towards giving responses that have a chance of being correct be-cause safety of incorrect responses has never been raised as an issue.
Second, students whose ability levels are close to thresh-old (e.g. pass and excellent) may be aware of this and sub-sequently would be more likely to take risks to increase their scores, and within these increasing responses there are increasing unsafe responses. This might lead to in-creasing unsafe responses with higher certainty.
Third, it is possible that knowing what to do is learnt before knowing what not to do. Knowing what not to do can be termed negative knowledge [53], and in the current study, this would be awareness of responses to avoid because of unsafeness. In the path from novice to expert, negative knowledge is gained by experience, rather than from standard learning resources, such as textbooks. The development of negative knowledge, selecting choices that are less likely to lead to a negative outcome may contribute to the increasing certainty of experts. However, those who are not yet experts, may not have had sufficient experience to develop negative knowledge with appropriate certainty. These learners still choose unsafe responses with higher certainty.
Fourth, it has been shown that for some people, as performance and certainty increase, they are more likely to take risks [54]. Although this has not been shown for those in healthcare clinical practice or students specifically, if this was a contributory factor, this would be a significant finding with regard to train-ing and thus requires further exploration. Increastrain-ing ability may make some errors more likely, but the in-crease in ability is also associated with better error de-tection and correction [8]. In other words, ability and self-awareness may not increase in parallel – if a stu-dent’s improvement in self-awareness lagged behind their improvement in ability, then they could go through a stage of increased ability and low self-awareness before reaching a stage of increased ability and appropriate self-awareness, akin to “a little know-ledge is a dangerous thing”.
Lastly, some doctors, and therefore possibly those who are in training, will have a level of certainty in their ap-plied practice that is greater than supported by their ability. This may be due to doctors not disclosing, and therefore ignoring, uncertainty, so perceived certainty is increased [55]. There are many heuristics and biases in clinical practice that normally function to aid clinical practice, appropriately increasing certainty, but these can at times lead to incorrect decisions being made with undue certainty [56].
The fact that responses with the greatest potential for adverse consequence (moderately and highly unsafe) were not different across groups and levels of certainty could be seen as reassuring, but may reflect the low numbers of such responses with higher certainty.
High certainty in highly unsafe responses
There were only four responses that were deemed incor-rect and highly unsafe held with high certainty, one each from four students. These are rare events and if they oc-curred in practice would be important to recognise [8], but may have been due to keyboard error, rather than cognitive or metacognitive error. The problem of reliably assessing for rare events, such as unsafe responses, has been raised [27], and it remains an important issue. It is possible that multiple pieces of information gathered over a more prolonged time, or a failure of a student’s decision-making behaviours to change even in the light of feedback, might add to more robust information.
Use of certainty safety responses
No person or system is perfect. Deviations from optimal acceptable practice will occur, but only some lead to ad-verse outcomes and patient harm [8, 16]. This can range from no clinically significant consequence to fatality [57]. Systems and staff training are in place to minimise the frequency and consequences of decisions that are de-viations from optimal acceptable practice [8, 58]. Zero tolerance of deviations from optimal acceptable practice, adverse outcomes and patient harm is overly optimistic, but reducing the degree of harm from adverse events is highly desirable [8, 16, 59]. Therefore, tolerance of devia-tions will vary dependant on the context and what other safeguards in place [60]. Even if no clinically significant Table 7Odds ratio of a moderately or highly (clinically significant) unsafe responseamong incorrect responsesby certainty and score group
Scorer group
SG1n= 20 SG2n= 159 SG3n= 133 SG4n= 18
Low certainty 1.0 0.71 (0.34–1.47) 0.36 0.56 (0.25–1.23) 0.15 0.27 (0.03–2.26) 0.23
Moderate certainty 0.39 (0.12–1.32) 0.13 0.56 (0.27–1.16) 0.12 0.32 (0.14–0.74) 0.008 0.37 (0.04–3.08) 0.36
High certainty 1.01 (0.34–2.98) 0.99 0.38 (0.16–0.92) 0.032 0.52 (0.20–1.33) 0.17 0.57 (0.07–4.86) 0.61
adverse event or patient harm occurs these should not be ignored but can be considered as learning opportun-ities [8, 58]. Therefore, when using the certainty in and safety of responses in assessment of medical students, rules regarding tolerance are required. For this assess-ment, these were developed by consensus amongst staff.
We have shown that considering certainty in and un-safeness of responses can add to the information gained about medical students. Specifically, such a scoring scheme may raise awareness amongst the students of de-cision making certainty and consequence in clinical practice. It will also reinforce seeking external support rather than guessing as appropriate practice.
The information gained regarding student ability adds to that obtained just from numbers of correct responses. Therefore, this information can be included in summa-tive decision making with a level of tolerance for devia-tions from optimal acceptable practice [8]. A student may score above the pass threshold for number correct and yet still be deemed not to have passed if they dis-played higher certainty in responses with higher unsafe-ness. If a student is close to the decision point, additional information may be needed as to whether they are safe to continue learning to improve.
The data gained from these question types could be used to provide higher quality feedback to students by including elements of metacognition, such as gauging ap-propriate levels of certainty, and safeness [52]. In the as-sessment described in this study, the feedback in terms of certainty and safety was presented specific to the question. In this way, by using these descriptors, and safety, the con-text specific nature of certainty was recognised [1, 9].
Limitations
The number of questions in the test was limited, given it was covering all the various aspects of the module [61]. This led to the relatively low measures of internal consistency and high standard errors of measurement. If these are to be considered as a stand-alone test with high-stakes decisions an increase in question numbers will be required.
The low scoring (SG1) and excellent groups (SG4) had relatively small numbers of students which may limit the ability to detect statistically significant differences within and between these groups and resulted in wide confidence intervals for these comparisons. However, the below standard (SG2) and above standard group (SG3) were of larger sizes meaning that effects present in one of these and not the other is unlikely to be due to sampling.
Another limitation of the study relates to whether these measures truly reflect the degree of certainty or consideration of consequence for the students. There is no comparison with other measures or other
assess-ments. Although the assessment did have some
summative consequences, it cannot be extrapolated that this would reflect current or future practice.
Are the unsafe responses truly unsafe? Basing the safety classification on clinical outcome data from au-thentic practice would be ideal, such data are unlikely to be available for all the distractors [62]. However, we are reassured in that safeness was classified by the judge-ments of a review panel, a method consistent with previ-ous research defining dangerprevi-ous responses from the majority decision of a reviewing panel [26, 27]. However, this method showed kappa for these judgments was only fair. Although a weighted kappa may have been higher, for higher stakes assessment a larger number of re-viewers, perhaps augmented by discourse, for each in-correct response would be required.
Future directions
Although this research produced information on the co-hort as a whole and groups within the coco-hort, detailed information about the responses of individuals and the rationale for these was not identified. The question for-mat used in the assessment may lead to the identifica-tion of those with risk-taking response patterns. As such, correlation with other assessment results and, if possible, assessment of practice, would provide support-ive evidence for this identification. This study was undertaken with a single assessment with a small num-ber of questions covering limited content, so repeat as-sessments with more questions covering broader content would add to these findings. Repeat assessments would also highlight any changes in response patterns resulting from feedback, which might highlight a group of higher risk responders whose patterns do not change with feedback.
Conclusions
1. Groups of students, classified by performance, demonstrate differing degrees of appropriate certainty and consideration of consequence. These metrics may be independent.
2. Even students with the below standard scores demonstrate increasing correctness with increasing certainty.
3. Potentially unsafe responses occur at all degrees of certainty for students in all performance groupings. Apart from those scoring lowest, students had incorrect responses that were more likely unsafe when they had high certainty.
Acknowledgements
No additional acknowledgements.
Funding
There was no external funding for this research.
Availability of data and materials
As the dataset is the responses for students used in a summative assessment with relatively small subgroups of students, we do not intend to make the dataset publically available.
Authors’contributions
MT undertook initial inception and design, acquisition of data, analysis and interpretation of data; wrote the first draft and redrafts and has given final approval of the version to be published. SS advised on inception and design, interpretation of data; reviewed and improved drafts and has given final approval of the version to be published. TW advised on inception and design, acquisition of data, analysis and interpretation of data; reviewed and improved drafts and has given final approval of the version to be published. GP advised on statistical analysis interpretation of data; reviewed and improved redrafts and has given final approval of the version to be published. JS advised on initial inception and design, acquisition of data, analysis and interpretation of data; reviewed and improved drafts and has given final approval of the version to be published.
Ethics approval and consent to participate
Ethical approval was granted for the conduct of the study by University of Otago Human Ethics Committee. Consent was not required.
Consent for publication
Not applicable.
Competing interest
The authors declare that they have no competing interests.
Publisher’s Note
Springer Nature remains neutral with regard to jurisdictional claims in published maps and institutional affiliations.
Author details
1
Department of Medicine, University of Otago Wellington, PO Box 7343, Wellington 6242, New Zealand.2Distance Learning, University of Otago, Dunedin, New Zealand.3Medical Education Unit, University of Otago Christchurch, Christchurch, New Zealand.4Deans Department, University of Otago Wellington, Wellington, New Zealand.5College of Education, University of Otago, Dunedin, New Zealand.
Received: 30 September 2015 Accepted: 19 June 2017
References
1. Eva KW, Regehr G. Self-assessment in the health professions: a reformulation and research agenda. Acad Med. 2005;80(10):46.
2. Eva KW. Regehr G:“I'll never play professional football”and other fallacies of self-assessment. J Contin Educ Health Prof. 2008;28(1):14–9.
3. Sargeant J. Toward a common understanding of self-assessment. J Contin Educ Health Prof. 2008;28(1):1–4.
4. Epstein RM, Siegel DJ, Silberman J. Self-monitoring in clinical practice: a challenge for medical educators. J Contin Educ Health Prof. 2008;28(1):5–13. 5. Silver I, Campbell C, Marlow B, Sargeant J. Self-assessment and continuing
professional development: the Canadian perspective. J Contin Educ Health Prof. 2008;28(1):25–31.
6. Eva KW, Regehr G. Exploring the divergence between self-assessment and self-monitoring. Adv Health Sci Educ. 2011;16(3):311–29.
7. McConnell MM, Regehr G, Wood TJ, Eva KW. Self-monitoring and its relationship to medical knowledge. Adv Health Sci Educ. 2012;17(3):311–23. 8. Patel VL, Kannampallil TG, Shortliffe EH. Role of cognition in generating and
mitigating clinical errors. BMJ Quality & Safety. 2015;24(7):468–74. 9. Eva KW, Regehr G. Knowing when to look it up: a new conception of
self-assessment ability. Acad Med. 2007;82(10):S81.
10. Godin G, Bélanger-Gravel A, Eccles M, Grimshaw J. Healthcare professionals’ intentions and behaviours: a systematic review of studies based on social cognitive theories. Implement Sci. 2008;3(1):36.
11. Bursztajn H, Hamm RM, Gutheil TG, Brodsky A. The decision-analytic approach to medical malpractice law. Med Decis Mak. 1984;4(4):401. 12. Bornstein BH, Emler AC. Rationality in medical decision making: a
review of the literature on doctors’decision making biases. J Eval Clin Pract. 2001;7(2):97–107.
13. Furrow BR. Medical malpractice and cost containment: tightening the screws. Case W Res L Rev. 1985;36:985.
14. Hays RB, Jolly BC, Caldon LJM, McCrorie P, McAvoy PA, McManus IC, et al. Is insight important? Measuring capacity to change performance. Med Educ. 2002;36(10):965–71.
15. Williams BW. The prevalence and special educational requirements of dyscompetent physicians. J Contin Educ Health Prof. 2006;26(3):173–91. 16. Bates DW, Sheikh A. The role and importance of cognitive studies in patient
safety. BMJ Quality & Safety. 2015;24(7):414–6.
17. Neale G, Hogan H, Sevdalis N. Misdiagnosis: analysis based on case record review with proposals aimed to improve diagnostic processes. Clinical Medicine, Journal of the Royal College of Physicians. 2011;11(4):317–21. 18. Arkes HR. Impediments to accurate clinical judgment and possible ways to
minimize their impact. J Consult Clin Psychol. 1981;49(3):323. 19. Kruger J, Dunning D. Unskilled and unaware of it: how difficulties in
recognizing one's own incompetence lead to inflated self-assessments. J Pers Soc Psychol. 1999;77(6):1121–34.
20. Croskerry P, Norman G. Overconfidence in clinical decision making. Am J Med. 2008;121(5A):S24.
21. Ehrlinger J, Johnson K, Banner M, Dunning D, Kruger J. Why the unskilled are unaware: further explorations of (absent) self-insight among the incompetent. Organ Behav Hum Decis Process. 2008;105(1):98–121. 22. Berner ES, Graber ML. Overconfidence as a cause of diagnostic error in
medicine. Am J Med. 2008;121(5):S2–S23.
23. Krueger J, Mueller RA. Unskilled, unaware, or both? The better-than-average heuristic and statistical regression predict errors in estimates of own performance. J Pers Soc Psychol. 2002;82(2):180.
24. Krajc M, Ortmann A. Are the unskilled really that unaware? An alternative explanation. J Econ Psychol. 2008;29(5):724–38.
25. Webster G, Goldfarb S, Norcini J, Shea J, Murray L. Performance of a dangerous answer subtest within a subspecialty certifying examination. Med Ed. 1987;21(5):426–31.
26. Mankin HJ, Lloyd JS, Rovinelli RJ. Pilot study using‘dangerous answers’as scoring technique on certifying examinations. Acad Med. 1987;62(8):621. 27. Slogoff S, Hughes FP. Validity of scoring‘dangerous answers’on a written
certification examination. Acad Med. 1987;62(8):625.
28. Kremer BK, Mankin HJ. A follow-up study of“dangerous answers”in four medical specialties. Evaluation & the Health Professions. 1990;13(4):489–503. 29. Muijtjens AMM, Van Mameren H, Hoogenboom RJI, Evers JLH, Van der
Vleuten CPM. The effect of a'don't know'option on test scores: number-right and formula scoring compared. Med Educ. 1999;33:267–75.
30. Tweed M, Wilkinson T. A randomized controlled trial comparing instructions regarding unsafe response options in a MCQ examination. Med Teach. 2009;31(1):51–4.
31. van Loon MH, de Bruin ABH, van Gog T, van Merriënboer JJG. Activation of inaccurate prior knowledge affects primary-school students’metacognitive judgments and calibration. Learn Instr. 2013;24(0):15–25.
32. Tweed MJ, Thompson-Fawcett M, Schwartz P, Wilkinson TJ. A confidence and safety approach to MCQ scoring. Focus on Health Professional Education: A Multi-disciplinary Journal. 2012;13(3):84–92.
33. Curtis DA, Lind SL, Boscardin CK, Dellinges M. Does student confidence on multiple-choice question assessments provide useful information? Med Educ. 2013;47(6):578–84.
34. Tweed M, Schwartz P. Thompsn-Fawcett m, Wilkinson TJ: determining measures of insight and foresight from responses to multiple choice questions. Med Teach. 2013;35(2):127–33.
35. Livingston SA, Zieky MJ. Passing scores: a manual for setting standards of performance on educational and occupational tests. Princeton: Educational Testing Service; 1982.
36. Cronbach LJ. Essentials of psychological testing. 5th ed. New York: Harper Collins; 1990.
38. Dunning D, Johnson K, Ehrlinger J, Kruger J. Why people fail to recognize their own incompetence. Curr Dir Psychol Sci. 2003;12(3):83.
39. Burson KA, Larrick RP, Klayman J. Skilled or unskilled, but still unaware of it: how perceptions of difficulty drive miscalibration in relative comparisons. J Pers Soc Psychol. 2006;90(1):60.
40. Kruger J, Dunning D. Unskilled and unaware of it: how difficulties in recognizing One's own incompetence lead to inflated self-assessments. Psychology. 2009;1:30–46.
41. Miller TM, Geraci L. Unskilled but aware: reinterpreting overconfidence in low-performing students. J Exp Psychol Learn Mem Cogn. 2011;37(2):502–206. 42. Ryvkin D, KrajčM, Ortmann A. Are the unskilled doomed to remain
unaware? J Econ Psychol. 2012;33(5):1012–31.
43. Hodges B, Regehr G, Martin D. Difficulties in recognizing one's own incompetence: novice physicians who are unskilled and unaware of it. Acad Med. 2001;76(10):S87.
44. Barnsley L, Lyon PM, Ralston SJ, Hibbert EJ, Cunningham I, Gordon FC, et al. Clinical skills in junior medical officers: a comparison of self-reported confidence and observed competence. Med Educ. 2004;38(4):358–67. 45. Valdez CA, Thompson D, Ulrich H, Bi H, Paulsen S. A comparison of pharmacy
students’confidence and test performance. Am J Pharm Educ. 2006;70(4):76. 46. Smith D, Dumont F. Eliminating overconfidence in psychodiagnosis:
strategies for training and practice. Clin Psychol Sci Pract. 1997;4(4):335–45. 47. Ronis DL, Yates JF. Components of probability judgment accuracy:
individual consistency and effects of subject matter and assessment method* 1. Organ Behav Hum Decis Process. 1987;40(2):193–218. 48. Peterson DK, Pitz GF. Confidence, uncertainty, and the use of information.
J Exp Psychol Learn Mem Cogn. 1988;14(1):85.
49. Fischhoff B, Slovic P, Lichtenstein S. Knowing with certainty: the appropriateness of extreme confidence. J Exp Psychol Hum Percept Perform. 1977;3(4):552. 50. Sniezek JA, Paese PW, Switzer FS. The effect of choosing on confidence in
choice. Organ Behav Hum Decis Process. 1990;46(2):264–82.
51. Eva KW, Cunnington JPW, Reiter HI, Keane DR, Norman GR. How can I know what I don't know? Poor self assessment in a well-defined domain. Adv Health Sci Educ. 2004;9(3):211–24.
52. Kulhavy RW, Stock WA. Feedback in written instruction: the place of response certitude. Educ Psychol Rev. 1989;1(4):279–308.
53. Gartmeier M, Bauer J, Gruber H, Heid H. Negative knowledge: understanding professional learning and expertise. Vocat Learn. 2008;1(2):87–103. 54. Campbell WK, Goodie AS, Foster JD. Narcissism, confidence, and risk
attitude. J Behav Decis Mak. 2004;17(4):297–311.
55. Katz J. Why doctors don't disclose uncertainty. Hastings Cent Rep. 1984; 14(1):35–44.
56. Croskerry P. Achieving quality in clinical decision making: cognitive strategies and detection of bias. Acad Emerg Med. 2002;9(11):1184–204. 57. Kalra J, Kalra N, Baniak N: Medical Error, disclosure and patient safety: a
global view of quality Care. Clin Biochem 2013 46(13-14):1161-1169. 58. Garrouste-Orgeas M, Philippart F, Bruel C, Max A, Lau N, Misset B. Overview
of medical errors and adverse events. Ann Intensive Care. 2012;2(1):2. 59. Arah O, Klazinga N. How safe is the safety paradigm? Quality and Safety in
Health Care. 2004;13(3):226–32.
60. Gingerich A, Kogan J, Yeates P, Govaerts M, Holmboe E. Seeing the‘black box’differently: assessor cognition from three research perspectives. Med Educ. 2014;48(11):1055–68.
61. Dijksterhuis M, Scheele F, Schuwirth L, Essed G, Nijhuis J, Braat D. Progress testing in postgraduate medical education. Med Teach. 2009;31(10):e464–8. 62. Tweed M. Negative marking can be justified in marking schemes for
healthcare professional examinations. Med Teach. 2006;28(6):579–80.
• We accept pre-submission inquiries
• Our selector tool helps you to find the most relevant journal
• We provide round the clock customer support
• Convenient online submission
• Thorough peer review
• Inclusion in PubMed and all major indexing services
• Maximum visibility for your research
Submit your manuscript at www.biomedcentral.com/submit