RESEARCH
Itaconic acid degradation in
Aspergillus
niger
: the role of unexpected bioconversion
pathways
Abeer H. Hossain
1,2*, Alexander Ter Beek
1and Peter J. Punt
1Abstract
Background: Itaconic acid (IA), a C5-dicarboxylic acid, has previously been identified as one of the top twelve
bio-chemicals that can be produced by biotechnological means. IA is naturally produced by Aspergillus terreus, however,
heterologous production in the related species Aspergillus niger has been proposed earlier. Remarkably, we observed
that during high producing conditions and elevated titers A. niger detoxifies the extracellular medium of IA. In order
to determine the genes responsible for this decline in IA titers a transcriptome analysis was performed.
Results: Transcriptome analysis has led to the identification of two novel and previously unknown IA
bioconver-sion pathways in A. niger. One pathway is proposed to convert IA into pyruvate and acetyl-CoA through the action of
itaconyl-CoA transferase (IctA), itaconyl-CoA hydratase (IchA) and citramalyl-CoA lyase, similar to the pathway
identi-fied in A. terreus. Another pathway putatively converts IA into 1-methyl itaconate through the action of trans-aconitate
methyltransferase (TmtA). Upon deleting the key genes ictA and ichA we have observed increased IA production and
titers and cessation of IA bioconversion. Surprisingly, deletion of tmtA lead to strong reduction of heterologous IA
production.
Conclusion: Heterologous IA production in A. niger induces the expression of IA bioconversion pathways. These
pathways can be inhibited by deleting the key genes ictA, ichA and tmtA. Deletion of ictA and ichA resulted in
increased IA production. Deletion of tmtA, however, resulted in almost complete cessation of IA production.
© The Author(s) 2019. This article is distributed under the terms of the Creative Commons Attribution 4.0 International License (http://creat iveco mmons .org/licen ses/by/4.0/), which permits unrestricted use, distribution, and reproduction in any medium, provided you give appropriate credit to the original author(s) and the source, provide a link to the Creative Commons license, and indicate if changes were made. The Creative Commons Public Domain Dedication waiver (http://creat iveco mmons .org/ publi cdoma in/zero/1.0/) applies to the data made available in this article, unless otherwise stated.
Background
Rising carbon emissions due to increased industrializa-tion and its effect on the climate are raising awareness to organize our economy in more sustainable ways. How-ever, to transition from our current fossil resource-based economy to a bio-based economy is not easily achieved given the huge dependency on fossil fuels for energy and commodity needs. Biotechnologically produced organic acids have great potential as sustainable alternative for petrochemicals and its use as commodities [1]. The main bottleneck for industrial application of biochemicals, however, is the high price compared with petrochemi-cals. Many yeasts and bacteria have been exploited in the production of industrially relevant biochemicals, e.g.
succinic acid [2]. However, filamentous fungi are due to their natural lifestyle as saprophytic organisms well equipped to break down complex carbohydrate struc-tures e.g. lignocellulose and produce industrially relevant biochemicals. Apart from this fact filamentous fungi are also known as efficient organic acid producers, in par-ticular members of the genus Aspergillus [3].
Itaconic acid (IA), a C5-dicarboxylic acid, has pre-viously been identified as one of the top twelve bio-chemicals that can be produced by biotechnological
means [4]. The potential applications of IA in green
chemistry are numerous and an exciting overview of novel applications is provided by Robert and Friebel
[5]. Industrial production of IA is performed using
the natural producer A. terreus. Currently IA and its chemical derivatives are seen as niche chemical with low industrial relevance. The main applications of IA and its chemical derivatives are as superabsorbent
Open Access
*Correspondence: [email protected]
polymers, synthetic latex, detergent builders, polymers and polyester resins [6, 7]. Lowering production costs and selling price of IA could result in the promotion of IA into a platform chemical that would lead to an tenfold increase in its market size and open market applications such as thermoplastics [8, 9]. In order to achieve this feat the selling price of IA should be com-petitive with fossil-based end use chemicals such as maleic anhydride. The high production cost and sell-ing price of IA can be attributed to the sensitivity of A.
terreus to impurities in industrial cultivation medium
and tight control of fermentation processes [10–12]. Heterologous IA production in the related species
Aspergillus niger has been proposed earlier based on
the superior organic acid production capabilities of A.
niger as exemplified by industrial citric acid (CA)
pro-duction that mainly employs A. niger [13–15]. Addi-tionally A. niger is a more robust production organism able to withstand impurities in industrial cultivation medium; a feat that is evident by the low selling prices
of biotechnologically produced CA [16, 17]. In our
previous report we have communicated the rewiring of
A. niger secondary metabolism citrate synthase (CitB)
leading to an increased IA yield, titer and productiv-ity [18]. Metabolic engineering of ATP-citrate lyase in our rewired pathway has resulted in further improve-ment of IA production (Hossain AH et al. manuscript in preparation). However, we also observed in cul-tivations with these engineered strains that IA titer reaches a plateau after which titers start to decline rapidly (Hossain AH et al. manuscript in prepara-tion). This decline in IA is supposedly brought about by putative IA bioconversion. In order to determine the genes responsible for IA bioconversion a transcrip-tome analysis was performed. In combination with a previous transcriptome analysis of primary metabo-lism genes related to glycolysis, TCA cycle and organic acid transport (de Vries et al. [3]), this analysis led to the identification of previously unknown genes of which the expression is highly upregulated in IA pro-ducing conditions.
Materials and methods Strains and media components
Aspergillus niger strain CitB#99 (CBS141659) [18] was
used in this study in which deletion of ictA, ichA and tmtA was performed. The strains used for transcriptome analysis are listed in Table 1. All strains were stored in 30% glycerol at − 80 °C and maintained on agar contain-ing minimal medium (MM) plates (16 g/L agar, 6 g/L NaNO3, 0.52 g/L KCl, 1.52 g/L KH2PO4, 10 g/L glucose, 0.0022 g/L ZnSO4.7H2O, 0.0011 g/L H3BO3, 0.0005 g/L MnCl2.4H2O, 0.0005 g/L FeSO4.7H2O, 0.00017 g/L CoCl2.6H2O, 0.00016 g/L CuSO4.5H2O, 0.00015 g/L
NaMoO4.2H2O, 0.005 g/L Na2EDTA and 0.5 g/L
Mg2SO4). Spore suspensions were prepared using physi-ological salt solution (0.9% NaCl) and stored at 4 °C for up to 1 year. Fresh spore suspensions were prepared for inoculation during each shake flask and batch fermenta-tion experiment.
Split marker deletion construct and transformation
Auxotrophic pyrE-strains were generated by
cultivat-ing CitB#99 on 5-fluoroorotic acid selective plates [21]. Plates were incubated in a 33 °C stove for 3–5 days until colony formation was visible. Organic acid production of CitB#99 pyrE-colonies was tested by cultivation in micr-otiter plates (see section screening). Knock-out of ictA,
ichA and tmtA was performed using the split-marker
method [22]. An schematic overview of the split-marker approach is shown in Additional file 1. Split-marker flanks
for an ictA and ichA knock-out were generated with
fusion PCR and split-marker flanks for a tmtA
knock-out were in vitro synthesized by GeneArt Gene Synthe-sis (Thermo Scientific) and individually introduced into pJET1.2/blunt via blunt-end ligation using the CloneJET PCR Cloning Kit (Thermo Scientific). The primers used to create the split-marker fragments for ictA and ichA are listed in Additional file 2. The pyrE gene of
Asper-gillus oryzae RIB40 (AO090026000521) was employed
to complement the pyrE deficient phenotype. The split-marker fragments were co-transformed in an ratio of 1:1 (5 µg flank 5′: 5 µg flank 3′). All transformations were
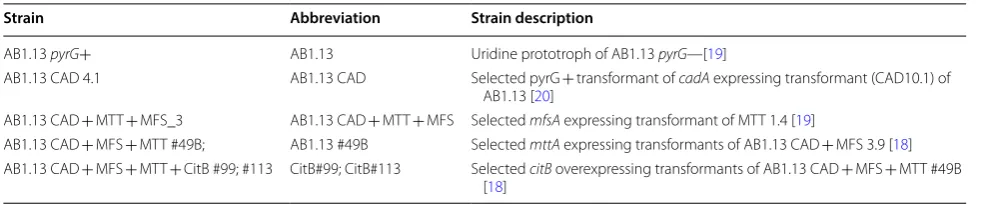
Table 1 List of strains used for transcriptome analysis
Strain Abbreviation Strain description
AB1.13 pyrG+ AB1.13 Uridine prototroph of AB1.13 pyrG—[19]
AB1.13 CAD 4.1 AB1.13 CAD Selected pyrG + transformant of cadA expressing transformant (CAD10.1) of AB1.13 [20]
AB1.13 CAD + MTT + MFS_3 AB1.13 CAD + MTT + MFS Selected mfsA expressing transformant of MTT 1.4 [19]
AB1.13 CAD + MFS + MTT #49B; AB1.13 #49B Selected mttA expressing transformants of AB1.13 CAD + MFS 3.9 [18] AB1.13 CAD + MFS + MTT + CitB #99; #113 CitB#99; CitB#113 Selected citB overexpressing transformants of AB1.13 CAD + MFS + MTT #49B
carried out according to the protocol as reported by Punt et al. [23]. Transformed protoplasts were plated on MM agar plates containing sorbitol and grown at 33 °C for 3–5 days until colonies were visible. Successful targeted integration of bi-partite fragments were determined with
diagnostic colony PCR [24] using various primer
com-binations. Colonies that showed the expected PCR frag-ments were selected for further screening in microtiter plate and shake flask experiments.
Microtiter plate transformant screening
Plates carrying transformed cells were allowed to grow and sporulate for 1–2 weeks after which individual colo-nies were transferred to a selective MM plate. Individual colonies from this plate were each streaked on a separate selective MM plate to isolate single colonies that in turn were used to inoculate 1 mL liquid cultures in a 96-wells deepwell plate (Axygen; Corning, NY) containing M12 ++ medium (1.43 g/L NH4NO3, 0.11 g/L KH2PO4, 0.5 g/L MgSO4× 7 H2O, 0.005 g/L CuSO4× 5 H2O, 0.0006 g/L FeIIICl3× 6 H2O, 0.0006 g/L ZnSO4× 7 H2O, 0.074 g/L NaCl, 0.13 g/L CaCl2× 2 H2O and 100 g/L glu-cose) [20]. This 96-wells plate was incubated for 72 h at 33 °C and 850 RPM. Supernatant was filtered over a 0.22 µM filter (Corning; Corning, NY) and analyzed on an HPLC for IA production (see below).
Flask cultivations
MM agar plates were streaked with conidia from glycerol stocks or from isolated single colonies that were deter-mined by colony PCR. These plates were incubated at 33 °C for several days till plates were fully grown. Fresh conidia suspensions were prepared by harvesting conidia from these plates with sterile 0.9% NaCl solution. The harvested conidia were counted on the LUNA II cell counter (Logos Biosystems). Non-baffled shake flasks
(500 mL) were filled with 100 mL M12 ++ medium and
inoculated with 1.0 × 10⁶/mL conidia and incubated at 35 °C and 0 RPM. Flasks were weighed when empty, after inoculation and each day before sampling. Evaporation is calculated from the measured weight of the flasks and used to correct measured concentrations of organic acids and glucose by HPLC (see below). Error bars in graphs of flask cultivations indicate the standard error of the mean. All flask cultivations were performed in duplicate.
Controlled‑batch cultivations
Controlled-batch cultivations were performed on 5L scale benchtop New Brunswick Scientific fermenters (BioFlo 3000) at 33 °C. Starting pH was 3.5 after inocula-tion and medium was allowed to naturally acidify till pH 2.3 and then kept at pH 2.3 by addition of 4 M KOH. Dis-solved oxygen (DO) tension was 25% at the moment of
inoculation and when DO dropped till 20% it was kept at 20%. The system was calibrated with 100% sterile air
as 100% DO and 100% N2 as 0% DO. The fermenter was
inoculated by 72 h old 100 mL non-baffled shake flask cultures containing 1.0 × 10⁸ spores. Medium
compo-sition for fermentation and pre-culture (M12 ++) is
described above.
HPLC
Metabolite analysis was performed using a WATERS e2695 Separations Module equipped with an Aminex
HPX-87H column (Bio-Rad) and 5 mM H2SO4 as
elu-ent. Detection of peaks occurred simultaneously by a refractive index detector (WATERS 2414) and a dual-wavelength detector (WATERS UV/Vis 2489). Data pro-cessing was done with Empower Pro software (Empower 2 Software, copyright 2005–2008, Waters Corporation, Milford, MA, USA).
RNA isolation and transcriptome analyses
Biomass samples for RNA isolation were taken at several time points during fermentation and washed with dis-tilled water and frozen in liquid N2. The mycelium was disrupted by bead-beating with 0.1 mm acid-washed Zirconium-Silica beads and RNA extraction proceeded using the ChargeSwitch RNA extraction protocol from Invitrogen (Carlsbad, CA, USA). Quality control was
checked on 1 × 3-(N-morpholino)propanesulfonic
acid/6% Formaldehyde agarose gels and stained with eth-idium bromide.
BaseClear in Leiden, NL performed digital gene expression profiling experiments based on RNA-Seq with an Illumina HiSeq 2000 System. Approximately 8–32 M unfiltered paired-end (PE) reads (99 bp/read on ~ 320 bp cDNA inserts) were obtained. Reads were trimmed of the first 2 bases of the 5′ end because these bases showed an aberrantly low GC content. The reads were then fur-ther filtered, such that all quality Phred scores after fil-tering are at least 22, with a read-length of at least 40 bases. Around 70–80% of the bases passed these criteria (including a 2% loss because of clipping). After filtering the # PE-reads/samples were between 7.6 and 19.8 M for all the samples respectively.
Reads were aligned to the 20 contigs in a FastA file of
the Aspergillus niger CBS 513.88 reference genome (from
http://www.ebi.ac.uk/ena). Source EMBL annotations
using software based on a Burrows–Wheeler Transform (BWT) algorithm. A mismatch rate of 4% was allowed for the alignment. The maximum insertion length was 3. The maximum deletion length was 3. All samples had more than 85% of the reads aligned, resulting in SAM align-ment files. Gene expression was measured as the number of aligned reads to reference genes and was normalized to RPKM values (Reads Per Kb per Million reads; Mor-tazavi et al. [25]). Hierarchical clustering was performed with TIGR MEV 4.0. A stringent cut-off at 2logR value of 4.0 for upregulated genes and − 4.0 for downregulated genes was held for data analysis. A more relaxed cutoff of > 2.0 or smaller − 2.0 was used to explore the data for identifying novel differentially expressed gene clusters.
Results
Transcriptome analysis of high IA producing A. niger strains
Previously we have reported the IA production of A.
niger strain CitB#99 that reaches a final titer of 26.2 g/L
with max productivity of 0.35 g/L/h and yield of 0.37 g/g [18]. IA production was further improved by metabolic engineering of ATP-citrate lyase (Hossain et al. [18]). Remarkably, we have also observed IA bioconversion in
A. niger during IA producing cultivations. This
obser-vation manifested in strongly reduced IA titers after achieving a peak IA titer. In addition, IA bioconversion was also observed in cultures were exogenous IA was added to shake flask cultures, showing a reduction of IA levels (Additional file 3). In order to identify the genes involved in IA bioconversion we have analyzed a tran-scriptome dataset of biomass isolated from batch
fer-mentations with low, medium and high IA producing A.
niger strains. In Table 2 transcriptome results of
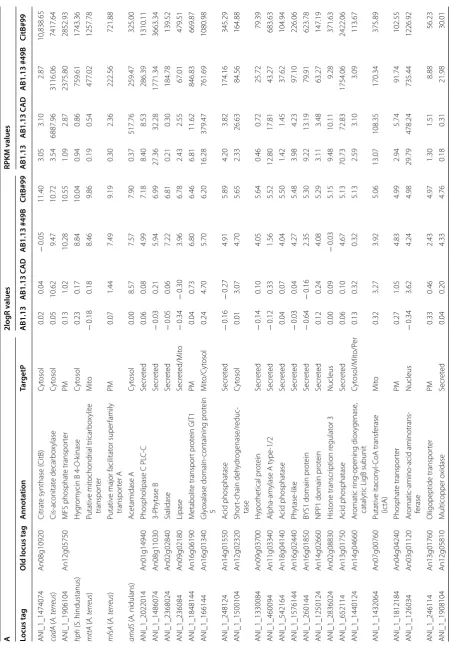
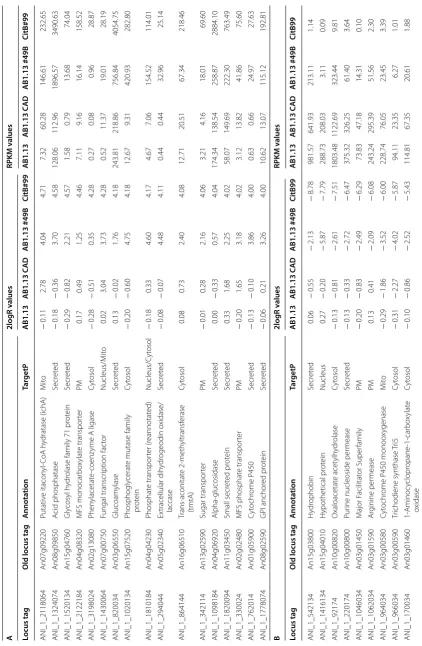
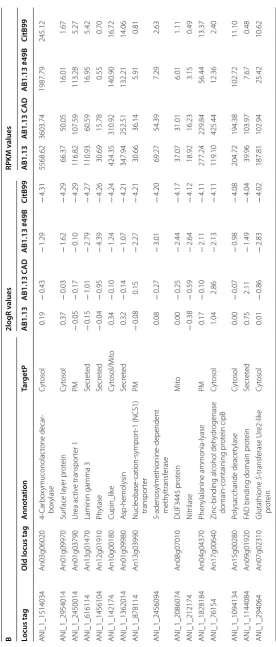
differ-entially regulated genes between the high IA producing strain CitB#99 and AB1.13 WT, that does not produce IA, is given. As expected, the four genes that constitute the engineered part of the heterologous IA biosynthe-sis pathway i.e. cadA, mfsA, mttA and citB are all highly expressed in CitB#99 (Table 2A).
Interestingly, among the highly upregulated genes are a large number of genes that encode gene products with domains that have functions in phosphate libera-tion and translocalibera-tion. This result is in line with the fact that in the IA production medium phosphate is limiting [26]. Remarkably, also the expression of major secreted enzymes such as amylase and glucoamylase, but also a number of other secreted proteins is upregulated in high IA producing conditions. The mechanism behind this result is not entirely clear, but may also be related to the fact that in high IA secretion conditions stress responses are induced which may lead to improved protein secre-tion (Table 2A) [27, 28]. Upon closer inspection of the
results and in particular when expanding the results using a more relaxed cut-off, many of the upregulated and down regulated genes are clustered together in the genome in putative metabolic pathway clusters. This becomes even more apparent when we look at all genes for which the cut-off for differential expression is 2log = 2. Several phosphate and iron related gene clusters were identified showing co-induction in high IA produc-ing strains (Additional file 4).
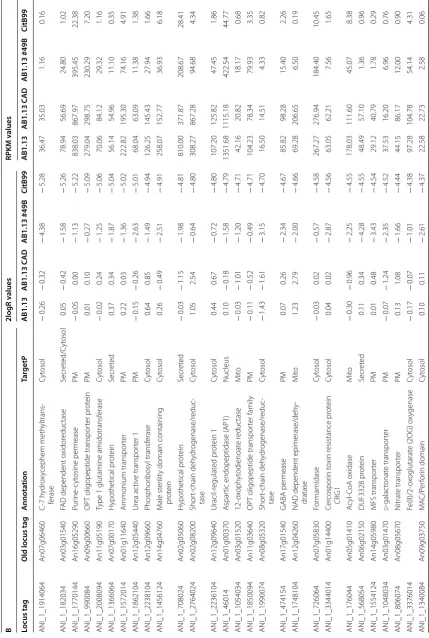
Heterologous IA production in A. niger also results in the downregulation of many genes compared with the AB1.13 strain (Table 2B). In relation to organic acid pro-duction it is interesting to note that the expression of the oahA gene coding for oxaloacetate acetylhydrolase, the enzyme that hydrolyses oxaloacetate into oxalate and acetate, is downregulated in CitB#99. This observation is in line with our previous report were oxalic acid could not be detected in batch fermentations of CitB#99 [18]. Upon closer inspection also genes encoding malate syn-thase and isopropylmalate synsyn-thase are downregulated, assuming further rewiring of the organic acid pathway in our IA production hosts (Additional file 5). Remark-ably among the downregulated genes are many that are involved with N transport and utilization. This could be caused by the use of NH4SO4, as sole N-source in IA pro-duction media, which could mediate nitrogen metabo-lite repression under high IA production conditions. In closer inspection of the selection of genes showing at least fourfold repression in IA overproducing strains besides the many N-source utilisation related functions (permeases etc.) also several secondary metabolite gene clusters were identified (Additional file 5).
Interestingly, in high IA producing conditions CitB#99 upregulates the expression of An07g00760 and An07g09220, when compared to AB1.13. This upregu-lation can already be observed in AB1.13 CAD strain that produces low titers of IA (Table 3) [20]. Genes An07g00760 and An07g09220 share sequence similar-ity with ATEG_06299 and ATEG_03709 that are identi-fied in A. terreus as genes responsible for the biological degradation of IA [29] (Additional file 6). Sasikaran et al. [30] have also elucidated a similar pathway in pathogenic bacteria, suggesting a role in pathogenicity. As Chen et al. show the product of genes ATEG_06299 and ATEG_03709 are itaconyl-CoA transferase (IctA) and itaconyl-CoA hydratase (IchA) that together with citramalyl-CoA lyase (CclA) (ATEG_03186) degrade IA into the cellular building block chemicals pyru-vate and acetyl-CoA. In A. terreus all three genes ictA, ichA and cclA are induced whereas in A. niger only ictA
and ichA are induced. In contrast to what may have
Table 2 D iff er en tial e xpr
essed genes in high IA pr
oducing str ains A 2logR v alues RPKM v alues Locus tag
Old locus tag
A nnota tion Tar getP AB1.13 AB1.13 C AD AB1.13 #49B CitB#99 AB1.13 AB1.13 C AD AB1.13 #49B CitB#99 ANI_1_1474074 An08g10920 Citrat
e synthase (
CitB) Cyt osol 0.02 0.04 − 0.05 11.40 3.05 3.10 2.87 10,838.65 cadA ( A . terr eus ) Cis-aconitat e decar bo xylase Cyt osol 0.05 10.62 9.47 10.72 3.54 6887.96 3116.06 7417.64 ANI_1_1906104 An12g05750 MFS phosphat e transpor ter PM 0.13 1.02 10.28 10.55 1.09 2.87 2375.80 2852.93 hph (S. hindustanus) H yg rom
ycin B
4-O -k inase Cyt osol 0.23 0.17 8.84 10.04 0.94 0.86 759.61 1743.36 mttA ( A . terr eus ) Putativ e mit ochondr ial tr icar bo xylit e transpor ter M ito − 0.18 0.18 8.46 9.86 0.19 0.54 477.02 1257.78 mfsA ( A . terr eus ) Putativ
e major facilitat
or super family transpor ter A PM 0.07 1.44 7.49 9.19 0.30 2.36 222.56 721.88 amdS (A. nidulans) A cetamidase A Cyt osol 0.00 8.57 7.57 7.90 0.37 517.76 259.47 325.00 ANI_1_2022014 An01g14940
Phospholipase C PL
C-C Secr et ed 0.06 0.08 4.99 7.18 8.40 8.53 286.39 1310.11 ANI_1_1486074 An08g11030 3-P hytase B Secr et ed − 0.03 0.21 5.94 6.99 27.36 32.28 1771.34 3663.34 ANI_1_2368024 An02g02840 Sialidase Secr et ed − 0.05 0.06 7.22 6.81 0.21 0.30 184.78 139.52 ANI_1_236084 An09g02180 Lipase Secr et ed/M ito − 0.34 − 0.30 3.96 6.78 2.43 2.55 67.01 479.51 ANI_1_1848144 An16g06190 M etabolit e transpor t pr ot ein GIT1 PM 0.04 0.73 6.80 6.46 6.81 11.62 846.83 669.87 ANI_1_166144 An16g01340 Gly oxalase domain-containing pr ot ein 5 M ito/C yt osol 0.24 4.70 5.70 6.20 16.28 379.47 761.69 1080.98 ANI_1_248124 An14g01550 A cid phosphatase Secr et ed − 0.16 − 0.27 4.91 5.89 4.20 3.82 174.16 345.29 ANI_1_1500104 An12g02320 Shor t-chain deh ydr ogenase/r educ -tase Cyt osol 0.01 3.07 4.70 5.65 2.33 26.63 84.56 164.88 ANI_1_1330084 An09g03700 H ypothetical pr ot ein Secr et ed − 0.14 0.10 4.05 5.64 0.46 0.72 25.72 79.39 ANI_1_460094 An11g03340 Alpha-am
ylase A t
ype -1/2 Secr et ed − 0.12 0.33 1.56 5.52 12.80 17.81 43.27 683.63 ANI_1_542164 An18g04140 A cid phosphatase Secr et ed 0.04 0.07 4.04 5.50 1.42 1.45 37.62 104.94 ANI_1_1576144 An16g02440 Ph ytase -lik e Secr et ed − 0.03 0.04 4.27 5.48 3.98 4.23 97.10 226.06 ANI_1_260144 An16g01850 BY
S1 domain pr
ot ein Secr et ed − 0.64 − 0.16 2.35 5.30 9.22 13.19 79.91 623.78 ANI_1_1250124 An14g02660
NPP1 domain pr
ot ein Secr et ed 0.12 0.24 4.08 5.29 3.11 3.48 63.27 147.19 ANI_1_2836024 An02g08830 H ist one transcr iption r egulat or 3 Nucleus 0.00 0.09 − 0.03 5.15 9.48 10.11 9.28 371.63 ANI_1_652114 An13g01750 A cid phosphatase Secr et ed 0.06 0.10 4.67 5.13 70.73 72.83 1754.06 2422.06 ANI_1_1440124 An14g04660 Ar omatic r ing-opening dio xy genase ,
catalytic LigB subunit
Table 2 (c on tinued) A 2logR v alues RPKM v alues Locus tag
Old locus tag
A nnota tion Tar getP AB1.13 AB1.13 C AD AB1.13 #49B CitB#99 AB1.13 AB1.13 C AD AB1.13 #49B CitB#99 ANI_1_2118064 An07g09220 Putativ e itacon yl-CoA h ydratase (ichA) M ito − 0.11 2.78 4.04 4.71 7.32 60.28 146.61 232.65 ANI_1_1324074 An08g09850 A cid phosphatase Secr et ed − 0.18 − 0.36 3.70 4.58 128.06 112.96 1896.57 3490.63 ANI_1_1520134 An15g04760 Gly cosyl h ydr
olase family 71 pr
ot ein Secr et ed − 0.29 − 0.82 2.21 4.57 1.58 0.79 13.68 74.04 ANI_1_2122184 An04g08320 MFS monocar bo xylat e transpor ter PM 0.17 0.49 1.25 4.46 7.11 9.16 16.14 158.52 ANI_1_3198024 An02g13080 Phen ylacetat e-coenz
yme A ligase
Cyt osol − 0.28 − 0.51 0.35 4.28 0.27 0.08 0.96 28.87 ANI_1_1430064 An07g00750 Fungal transcr iption fac tor Nucleus/M ito 0.02 3.04 3.73 4.28 0.52 11.37 19.01 28.19 ANI_1_820034 An03g06550 Glucoam ylase Secr et ed 0.13 − 0.02 1.76 4.18 243.81 218.86 756.84 4054.75 ANI_1_1020134 An15g07520 Phosphogly cerat
e mutase family
pr ot ein Cyt osol − 0.20 − 0.60 4.75 4.18 12.67 9.31 420.93 282.80 ANI_1_1810184 An04g04230 Phosphat e transpor ter (r eannotat ed) Nucleus/C yt osol − 0.18 0.33 4.60 4.17 4.67 7.06 154.52 114.01 ANI_1_294044 An05g02340 Ex tracellular dih ydr ogeodin o xidase/ laccase Secr et ed − 0.08 − 0.07 4.48 4.11 0.44 0.44 32.96 25.14 ANI_1_864144 An16g06510 Trans-aconitat e 2-meth yltransf erase (tmtA) Cyt osol 0.08 0.73 2.40 4.08 12.71 20.51 67.34 218.46 ANI_1_342114 An13g02590 Sugar transpor ter PM − 0.01 0.28 2.16 4.06 3.21 4.16 18.01 69.60 ANI_1_1098184 An04g06920 Alpha-glucosidase Secr et ed 0.00 − 0.33 0.57 4.04 174.34 138.54 258.87 2884.10 ANI_1_1820094 An11g03450 Small secr et ed pr ot ein Secr et ed 0.33 1.68 2.25 4.02 58.07 149.69 222.30 763.49 ANI_1_330024 An02g02480 MFS phosphat e transpor ter PM − 0.20 1.65 3.18 4.02 3.12 13.82 41.86 75.60 ANI_1_762014 An01g05900 Cyt ochr ome P450 Secr et ed − 0.13 − 0.10 3.86 4.00 0.63 0.66 24.97 27.63 ANI_1_1778074 An08g02590 GPI anchor ed pr ot ein Secr et ed − 0.06 0.21 3.26 4.00 10.62 13.07 115.12 192.81 B 2logR v alues RPKM v alues Locus tag
Old locus tag
A nnota tion Tar getP AB1.13 AB1.13 C AD AB1.13 #49B CitB99 AB1.13 AB1.13 C AD AB1.13 #49B CitB99 ANI_1_542134 An15g03800 H ydr ophobin Secr et ed 0.06 − 0.55 − 2.13 − 8.78 981.57 641.93 213.11 1.14 ANI_1_1416134 An15g04010 H ypothetical pr ot ein Nucleus 0.27 − 0.20 − 5.87 − 7.79 288.73 208.03 3.11 0.09 ANI_1_92174 An10g00820 Oxaloacetat e acet ylh ydr olase Cyt osol − 0.13 − 0.81 − 2.61 − 7.51 1803.48 1122.69 323.44 9.81 ANI_1_220174 An10g00800 Pur
ine nucleoside per
mease Secr et ed − 0.13 − 0.33 − 2.72 − 6.47 375.32 326.25 61.40 3.64 ANI_1_1046034 An03g01450 M ajor F acilitat or Super family PM − 0.20 − 0.83 − 2.49 − 6.29 73.83 47.18 14.31 0.10 ANI_1_1062034 An03g01590 Ar ginine per mease PM 0.13 0.41 − 2.09 − 6.08 243.24 295.39 51.56 2.30 ANI_1_964034 An03g00580 Cyt ochr
ome P450 monoo
Table 2 (c on tinued) B 2logR v alues RPKM v alues Locus tag
Old locus tag
A nnota tion Tar getP AB1.13 AB1.13 C AD AB1.13 #49B CitB99 AB1.13 AB1.13 C AD AB1.13 #49B CitB99 ANI_1_1914064 An07g06460 C-7 h ydr ox ycephem meth yltrans -ferase Cyt osol − 0.26 − 0.32 − 4.38 − 5.28 36.47 35.03 1.16 0.16 ANI_1_182034 An03g01540
FAD dependent o
xidor educ tase Secr et ed/C yt osol 0.05 − 0.42 − 1.58 − 5.26 78.94 56.69 24.80 1.02 ANI_1_1770144 An16g05290 Pur ine -c yt osine per mease PM − 0.05 0.00 − 1.13 − 5.22 838.03 867.97 395.45 22.38 ANI_1_990084 An09g00660
OPT oligopeptide transpor
ter pr ot ein PM 0.01 0.10 − 0.27 − 5.09 279.04 298.75 230.29 7.20 ANI_1_2008094 An11g05190
Type 1 glutamine amidotransf
erase Cyt osol − 0.02 0.24 − 1.25 − 5.06 70.06 84.12 29.32 1.16 ANI_1_1366064 An07g00170 H ypothetical pr ot ein Secr et ed 0.37 0.34 − 1.87 − 5.04 56.14 54.96 11.10 0.35 ANI_1_1572014 An01g11640 Ammonium transpor ter PM 0.22 0.03 − 1.36 − 5.02 222.82 195.30 74.16 4.91 ANI_1_1862104 An12g05440 Ur ea ac tiv e transpor ter 1 PM − 0.15 − 0.26 − 2.63 − 5.01 68.04 63.09 11.38 1.38 ANI_1_2238104 An12g09660 Phosphor ibosyl transf erase Cyt osol 0.64 0.85 − 1.49 − 4.94 126.25 145.43 27.94 1.66 ANI_1_1456124 An14g04760 M ale st er ilit
y domain containing
pr ot ein Cyt osol 0.26 − 0.49 − 2.51 − 4.91 258.07 152.77 36.93 6.18 ANI_1_708024 An02g05060 H ypothetical pr ot ein Secr et ed − 0.03 − 1.15 − 1.98 − 4.81 810.00 371.87 208.67 28.41 ANI_1_2764024 An02g08200 Shor t-chain deh ydr ogenase/r educ -tase Cyt osol 1.05 2.54 − 0.64 − 4.80 308.27 867.28 94.68 4.34 ANI_1_2236104 An12g09640 Uracil-r egulat ed pr ot ein 1 Cyt osol 0.44 0.67 − 0.72 − 4.80 107.20 125.82 47.45 1.86 ANI_1_46014 An01g00370 A spar
tic endopeptidase (
AP1) Nucleus 0.10 − 0.18 − 1.58 − 4.79 1351.68 1115.18 422.54 44.77 ANI_1_1054034 An03g01520 12-ox oph yt odienoat e r educ tase M ito − 0.03 − 1.01 − 1.20 − 4.71 42.16 20.82 18.17 0.68 ANI_1_1850094 An11g03640
OPT oligopeptide transpor
ter family PM − 0.11 − 0.52 − 0.49 − 4.71 104.23 78.34 79.93 3.35 ANI_1_1990074 An08g05320 Shor t-chain deh ydr ogenase/r educ -tase Cyt osol − 1.43 − 1.61 − 3.15 − 4.70 16.50 14.51 4.33 0.82 ANI_1_474154 An17g01540 GABA per mease PM 0.07 0.26 − 2.34 − 4.67 85.82 98.28 15.40 2.26 ANI_1_1748104 An12g04260
NAD dependent epimerase/deh
y-dratase M ito 1.23 2.79 − 2.00 − 4.66 69.28 206.65 6.50 0.19 ANI_1_726064 An07g05830 For mamidase Cyt osol − 0.03 0.02 − 0.57 − 4.58 267.27 276.94 184.40 10.45 ANI_1_3344014 An01g14400 Cer cospor in t oxin r esistance pr ot ein CR G1 Cyt osol 0.04 0.02 − 2.87 − 4.56 63.05 62.21 7.56 1.65 ANI_1_176044 An05g01410 A cyl-CoA o xidase M ito − 0.30 − 0.96 − 2.25 − 4.55 178.03 111.60 45.07 8.38 ANI_1_568054 An06g02150 DUF3328 pr ot ein Secr et ed 0.11 0.34 − 4.28 − 4.55 48.49 57.10 1.36 0.96 ANI_1_1554124 An14g05980 MFS transpor ter PM 0.01 0.48 − 3.43 − 4.54 29.12 40.79 1.78 0.29 ANI_1_1048034 An03g01470 d -galac tonat e transpor ter PM − 0.07 − 1.24 − 2.35 − 4.52 37.53 16.20 6.96 0.76 ANI_1_806074 An08g05670 N itrat e transpor ter PM 0.13 1.08 − 1.66 − 4.44 44.15 86.17 12.00 0.90 ANI_1_3376014 Fe(II)/2-ox oglutarat
e (2OG) o
Table 2 (c on tinued) B 2logR v alues RPKM v alues Locus tag
Old locus tag
A nnota tion Tar getP AB1.13 AB1.13 C AD AB1.13 #49B CitB99 AB1.13 AB1.13 C AD AB1.13 #49B CitB99 ANI_1_1514034 An03g06020 4-Car bo xymuconolac tone decar -bo xylase Cyt osol 0.19 − 0.43 − 1.29 − 4.31 5568.62 3603.74 1987.79 245.12 ANI_1_2954014 An01g09970 Sur face la yer pr ot ein Cyt osol 0.37 − 0.03 − 1.62 − 4.29 66.37 50.05 16.01 1.67 ANI_1_2450014 An01g03790 Ur ea ac tiv e transpor ter 1 PM − 0.05 − 0.17 − 0.10 − 4.29 116.82 107.59 113.28 5.27 ANI_1_616114 An13g01470
Laminin gamma 3
Secr et ed − 0.15 − 1.01 − 2.79 − 4.27 110.93 60.59 16.95 5.42 ANI_1_1456104 An12g01910 Ph ytase Secr et ed − 0.04 − 0.95 − 4.39 − 4.26 30.69 15.78 0.55 0.70 ANI_1_142174 An10g00180 Cupin_lik e Cyt osol/M ito 0.34 − 0.10 − 1.24 − 4.24 424.35 310.92 140.90 16.72 ANI_1_1362014 An01g09980 A sp -hemolysin Secr et ed 0.32 − 0.14 − 1.07 − 4.21 347.94 252.51 132.21 14.06 ANI_1_878114 An13g03990 Nucleobase -cation-sympor t-1 (NCS1) transpor ter PM − 0.08 0.15 − 2.27 − 4.21 30.66 36.14 5.91 0.81 ANI_1_2456094 S -adenosylmethionine -dependent meth yltransf erase 0.08 − 0.27 − 3.01 − 4.20 69.27 54.39 7.29 2.63 ANI_1_2086074 An08g07010 DUF3445 pr ot ein M ito 0.00 − 0.25 − 2.44 − 4.17 37.07 31.01 6.01 1.11 ANI_1_212174 N itr ilase − 0.38 − 0.59 − 2.64 − 4.12 18.92 16.23 3.15 0.49 ANI_1_1828184 An04g04370 Phen ylalanine ammonia-lyase PM 0.17 − 0.10 − 2.11 − 4.11 277.24 229.84 56.44 13.37 ANI_1_76154 An17g00640
Zinc-binding alcohol deh
ydr ogenase domain-containing pr ot ein cipB Cyt osol 1.04 2.86 − 2.13 − 4.11 119.10 425.44 12.36 2.40 ANI_1_1094134 An15g00280 Polysacchar ide deacet ylase Cyt osol 0.00 − 0.07 − 0.98 − 4.08 204.72 194.38 102.72 11.10 ANI_1_1144084 An09g01920
FAD binding domain pr
ot ein Secr et ed 0.75 2.11 − 1.49 − 4.04 39.96 103.97 7.67 0.48 ANI_1_294064 An07g02310 Glutathione S -transf erase Ur e2-lik e pr ot ein Cyt osol 0.01 − 0.86 − 2.83 − 4.02 187.81 102.94 25.42 10.62 (A ) G enes upr egula
ted in high IA pr
oducing c
onditions
. C
ut
off of 2logR v
alues of 4.00 or higher w
as held
. (B) G
enes do
wnr
egula
ted in high IA pr
oducing c
onditions
. C
ut
off of 2logR v
alues of
−
4.00 w
not clustered in the genome of A. niger. More dedi-cated sequence analysis of the encoded proteins reveal that all three carry predicted mitochondrial targeting sequences, suggesting that IA conversion occurs in this compartment.
Interestingly, also another previously uncharacter-ized gene showed similar induction in expression as ictA and ichA in high producing IA strains. Upon closer inspection this gene product (An16g06510) shares 43% homology with Escherichia coli trans-aconitate 2-meth-yltransferase Tam, which is identified by Zhao et al. as potential gene product that esterifies itaconate into
1-methyl itaconate in the yeast Saccharomyces
cerevi-siae [31]. Tam reportedly shares the same molecular
function as the yeast trans-aconitate 3-methyltrans-ferase TMT1 i.e. methylation of spontaneously formed trans-aconitate in order to relieve cytosolic toxicity by trans-aconitate mediated inhibition of aconitase [32,
33].
Deletion of ictA and ichA
In our transcriptome analysis we observed that the expression of ictA and ichA is upregulated in high IA producing strain CitB99. In A. terreus homologues of both gene products IctA and IchA have been shown to participate in a pathway that intracellularly convert IA into pyruvate and acetyl-CoA [29]. Based on these
obser-vations it was considered that knocking-out ictA and
ichA would improve IA production. Bi-partite fragments were generated and transformed into CitB99. After trans-formation 89 colonies were visible on transtrans-formation plates. 24 colonies of each transformation were cultivated in microtiter plates for colony PCR. 4 colonies of CitB99 ΔICT were shown to be positive for deletion of the ictA gene and 6 colonies CitB99 ΔICH were positive for dele-tion of ichA (data not shown). To test for the effect of ΔictA and ΔichA on IA production in-time one CitB99 ΔICT and one CitB99 ΔICH strain were analyzed in flask experiments.
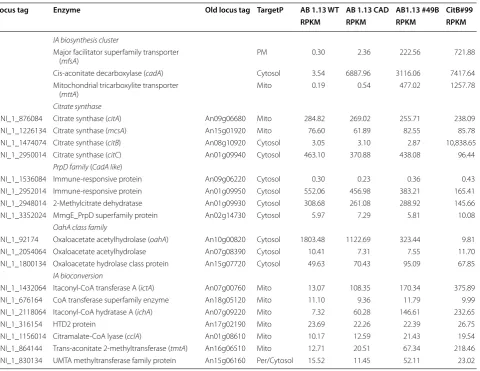
Table 3 Transcriptome data of genes involved in IA biosynthesis and bioconversion
Locus tag Enzyme Old locus tag TargetP AB 1.13 WT AB 1.13 CAD AB1.13 #49B CitB#99
RPKM RPKM RPKM RPKM
IA biosynthesis cluster
Major facilitator superfamily transporter
(mfsA) PM 0.30 2.36 222.56 721.88
Cis-aconitate decarboxylase (cadA) Cytosol 3.54 6887.96 3116.06 7417.64 Mitochondrial tricarboxylite transporter
(mttA) Mito 0.19 0.54 477.02 1257.78
Citrate synthase
ANI_1_876084 Citrate synthase (citA) An09g06680 Mito 284.82 269.02 255.71 238.09 ANI_1_1226134 Citrate synthase (mcsA) An15g01920 Mito 76.60 61.89 82.55 85.78 ANI_1_1474074 Citrate synthase (citB) An08g10920 Cytosol 3.05 3.10 2.87 10,838.65 ANI_1_2950014 Citrate synthase (citC) An01g09940 Cytosol 463.10 370.88 438.08 96.44
PrpD family (CadA like)
ANI_1_1536084 Immune-responsive protein An09g06220 Cytosol 0.30 0.23 0.36 0.43 ANI_1_2952014 Immune-responsive protein An01g09950 Cytosol 552.06 456.98 383.21 165.41 ANI_1_2948014 2-Methylcitrate dehydratase An01g09930 Cytosol 308.68 261.08 288.92 145.66 ANI_1_3352024 MmgE_PrpD superfamily protein An02g14730 Cytosol 5.97 7.29 5.81 10.08
OahA class family
ANI_1_92174 Oxaloacetate acetylhydrolase (oahA) An10g00820 Cytosol 1803.48 1122.69 323.44 9.81 ANI_1_2054064 Oxaloacetate acetylhydrolase An07g08390 Cytosol 10.41 7.31 7.55 11.70 ANI_1_1800134 Oxaloacetate hydrolase class protein An15g07720 Cytosol 49.63 70.43 95.09 67.85
IA bioconversion
Flask cultivation of CitB99 ΔICT and CitB99 ΔICH
The IA production of CitB99 ΔICT and CitB99 ΔICH were analyzed in flask experiments in order to test for the effect of ΔictA and ΔichA on IA production. In line with results obtained for CA production in A. niger [17] we have observed that under non-shaken conditions more reproducible CA and IA production levels could be obtained (Hossain AH et al. unpublished). There-fore Erlenmeyer flasks were inoculated with 1.0 × 10⁶ conidia/mL and incubated at 33 °C without shaking. From the results depicted in Fig. 1a it can be seen that IA production starts and proceeds very similar between CitB99 and CitB99 ΔICT up until 144 h of incuba-tion, after which CitB99 ΔICT continues producing IA at a higher rate than CitB99. IA production in CitB99 reaches a plateau at 24.2 g/L after 240 h incubation
before IA levels start to decline, due to degradation or bioconversion. Interestingly IA production in CitB99 ΔICT continues and reaches a final titer of 33.52 g/L IA after 336 h of incubation even after glucose is depleted in CitB99 ΔICT cultivation after 288 h (Fig. 1b). IA pro-duction in CitB99 ΔICH however, proceeds at a slower rate compared to CitB99 and CitB99 ΔICT. The final titer that is reached with this strain is much lower than CitB99 ΔICT at 26.39 g/L after 336 h but higher than the final titer of CitB99 due to the lack of degradation most likely. No side-product formation e.g. citrate or oxalate has been observed using HPLC analysis. These results show that IA detoxification can be inhibited by deleting ictA or ichA in A. niger. CitB99 ΔICT and
Fig. 1 Non-shaking flask cultivation of CitB99 ΔICT, CitB99 ΔICH and CitB99. Non-baffled 500 mL shake flasks were inoculated with 1.0 × 10⁶
CitB99 ΔICH were further tested in controlled-batch cultivations at 5-L scale.
Controlled‑batch cultivation
Previously, we have observed a slight decrease in IA titers during the end of controlled-batch fermentations [13, 18]. In order to further test the IA production of strains CitB99 ΔICT and CitB99 ΔICH we performed controlled-batch cultivations at 5L scale. The fermenters were inoculated with 100 mL 3 days old pre-cultures and DO was set at 20% saturation after inoculation. Glucose
consumption, biomass formation and IA production started after 24 h of incubation. Glucose was depleted after 312 h for CitB99 ΔICT and after 324 h for CitB99 ΔICH at which point IA titer reached 28.7 and 24.3 g/L IA respectively (Fig. 2a). The fermentation was allowed to run for two more days to see if IA would drop in the glucose depleted cultures (Fig. 2b). The experiment was terminated after 380 h incubation in which no drop in IA levels were measured even after glucose had been depleted. The final titers reached were 29.2 g/L for CitB99 ΔICT and 25.7 g/L for CitB99 ΔICH.
Deletion of tmtA
In order to investigate the role of TmtA in itaconate
bioconversion, tmtA was disrupted in CitB99. After
transformation 96 colonies were screened for
knock-out using colony PCR and strain CitB99 ΔtmtA D6 was
found to be a clean knock-out. IA production of CitB99
ΔtmtA D6 was further investigated by cultivation in
shake flasks. However, HPLC analysis of shake flask
cultivations with CitB99 ΔtmtA D6 and CitB99
(paren-tal strain) in M12 ++ medium showed that IA
pro-duction of CitB99 ΔtmtA D6 was negatively affected,
achieving a max. titre of only 0.9 g/L IA compared
to a max titre of 15.6 g/L IA achieved by the parental strain (Fig. 3a). Interestingly, glucose consumption was comparable between the two strains, suggesting that primary metabolism of glucose might not be affected
in the ΔtmtA strain despite the low production of IA
(Fig. 3b). Elevated levels of other organic compounds, including trans-aconitate and citrate, were not detected in the supernatant (data not shown). These results indicate that knock-out of tmtA does not result in the
same desired phenotype in IA production as ΔictA and
ΔichA has and as a result we did not proceed with 5L
controlled-batch cultivations with this strain.
Fig. 3 IA production of CitB99 ΔtmtA D6 and the parental CitB99 strain. Non-baffled 500 mL shake flasks were inoculated with 1.0 × 10⁶ conidia/mL
Discussion
In our attempt at identifying unknown IA bioconversion pathways in A. niger we have performed a transcriptome analysis of high, medium and low IA producing strains. Interestingly, this analysis led to the identification of at least two novel organic acid bioconversion pathways that were not observed before (Fig. 4). IA is putatively converted into pyruvate and acetyl-CoA through the combined activity of IctA, IchA and CclA. Also, IA is putatively converted into 1-methyl itaconate through the activity of TmtA in yet another bioconversion pathway.
Our observation that knock-out strains of ictA and
ichA show increased production of IA and are not able
to degrade IA corroborate with the results of Chen et al. [29], that this pathway indeed converts IA intracellularly. Although CitB99 ΔICT strain is able to achieve higher titers than the CitB99 ΔICH strain, we observed that deletion of ictA appears to have the same effect as ichA i.e. both knock-out strains are unable to degrade IA. One remarkable feature of the parental strain CitB99 is that the strain performs variably in fermentations where high and low IA production can be seen (data not shown), whereas IA production appears to be more stable in CitB99 ΔICT (data not shown). Our results also suggest that no other enzyme is able to convert itaconate into itaconyl-CoA in the absence of IctA and also that itaco-nate bioconversion cannot proceed without the activity of IchA. Interestingly, CitB99 ΔICH achieves lower IA end titers than CitB99 ΔICT, possibly due to intracellu-lar accumulation of itaconyl-CoA. However, the fate of IctA-mediated itaconyl-CoA accumulation in the CitB99 ΔICH strain remains unclear. Interestingly, the intracel-lular accumulation of itaconyl-CoA has been linked to decreased vitamin B12 levels in human brown adipocytes by Shen H et al. These researchers found that itaconyl-CoA can have a toxic influence by competitive inhibition of the mitochondrial vitamin B12-dependent methyl-malonyl-CoA mutase (mut). This inhibition is mediated by converting vitamin B12 into the chemically inactive cob(II)alamin, thereby decreasing intracellular vitamin B12 levels [34]. Although fungi are not reported in lit-erature to be able to synthesize nor use vitamin B12 as cofactor in biochemical reactions it cannot be excluded that a similar itaconyl-CoA mediated toxicity might be
elicited [35]. Intracellular itaconyl-CoA accumulation might also exert a similar toxicity response as
propionyl-CoA in Aspergillus nidulans. Brock M and Buckel W
found that intracellular accumulation of propionyl-CoA mainly affects enzymes involved in glucose metabolism, thereby severely retarding growth [36]. However, as no apparent toxic effects of itaconyl-CoA accumulation were detected on growth and biomass formation in the CitB99 ΔICH strain, further research is required to investigate any potential toxic side-effects of itaconyl-CoA accumu-lation on fungal physiology.
Interestingly, the identified IA bioconversion path-way appears to share common features with bacterial C5-dicarboxylic acid metabolism, which can use C5 dicarboxylates such as itaconate, mesaconate and cit-ramalate as growth substrates [37]. Pathogenic bacteria have been shown to use this pathway as a means to evade the hosts cellular defense mechanism during infection [30, 38]. Similarly A. niger may use this IA bioconversion pathway as defense mechanism during biological warfare. In nature A. niger and A. terreus share many common growth habitats and are constantly in conflict over scarce resources. However, the link between Aspergillus niger IA bioconversion and central metabolism is not known and is subject to further investigation.
Remarkably, in the high IA producing strain CitB#99 ictA and ichA show similar high levels of induction in expression compared to expression in the AB1.13 strain, however cclA does not show the same induction as ictA and ichA, suggesting that another protein has its func-tion. An alternative possibility might be that IA is con-verted into an unknown compound in A. niger. We have detected unknown peaks in the HPLC samples of cultiva-tions with high IA producing strains. The identification of these peaks and unraveling the link to IA detoxifica-tion however, is topic of ongoing research.
Interestingly, the second identified putative IA bio-conversion pathway involves TmtA that supposedly con-verts IA into 1-methyl itaconate [31]. tmtA shows similar induction in expression as ictA and ichA from AB1.13 to CitB#99, possibly suggesting a role in IA bioconver-sion. A. niger TmtA shows sequence similarity of 28% with S. cerevisiae Tmt1 at a query coverage of 26% and 44% sequence similarity with E. coli Tam at 91% query
coverage. Functional characterization of Tmt1 and Tam has led to the identification of trans-aconitate methyl-transferase activity of both enzymes [32]. Remarkably, Tmt1 was also found to have low-level affinity for IA [33]. Katz et al. further elucidated that the major endog-enous substrate for Tmt1 is an intermediate in the leu-cine biosynthesis pathway, 3-isopropylmalate, and that Tmt1 functions as a so called ‘moonlighting’ enzyme i.e. an enzyme that can perform multiple functions in dif-ferent pathways [39]. The proposed role that Tmt1 plays in the citric acid cycle is detoxification of spontaneously formed trans-aconitate, an potent inhibitor of aconitase. However the physiologic function of methylating 3-iso-propylmalate still requires elucidation [33, 39]. TmtA could perform a similar moonlighting function in A. niger where it methylates trans-aconitate and itaconate. Inter-estingly, deleting tmtA results in almost complete shut-down of IA production in A. niger. This may be caused by an accumulation of trans-aconitate in the mitochondrion and concomitantly the inhibition of aconitase, decreas-ing the flux to cis-aconitate. Interestdecreas-ingly, no other
side-product such as CA was observed in the ΔtmtA strain.
How TmtA exactly fits in heterologous IA production and overall central metabolism in A. niger is not entirely clear and is subject of further research. However from the data presented it is apparent that deletion of tmtA does not play any role in reducing IA bioconversion.
Remarkably, all of the enzymes involved in IA biocon-version IctA, IchA, CclA and TmtA carry predicted mito-chondrial targeting sequences (Table 3). However, for IA bioconversion to take place in the mitochondrion, IA has to be first transported into the cytosol from the extracel-lular medium and concomitantly transported into the mitochondrion. It is currently unknown which transport-ers are involved in the transport across the plasma and mitochondrial membrane. However, in our transcrip-tome data multiple solute transporters have been identi-fied making this a topic for further investigation.
In our research, apart from IA bioconversion pathways, we also looked at other potentially competing biosyn-thetic pathways that could hamper IA production. One possible way in which IA production might be hampered is when competing organic acid biosynthesis pathways are pulling precursor molecules, e.g. pyruvic acid or oxaloacetate, towards them. In A. niger one such compet-ing pathway might lead to the formation of l-lactate [40]. Although a l-lactate dehydrogenase gene is annotated by
sequence homology in Aspergillus niger (An04g08220)
a functional l-lactate dehydrogenase enzyme has not been characterized yet [41]. Although A. niger strains are known to be potent oxalic acid producers, we have seen in our transcriptome data that the expression of the key gene for oxalate production i.e. oahA is significantly
downregulated in CitB#99, indicating less competition from this pathway for precursor molecules.
In our research (Table 3), we have also found a non-canonical cytosolic citrate synthase similar to the previ-ously identified citB [18]. This citC gene (An01g09940) is actually downregulated under citB-mediated improve-ment of IA production. Interestingly, also upon overex-pression of citC we have observed similar positive effects on IA production (Additional file 7). Interestingly, simi-lar as citB also citC appears to be clustered in a second-ary metabolite gene cluster carrying two genes encoding CadA-like enzymes (An01g09930 and An01g09950). These results suggest that rewiring of secondary metab-olism of A. niger towards IA production is much more intricate than we previously suspected.
Interestingly, our transcriptome data also indicates upregulation of phosphorus scavenging enzymes like acid phosphatase and phytase. Organic acid production
in A. niger has been linked with phosphate depletion in
the past [42, 43]. Recently, Upton et al. have shown that in phosphate limited citric acid production medium phosphate is quickly taken up by A. niger and stored as polyphosphate. The researchers further suggest that polyphosphate hydrolysis poses a constraint that limits growth and enables flux of carbon to organic acid pro-duction [44]. Whether a similar response occurs and if polyphosphate putatively fulfills a similar role during het-erologous IA production in A. niger is not clear and war-rants further research. Furthermore we have observed strong reduction in expression of genes encoding prod-ucts that are involved in N transport and utilization, whose functional relation with heterologous IA produc-tion is not clear and also topic for further research.
Conclusion
In our attempt to identify genes involved in putative IA bioconversion in A. niger we have analyzed a transcrip-tome dataset from batch fermentations of low, medium and high IA producing A. niger strains.
Transcriptome analysis has led us to two novel IA con-version pathways in A. niger. These pathways are not induced in non-IA producing conditions, strongly sug-gesting that they are specific for IA. One pathway shares homology with a recently identified IA degradation path-way identified in A. terreus through the combined action of IctA, IchA, and CclA. Upon deleting ictA or ichA we observed cessation of IA bioconversion and an increase in IA production titers.
Furthermore we identified a second putative IA bio-conversion pathway in A. niger that supposedly converts IA into 1-methyl itaconate through the methylating
activity of TmtA. Upon deleting tmtA we observed
overall growth and glucose consumption did not appear to be affected. Based on these observations we postu-late that TmtA is an enzyme that esterifies spontane-ously formed trans-aconitate and thereby relieves the cell of potential toxic effects of trans-aconitate accumu-lation. The results presented in this research contribute in further elucidation of heterologous IA production in
A. niger.
Additional files
Additional file 1. Schematic overview of the split-marker method. Additional file 2. List of primers that were used to generate the split-markers for ictA and ichA deletion.
Additional file 3. Bioconversion of externally added IA to the cultivation medium. Strains AB1.13 CAD and CitB#99 were cultivated in IA supple-mented medium (20 g/L) containing 0.1 and 0.5% glucose respectively. IA bioconversion was compared with medium containing 0.1% glucose. Additional file 4. Transcriptome data of upregulated genes in CitB#99 vs AB1.13 with a 2logR cut off at 2.0.
Additional file 5. Transcriptome data of downregulated genes in CitB#99 vs AB1.13 with a 2logR cut off at -2.0.
Additional file 6. Protein BLAST alignments of IctA, IchA and CclA. Additional file 7. IA production of citC overexpressing A. niger strain AB1.13 #49B-citC A12 Z.
Authors’ contributions
AH, ATB and PJP designed the experiments and analysed the results; AH per-formed the experiments; AH and PJP wrote the manuscript. All authors read and approved the final manuscript.
Author details
1 Dutch DNA Biotech B.V, Padualaan 8, 3584 CH Utrecht, The Netherlands. 2 Molecular Biology and Microbial Food Safety, University of Amsterdam, Sci-ence Park 904, 1098 XH Amsterdam, The Netherlands.
Acknowledgements
The authors are very grateful to Prof. Dr Stanley Brul and Dr. Gertien Smits from University of Amsterdam for discussions and providing ideas and insights. Also are the authors grateful for the contribution from Roy van Gerven in obtaining tmtA knockout strains.
Competing interests
The authors declare that they have no competing interests.
Availability of data and materials
The transcriptome data will be uploaded on GEO.
Consent for publication Not applicable.
Ethics approval and consent to participate Not applicable.
Funding
This research was fully funded by Dutch DNA Biotech BV.
Publisher’s Note
Springer Nature remains neutral with regard to jurisdictional claims in pub-lished maps and institutional affiliations.
Received: 28 September 2018 Accepted: 28 November 2018
References
1. Sauer M, Porro D, Mattanovich D, Branduardi P. Microbial production of organic acids: expanding the markets. Trends Biotechnol (Internet). 2008;26:100–8. http://linki nghub .elsev ier.com/retri eve/pii/S0167 77990 70032 28.
2. Jung Ho A, Yu-Sin J, Yup Lee S. Production of succinic acid by metaboli-cally engineered microorganisms. Curr Opin Biotechnol. 2016;42:54–66. 3. de Vries RP, Riley R, Wiebenga A, Aguilar-Osorio G, Amillis S, Uchima CA, et al. Comparative genomics reveals high biological diversity and specific adaptations in the industrially and medically important fungal genus Aspergillus (Internet). Genome Biol. 2017. Available from: http://genom ebiol ogy.biome dcent ral.com/artic les/10.1186/s1305 9-017-1151-0. 4. Werpy T, Petersen G. Top value added chemicals from biomass. Program.
2004; 1–76.
5. Robert T, Friebel S. Itaconic acid—a versatile building block for renew-able polyesters with enhanced functionality. Green Chem (Internet). 2016;18:2922–34. Available from: http://xlink .rsc.org/?DOI=C6GC0 0605A . 6. Okabe M, Lies D, Kanamasa S, Park EY. Biotechnological production of
itaconic acid and its biosynthesis in Aspergillus terreus. Appl Microbiol Biotechnol. 2009;84:597–606.
7. Weastra SRO. Determination of market potential for selected platform chemicals: itaconic acid, succinic adis, 2,5-furandicarboxylic acid. 2011; 1–173
8. Nieder-Heitmann M, Haigh KF, Görgens JF. Process design and economic analysis of a biorefinery co-producing itaconic acid and electricity from sugarcane bagasse and trash lignocelluloses. Bioresour Technol (Internet). 2018;262:159–68. Available from: http://linki nghub .elsev ier.com/retri eve/ pii/S0960 85241 83059 84.
9. Cruz JC, Castro AM, Sérvulo EFC. World market and biotechnological production of itaconic acid Juliana. 3 Biotech (Internet). Springer, Berlin; 2017;1–27. Available from: https ://doi.org/10.1007/s1320 5-018-1151-0. 10. Gyamerah MH. Oxygen requirement and energy relations of itaconic acid
fermentation by Aspergillus terreus NRRL 1960. Appl Microbiol Biotechnol. 1995;44:20–6.
11. Karaffa L, Díaz R, Papp B, Fekete E, Sándor E, Kubicek C. A deficiency of manganese ions in the presence of high sugar concentrations is the critical parameter for achieving high yields of itaconic acid by Aspergillus terreus. Appl Microbiol Biotechnol (Internet). 2015;1–8. Available from: http://dx.doi.org/10.1007/s0025 3-015-6735-6.
12. Kuenz A, Krull S. Biotechnological production of itaconic acid—things you have to know. Appl Microbiol Biotechnol. 2018;102:3901–14. 13. Li A, van Luijk N, ter Beek M, Caspers M, Punt P, van der Werf M. A
clone-based transcriptomics approach for the identification of genes relevant for itaconic acid production in Aspergillus. Fungal Genet Biol. 2011;48:602–11.
14. van der Straat L, Vernooij M, Lammers M, van den Berg W, Schonewille T, Cordewener J, et al. Expression of the Aspergillus terreus itaconic acid biosynthesis cluster in Aspergillus niger. Microb Cell Fact (Internet). 2014;13:11. Available from: http://www.pubme dcent ral.nih.gov/artic leren der.fcgi?artid =38982 56&tool=pmcen trez&rende rtype =abstr act. 15. Steiger MG, Blumhoff ML, Mattanovich D, Sauer M. Biochemistry of
micro-bial itaconic acid production. Front Microbiol. 2013;4:1–5.
16. Vandenberghe LPS, Soccol CR, Pandey A, Lebeault JM. Review: microbial production of citric acid. Braz Arch Biol Technol. 1999;42:263–76. 17. Soccol CR, Vandenberghe LPS, Rodrigues C. New perspectives for
citric acid production and application. Food Technol Biotechnol. 2006;44:141–9.
18. Hossain AH, Li A, Brickwedde A, Wilms L, Caspers M, Overkamp K, et al. Rewiring a secondary metabolite pathway towards itaconic acid produc-tion in Aspergillus niger. Microb Cell Fact. 2016;15:130.
•fast, convenient online submission
•
thorough peer review by experienced researchers in your field
• rapid publication on acceptance
• support for research data, including large and complex data types
•
gold Open Access which fosters wider collaboration and increased citations maximum visibility for your research: over 100M website views per year
•
At BMC, research is always in progress.
Learn more biomedcentral.com/submissions
Ready to submit your research? Choose BMC and benefit from:
20. Li A, Pfelzer N, Zuijderwijk R, Punt P. Enhanced itaconic acid production in Aspergillus niger using genetic modification and medium optimiza-tion. BMC Biotechnol (Internet). 2012;12:57. Available from: http://www. pubme dcent ral.nih.gov/artic leren der.fcgi?artid =34723 27&tool=pmcen trez&rende rtype =abstr act.
21. Boeke JD, Lacroute F, Fink GR. A positive selection for mutants lacking orotidine-5′-phosphate decarboxylase activity in yeast: 5-fluoro-orotic acid resistance. Mol Gen Genet. 1984;197:345–6.
22. Arentshorst M, Niu J, Ram AFJ. Genetic transformation systems in Fungi, Volume 1. 2015;1:263–72. Available from: http://link.sprin ger. com/10.1007/978-3-319-10142 -2.
23. Punt PJ, Van Den Hondel C a MJJ. Transformation of filamentous fungi based on Hygromycin B and Phleomycin Resistance Markers. Methods Enzymol (Internet). 1992. p. 447–57. Available from: http://www.scien cedir ect.com/scien ce/artic le/pii/00766 87992 16041 H#.
24. Van Zeijl CMJ, Van De Kamp EHM, Punt PJ, Selten GCM, Hauer B, Van Gorcom RFM, et al. An improved colony-PCR method for filamentous fungi for amplification of pcr-fragments of several kilobases. J Biotechnol. 1998;59:221–4.
25. Mortazavi A, Williams BA, McCue K, Schaeffer L, Wold B. Mapping and quantifying mammalian transcriptomes by RNA-Seq. Nat Methods. 2008;5:621–8.
26. Klement T, Büchs J. Itaconic acid—a biotechnological process in change. Bioresour Technol (Internet). 2013;135:422–31. Available from: http:// dx.doi.org/10.1016/j.biort ech.2012.11.141.
27. Guillemette T, Ram AFJ, Carvalho NDSP, Joubert A, Simoneau P, Archer DB. Methods for investigating the UPR in Filamentous Fungi. Unfolded Protein Response Cell. Stress Part B (Internet). 2011 [cited 2018 Sep 14];490:1–29. Available from: https ://ac.els-cdn.com/B9780 12385 11470 00015 /1-s2.0-B9780 12385 11470 00015 -main.pdf?_tid=d0522 153-ae40-4041-93dc-32453 a9abb da&acdna t=15369 13645 _a8a83 87cca 7001d 4a2e6 173cd 36362 27.
28. S P Carvalho ND, Arentshorst M, Kooistra R, Stam H, Sagt CM, M J J van den Hondel CA, et al. Effects of a defective ERAD pathway on growth and heterologous protein production in Aspergillus niger. Appl Genet Mol Bio-technol (Internet) (cited 2018 Sep 14); Available from: https ://www.ncbi. nlm.nih.gov/pmc/artic les/PMC30 16150 /pdf/253_2010_Artic le_2916.pdf. 29. Chen M, Huang X, Zhong C, Li J, Lu X. Identification of an itaconic acid
degrading pathway in itaconic acid producing Aspergillus terreus. Appl Microbiol Biotechnol (Internet). 2016. https ://doi.org/10.1007/s0025 3-016-7554-0.
30. Sasikaran J, Ziemski M, Zadora PK, Fleig A, Berg IA. Bacterial itaco-nate degradation promotes pathogenicity. Nat Chem Biol (Internet). 2014;10:371–7. Available from: http://www.ncbi.nlm.nih.gov/pubme d/24657 929.
31. Zhao Z, Meijrink B, Van der Hoeven R, Roubos A, van Gelder M. Cells for itaconic acid production. United States; 2015.
32. Cai H, Strouse J, Dumlao D, Jung ME, Clarke S. Distinct reactions catalyzed by bacterial and yeast trans-aconitate methyltransferases. Biochemistry. 2001;40:2210–9.
33. Cai H, Dumlao D, Katz JE, Clarke S. Identification of the gene and char-acterization of the activity of the trans-aconitate methyltransferase from saccharomyces cerevisiae. Biochemistry. 2001;40:13699–709.
34. Shen H, Campanello GC, Flicker D, Luo C, Banerjee R, Mootha VK, et al. The Human Knockout Gene CLYBL Connects The Human Knockout Gene CLYBL Connects Itaconate to Vitamin B 12:771–82.
35. Roth JR, Lawrence JG, Bobik TA. Cobalamin (coenzyme B12): synthesis and biological significance. Annu Rev Microbiol. 1996;50:137–81. 36. Brock M, Buckel W. On the mechanism of action of the antifungal agent
propionate. Propionyl-CoA inhibits glucose metabolism in Aspergillus nidulans. Eur J Biochem. 2004;271:3227–41.
37. Fuchs G, Berg IA. Unfamiliar metabolic links in the central carbon metabolism. J Biotechnol. 2014;192:314–22.
38. Cordes T, Michelucci A, Hiller K. Itaconic acid: the surprising role of an industrial compound as a mammalian antimicrobial metabolite. Annu Rev Nutr (Internet). 2014;35:150514143029003. Available from: http:// www.annua lrevi ews.org/doi/abs/10.1146/annur ev-nutr-07171 4-03424 3. 39. Katz JE, Dumlao DS, Wasserman JI, Lansdown MG, Jung ME, Faull KF,
et al. 3-Isopropylmalate is the major endogenous substrate of the Sac-charomyces cerevisiae trans-aconitate methyltransferase. Biochemistry. 2004;43:5976–86.
40. Li A, Punt P. Industrial production of organic acids by Fungi. Appl Microb Eng (Internet). 2013:52–74. Available from: http://dx.doi.org/10.1201/ b1525 0-3.
41. Dave KK, Punekar NS. Expression of lactate dehydrogenase in aspergillus Niger for l-lactic acid production. PLoS ONE. 2015;10:1–16.
42. Schneider KD, Van Straaten P, De Orduña RM, Glasauer S, Trevors J, Fallow D, et al. Comparing phosphorus mobilization strategies using Aspergillus niger for the mineral dissolution of three phosphate rocks. J Appl Micro-biol. 2010;108:366–74.
43. Chuang C-C, Kuo Y-L, Chao C-C, Chao W-L. Solubilization of inorganic phosphates and plant growth promotion by Aspergillus niger. Biol Fertil Soils (Internet). 2007 (cited 2018 Apr 14);44:415–6. Available from: http:// link.sprin ger.com/10.1007/s0037 4-007-0236-4.