www.orientjchem.org
An International Open Free Access, Peer Reviewed Research Journal CODEN: OJCHEG 2017, Vol. 33, No.(5): Pg. 2459-2469
LC-MS/MS Method, Development and Validation to Determine
Three Tetracyclines and Their Epimers in Shrimp Samples
B.SIDDA REDDY
1, 2, Y.SUDHAKAR
2, Y.SUBBA RAO
3,
P.REDDY PRASAD
1and N.Y. SREEDHAR*
11 Department of Chemistry, S. V. University, Tirupati-517 502, A.P. India. 2First Source Laboratory Solutions LLP (Analytical), Hyderabad, T.S, India.
3DST-PURSE Centre, S. V. University, Tirupati- 517 502, A.P, India.
*Corresponding author Email: [email protected] http://dx.doi.org/10.13005/ojc/330539
(Received: March 29, 2017; Accepted: May 25, 2017)
ABSTRACT
A modest liquid chromatography/tandem mass spectrometric method was developed and validated to determine three tetracycline antibiotics and their epimers tetracycline, oxytetracycline, chlortetracycline, 4-epi tetracycline, 4-epi oxytetracycline, 4-epi chlortetracycline in shrimp samples respectively. The procedure was involved the extraction of tetracyclines and its epimers from homogenized sample with EDTA-McIlvaine buffer followed by solid phase extraction clean up with Oasis HLB cartridge. The analysis was carried out using Inertsil ODS-3V, 5 micron, 150×4.6 mm column and mobile phase consists of 5 mM Oxalic acid in water (A) and 0.1% formic acid in methanol (B) in gradient mode at a flow rate of 0.8 mL/minutes. The final extracts were analyzed by the sensitive and selective LC/ESI/MS/MS operating in positive ion multiple reaction monitoring (MRM) mode.
Keywords: Tectracylines, Antibiotics, Shrimp, Liquid chromatography, Tandem mass spectrometry.
INTRODUCTION
Tetracyclines (TCs) are a family of broad-spectrum antibiotics that are highly effective against a number of gram-positive and gram-negative bacteria, these antibiotics used worldwide to control bacterial infection and promote aquatic production1-4. Therefore, the easy
availability and efficiency for the treatment of bacterial infected disease, they were widely used in animal husbandry and aquaculture5-7. As with
other veterinary antibiotics, when tetracycline is
used in food animals, it has the potential to generate drug residues in the animals and animal products which can lead to increases in microbial resistance. Due to the misuse, the antibiotic residues in products of aquatic animal origin (Fish, Shrimp etc.) brought a concern to consumers. The residue of this kind of drugs can be directly toxic or else cause allergic reactions in some hypersensitive individuals8. Thus
human food chain. European Union Commission Regulation 37/2010/EC establishes the MRLs for tetracyclines are 100 µg/kg (ppb) in muscle and 300 µg/kg (ppb) in liver for all food producing species9.
In this respect, it is of great interest to develop analytical procedures capable of determining with good accuracy and sensitivity, the animal tissue concentrations of TCs and to evaluate their presence in edible animal products to protect human health. Accurate monitoring of chemical residue levels in food and agriculture products is essential to assure the safety of the food supply and manage global health risks. The analysis of chemical residues requires techniques sensitive enough to detect and quantify contaminants at or below the maximum residue limit (MRL) of the compound in a given sample matrix. In addition, because of increased food safety regulations and the growing numbers of samples to be analyzed, it is critical that the analytical techniques provide high sample throughput. Several analytical methods have been successfully proposed for the determination of TCs in various matrixes. In particular liquid chromatography in reverse phase mode (RP-HPLC) coupled with different detection systems such as UV 10-15, PDA 16-18, fluorescence is widely used in
routine analysis of TCs in different matrixes19, 20. On
the other hand, during last decade LC-MS/MS methods have been developed and implemented effectively for the determination of TCs mainly due to the known advantages of MS detection over conventional detection methods21-28. However based on the author’s
knowledge no LC-MS/MS method with full validation
has been reported for the determination of tetracycline antibiotics along with their epimers in shrimp samples. Therefore the aim of this study is to develop rapid, simple and reliable LC-MS/MS method for the determination of three tetracyclines (chlortetracycline, oxytetracycline and tetracycline) along with their epimers (4-epi chlortetracycline, 4-epi oxytetracycline and 4-epi tetracycline) in shrimp samples.
EXPERIMENTAL
Chemicals and materials
Methanol, acetonitrile and ammonium acetate were purchased from Sigma-Aldrich. Ethylacetate was purchased from Merck & Co. All the other inorganic chemicals and organic solvents were of analytical reagent grade or higher. Standards of tetracycline, chlortetracycline, oxytetracycline, 4-epi chlortetracycline, 4-epi oxytetracycline, 4-epi tetracycline were acquired from Sigma-Aldrich.
Preparation of stock solution (standard solution) The standard stock solutions were prepared by accurately weighed 10 mg of each standard and is transferred into 10m l volumetric flask and made up to the mark with HPLC grade methanol and stored at -20°C. After proper dilution these stock solutions were used to prepare calibration curve and to fortify the blank shrimp samples to perform the recovery study.
Shrimp samples
Equipment
Liquid chromatography
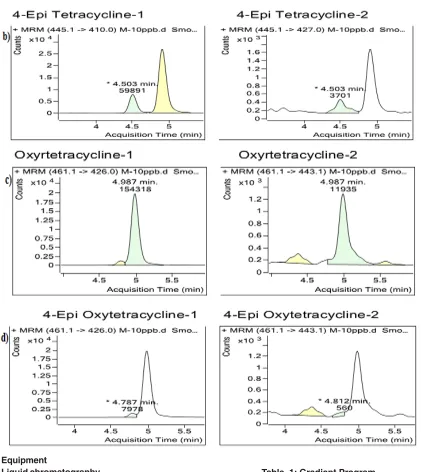
The extracts were separated on Inertsil ODS-3V 5 micron, 150×4.6 mm HPLC column using Agilent 1290 HPLC system with a Binary pump, an auto sampler with temperature control, and a column oven kept at 30 °C. Sample aliquots of 5 µL were injected to the HPLC column, mobile phase consists of 5 mM Oxalic acid in Water (A) and 0.1% Formic acid in Methanol (B) in gradient mode with a flow rate of 0.8 ml/minutes. The gradient programme was given in the Table 1. The resultant chromatograms are shown in Figure. 1.
Table. 1: Gradient Program
S.No. Time % Composition % Composition
(min) of A of B
1 0 90 10
2 8.0 10 90
3 8.1 90 10
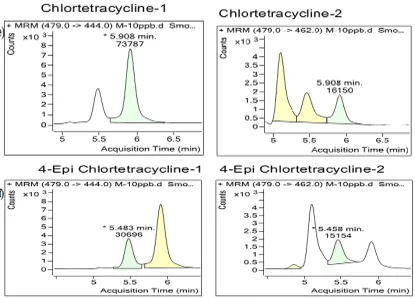
Fig. 1. MRM Chromatograms of TC (a), 4-epiTC (b), OTC(c), 4-epiOTC (d), CTC (e), 4-epi-CTC (f).
Table. 2: Multiple Reaction Monitoring transitions (Dynamic MRM)
Analyte(Transition) Parent ion (Q1) Product ion (Q3) Fragmentor (Volts) CE (Volts) CAV
4-Epi Chlortetracycline-1 479 444 100 28 7
4-Epi Chlortetracycline-2 479 462 100 18 7
4-Epi Oxytetracycline-1 461.1 426 110 10 7
4-Epi Oxytetracycline-2 461.1 443.1 110 15 7
4-Epi Tetracycline-1 445.1 410 110 10 7
4-Epi Tetracycline-2 445.1 427 110 15 7
Chlortetracycline-1 479 444 100 15 7
Chlortetracycline-2 479 462 100 18 7
Oxyrtetracycline-1 461.1 426 110 10 7
Oxyrtetracycline-2 461.1 443.1 110 15 7
Tetracycline-1 445.1 410 110 10 7
Tetracycline-2 445.1 427 110 15 7
Tandem MS analysis
The flow from the LC column was transferred to a triple quadrupole mass spectrometer (Agilent 6470) equipped with an ESI source. The analysis was performed in positive polarity mode for all compounds. Instrument control, data acquisition and evaluation were done with Mass Hunter software, Version B.06.00. Determination
was performed by two MRM (multiple reaction monitoring) transitions (one for quantitation and second one for conformation) mode, the MRM dynamics were given in the table 2. The typical source parameters were: Gas Temperature: 350oC,
Gas flow: 10 l/min. Nebulizer: 45 psig, Sheath Gas Temperature: 400oC, Sheath Gas flow: 11
RESULTS AND DISCUSSION
Sample preparation
Collected blank shrimp samples were cleaned thoroughly, cut in to small pieces and homogenized. 5 g of homogenized sample was weighed and taken into 50 mL centrifuge tube, to this 15 mL of Disodium EDTA McIlvaine buffer is added, vortexed for 5 min. separated the aqueous layer by centrifuging the sample with 4500 rpm at 4 oC. The supernatant was transferred into a clean
tube and repeated the extraction by adding 15 ml of McIlvaine buffer and combined the aliquots.
SPE Clean UP: The aqueous layer was applied to on preactivated with methanol (6ml), water 93 ml) and Mcvallin buffer (6 ml) HLB 500 mg/ 6cc spe cartridge previously activated with methanol and milli-Q water. After sample loading, the cartridge was given washings with Milli-Q water (6 ml) and dried the cartridge with the help of vacuum. TC antibiotics were eluted with methanol (6 ml) and the eluent was evaporated under a stream of nitrogen at 35oC , and the residue was
dissolved in 2 mL 0.1% Formic acid: Methanol (9:1) and analyse on LC-MS/MS.
Method validation
The proposed method was validated for system suitability, specificity, selectivity, sensitivity (limits of detection and limit of quantification),
recovery (accuracy), ruggedness, decision limit (CC
α) and detection capability (CC β) according to 2002/657/EC decision.
System suitability
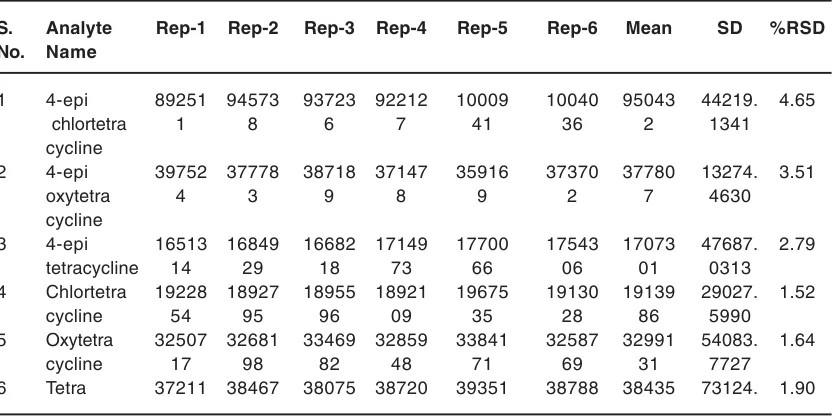
System suitability was performed by injecting six replicates of known concentration of standard solution. The results were within the acceptance criteria i.e. % RSD of area was less than 5%. The results have been given in Table 3. Specificity
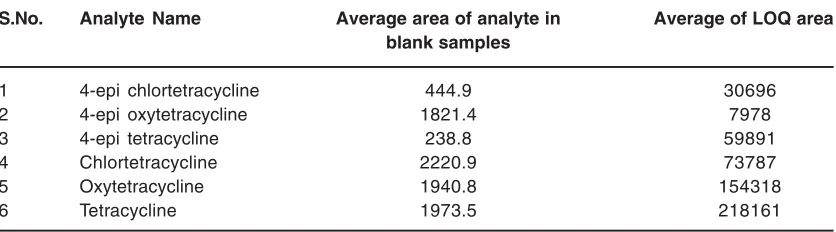
Specificity was performed by injecting 20 representative blank samples and sample spiked at MRL, observed that there was no interferences at the retention of analyte. The results have been given in Table 4.
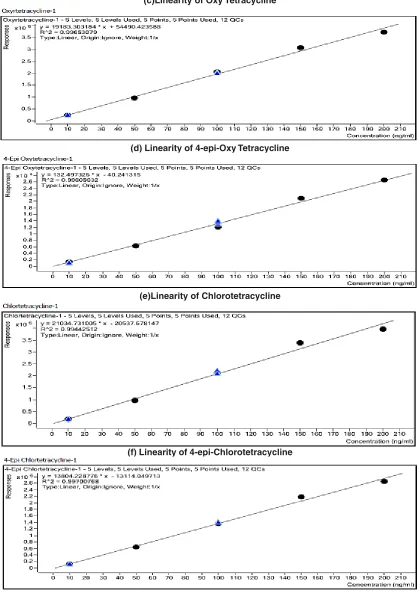
Calibration Curve (Linearity)
Linearity was checked for each compound using six standard solutions with concentrations ranging in concordance with the level of the maximum residue limit (MRL). Three sets Linearity was established using matrix-matched calibration curves. Calibration curves were prepared at levels of matrix blank, 10 ppb, 50 ppb, 100 ppb, 150 ppb and 200 ppb in Shrimp and analyzed with each batch. The results of coefficient of determination greater than 0.99 and the results have been shown in Table 5 and Figure. 2.
Table. 3: System suitability
S. Analyte Rep-1 Rep-2 Rep-3 Rep-4 Rep-5 Rep-6 Mean SD %RSD
No. Name
1 4-epi 89251 94573 93723 92212 10009 10040 95043 44219. 4.65
chlortetra 1 8 6 7 41 36 2 1341
cycline
2 4-epi 39752 37778 38718 37147 35916 37370 37780 13274. 3.51
oxytetra 4 3 9 8 9 2 7 4630
cycline
3 4-epi 16513 16849 16682 17149 17700 17543 17073 47687. 2.79
tetracycline 14 29 18 73 66 06 01 0313
4 Chlortetra 19228 18927 18955 18921 19675 19130 19139 29027. 1.52
cycline 54 95 96 09 35 28 86 5990
5 Oxytetra 32507 32681 33469 32859 33841 32587 32991 54083. 1.64
cycline 17 98 82 48 71 69 31 7727
Table. 4: Specificity
S.No. Analyte Name Average area of analyte in Average of LOQ area
blank samples
1 4-epi chlortetracycline 444.9 30696
2 4-epi oxytetracycline 1821.4 7978
3 4-epi tetracycline 238.8 59891
4 Chlortetracycline 2220.9 73787
5 Oxytetracycline 1940.8 154318
6 Tetracycline 1973.5 218161
Table. 5: Linearity Results
S.No. Compound Slope (m) Coefficient of determination (R2)
1 4-epi chlortetracycline 4472.684 0.998901
2 4-epi oxytetracycline 1986.989 0.99912
3 4-epi tetracycline 9320.932 0.998678
4 Chlortetracycline 8843.196 0.998558
5 Oxytetracycline 15773.01 0.998562
6 Tetracycline 20477.41 0.998768
(a) Linearity of Tetracyline
Fig. 2. Linearity diagram of TC (a), 4-epi TC (b), OTC(c), 4-epi OTC (d), CTC (e), 4-epi-CTC (f).
(d) Linearity of 4-epi-Oxy Tetracycline
(e)Linearity of Chlorotetracycline
Table. 7: Recovery/Accuracy
S.No. Compound Mean (Concentration in ppb) % Recovery/Accuracy
(Concentration in ppb)
Batch -1 Batch -2 Batch -3 Batch -1 Batch -2 Batch -3
1 4-epi chlortetracycline 43.2018 44.8266 42.5916 86.40 89.65 85.18 2 4-epi oxytetracycline 42.7798 42.7275 46.8627 85.56 85.45 93.73 3 4-epi tetracycline 41.7066 41.5344 41.5838 83.41 83.07 83.17 4 Chlortetracycline 54.7178 54.5396 52.6245 109.44 109.08 105.25 5 Oxytetracycline 53.2315 51.2158 50.6047 106.46 102.43 101.21
6 Tetracycline 57.7920 55.6192 55.2160 115.58 111.24 110.43
Limit of Detection and Limit of Quantification Calculated the Limit of Detection (LOD) and Limit of Quantification (LOQ) by using standard deviation (STEYX) of the response and the slope of the linearity and the obtained LOD and LOQ values are given in the Table 6.
Repeatability and Within Laboratory Reproducibility Repeatability was performed by injecting seven spiked samples at 50 ppb, 100 ppb and 150 ppb and calculated the mean, standard deviation and % RSD. The results were within the acceptance criteria i.e. % RSD of area ≤20. For within Laboratory reproducibility the above procedure was performed and calculated the mean, standard deviation and %RSD for all the analyses at 50 ppb (0.5 MRL), 100 ppb (MRL) and 150 ppb (1.5 MRL).
Recovery/Accuracy (Trueness)
Recovery was performed by injecting seven spiked samples at 50 ppb, 100 ppb and 150 ppb and calculated the mean, the standard deviation and the coefficient of variance for these
Table. 6: Limit of Detection and Limit of Quantification
S.No. Compound SD (STEYX) Slope LOD LOQ
1 4-epi chlortetracycline 24310.06 4472.684 17.93625 54.35229 2 4-epi oxytetracycline 9663.506 1986.989 16.04919 48.63392
3 4-epi tetracycline 55580.3 9320.932 19.67775 59.62955
4 Chlortetracycline 55064.58 8843.196 20.54835 62.26774
5 Oxytetracycline 98082.35 15773.01 20.52061 62.18366
6 Tetracycline 117829.7 20477.41 18.98863 57.54131
concentrations, calculate the recovery as accuracy (trueness) by dividing the detected mean concentration by the fortified value and multiply by 100 and the results are given in Table 7.
Ruggedness
Ruggedness was performed by injecting seven spiked samples with two different analysts and two different lots of extraction solvents at permitted level. Calculated the Mean, standard deviation and % RSD. The results were within the acceptance criteria i.e. % RSD of area ≤7 and the results were given in Table-8.
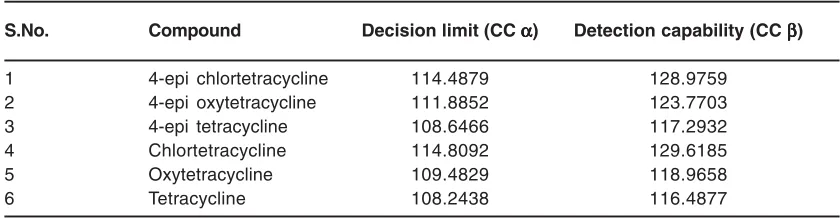
Decision Limit (CC α)
Table. 8: Ruggedness
S.No. Compound Mean SD %RSD
1 4-epi chlortetracycline 43.54 1.67 3.84 2 4-epi oxytetracycline 44.12 2.89 6.55 3 4-epi tetracycline 41.61 0.91 2.18 4 Chlortetracycline 53.96 2.10 3.89 5 Oxytetracycline 51.68 1.76 3.40 6 Tetracycline 56.21 2.19 3.90 Detection Capability (CC β)
Detection capability (β = 5 %) was calculated, the concentration at decision limit plus 1.64 times the standard deviation of the 20 samples fortified at decision limit. The results were shown in table 9 and the recoveries of the 20 samples are meeting the criteria.
Table. 9 : Decision limit (CC ααααα) and detection capability (CC βββββ)
S.No. Compound Decision limit (CC ααααα) Detection capability (CC βββββ)
1 4-epi chlortetracycline 114.4879 128.9759
2 4-epi oxytetracycline 111.8852 123.7703
3 4-epi tetracycline 108.6466 117.2932
4 Chlortetracycline 114.8092 129.6185
5 Oxytetracycline 109.4829 118.9658
6 Tetracycline 108.2438 116.4877
CONCLUSIONS
A simple positive ion LC-MS/MS method was developed and validated for the determination of tetracyline antibiotic residues in raw shrimp meat. Based on the results obtained, acceptance criteria for all validation parameters such as system suitability, specificity, calibration curve (Linearity), repeatability, within laboratory reproducibility, recovery, decision limit (CC α) and detection capability (CC β) have been met for the method used to estimate the tetracylines in shrimp samples as per protocol and as well as EU guideline council Directive 2002/657/EC. The method requires only
a small sample volume, needs minimal manual sample preparation and reasonable run time. For this reason, the method could be useful for determination of tetracylines in shrimp samples. Henceforth considered the method is validated and can be used for further intended purpose.
ACKNOWLEDGEMENTS
The author BSR thankful to authorities of S.V.University, Tirupati for their encouragement. The authors BSR and SY thankful to Management First Source Laboratory Solutions LLP (Analytical), Hyderabad for giving permission to carry out this work.
REFERENCES
1. Katiyar, S.K; Elend, T.D; Enhanced antiparasitic activity of lipophilic tetracyclines: role of uptake. Antimicrob. Agents Chemother. 1991, 35, 2075– 2080.
2. Chopra, I; Hawkey, P.M; Hinton, M; Tetracyclines, molecular and clinical aspects. J. Antimicrob. Chemother., 1992, 29, 245–277.
3. Rober ts, M.C; Tetracycline resistance determinants: mechanisms of action,
regulation of expression, genetic mobility, and distribution. FEMS Microbiol. Rev., 1996, 19, 1–24.
2003, 51, 697–703
5. Frank, J.K; Patrick, S.C; Antibiotic resistance of bacteria from shrimp ponds, Aquaculture, 2001, 195(3-4), 193-204.
6. Oka, H; Ikai, Y; Ito, Y; Hayakawa, J; Harada, K; Suzuki, M; Odani, H; Maeda, K; J. Chromatogr. B., 1997, 693, 337.
7. Carson, M.C; Ngoh, M.A; Hadley, S.W; J. Chromatogr. B., 1998, 712, 113.
8. Cinquina, A.L; Longo, F; Anastasi, G; Giannetti, L; Cozzani, R; J. Chromatogr. A., 2003, 987, 227.
9. COMMISSION REGULATION (EU) No 37/2010 of 22 December 2009 on pharmacologically active substances and their classification regarding maximum residue limits in foodstuffs of animal origin
10. Andersen, W.C; Roybal, J.E; Gonzales, S.A; Turnipseed, S.B; Pfenning, A.P; Kuck, L.R; Determination of tetracycline residues in shrimp and whole milk using liquid chromatography with ultraviolet detection and residue confirmation by mass spectrometry. Analytica Chimica Acta, 2005, 529, 145–150.
11. Lee, J.B; Chung, H.H; Chung, Y.H; Lee, K.G; Development of an analytical protocol for detecting antibiotic residues in various foods. Food Chemistry, 2007, 105, 1726–1731. 12. Fletouris, D.J; Papapanagiotou, E.P; A new
liquid chromatographic method for routine determination of oxytetracycline marker residue in the edible tissues of farm animals.Analytical and Bioanalytical Chemistry, 2008, 391, 1189–1198.
13. Tereza,T; Jana, O; Petr, N; Miroslav Flieger, High-throughput analysis of tetracycline antibiotics and their epimers in liquid hog manure using Ultra Performance Liquid Chromatography with UV detection, Chemosphere. 2010, 78, 353–359.
14. Fabio, G; Jorge, S; Fernando, G; and Cesar, R; A Novel Green Chemistry Method for Nonaqueous Extraction and High-Perfor mance Liquid Chromatography Detection of First-,Second-, and Third-Generation Tetracyclines, 4-Epitetracycline, and Tylosin in Animal Feeds, J. Agric. Food Chem. 2012, 60, 7121"7128
15. Yu, Liu; Hailan, Yang; Sheng, Y; Qiwei, H; Hongbo, C; Huiyu, L; Yinsheng, Qiu;
High-performance liquid chromatography using pressurized liquid extraction for the determination of seven tetracyclines in egg, fish and shrimp, J. Chromatogr. B, 2013, 917, 11– 17.
16. Vinas, P; Balsalobre, N; Lopez-Erroz, C; Hernandez-Cordoba, M; Liquid chromatography with ultraviolet absorbance detection for the analysis of tetracycline residues in honey. J. of Chromatogr. A, 2004, 1022, 125–129.
17. Wen, Y; Wang, Y; Feng, Y.Q; Simultaneous residue monitoring of four tetracycline antibiotics in fish muscle by in-tube solid-phase microextraction coupled with high-performance liquid chromatography. Talanta, 2006, 70, 153–159.
18. Fritz, J.W; Zuo, Y; Simultaneous determination of tetracycline, oxytetracycline, and 4-epitetracycline in milk by high-performance liquid chromatography. Food Chemistry, 2007, 105, 1297–1301.
19. Schneider, M.J; Braden, S.E; Reyes-Herrera, I; Donoghue, D.J; Simultaneous determination of fluoroquinolones and tetracyclines in chicken muscle using HPLC with fluorescence detection.J. Chromatogra. B, 2007, 846, 8–13.
20. Maia, P.P; Rath, S; Reyes, F.G; Determination of oxytetracycline in tomatoes by HPLC using fluorescence detection. Food Chemistry, 2008, 109, 212–218.
21. Goto, T; Ito, Y; Yamadaa, S; Matsumoto, H; Okab, H; High-throughput analysis of tetracycline and penicillin antibiotics in animal tissues using electrospray tandem mass spectrometry with selected reaction monitoring transition.J. Chromatogra. A, 2005, 1100, 193–199.
22. Zhenfeng, Y; Yueming, Q; Xiuyun, L; Caini, J; Determination of multi-residues of tetracyclines and their metabolites in milk by high performance liquid chromatography–tandem positive-ion electrospray ionization mass spectrometry. Chinese Journal of Analytical Chemistry, 2006, 34, 1255–1259.
24. Xu, J.Z; BinWu, T.D; Yang, W.Q; Zhang, X.Y; Liu, Y; Shen, C.Y; . Analysis of tetracycline residues in royal jelly by liquid chromatography–tandem mass spectrometry. J. Chromatogr. B, 2008, 868, 42–48.
25. Jing, T; Gao, X.D; Wang, P; Wang, Y; Lin, Y.F; Hu, X.Z; Determination of trace tetracycline antibiotics in foodstuffs by liquid chromatography–tandem mass spectrometry coupled with selective molecular-imprinted solid-phase extraction. Analytical and Bioanalytical Chemistry, 2009, 393, 2009–2018.
26. Venkates, P; Arun Kumar, N; Hari Prasad, R; Krishnamoorthy, K.B; Hari Prasath, K; Soumya, V; LC/MS/MS analysis of tetracycline antibiotics in prawns (Penaeus monodon) from south India coastal region, Journal of Pharmacy Research, 2013, 6, 48-52.
27. Ewelina, P; Krzysztof, K; Analytical procedure for the determination of tetracyclines in medicated feeding stuffs by liquid chromatography-mass spectrometry, J Vet Res. 2016, 60, 35-41.
28. Jing-Jing, X; Mingrui, A; Rui, Yang; Zhijing, Tan; Jie, H; Jun, Cao; Li-Qing, P; Wan, C; Determination of Tetracycline Antibiotic Residues in Honey and Milk by Miniaturized Solid Phase Extraction using Chitosan-Modified Graphitized Multi-walled Carbon Nanotubes, J. Agric. Food Chem .2016, 30, 2647-54.