Nat. Hazards Earth Syst. Sci., 12, 1353–1365, 2012 www.nat-hazards-earth-syst-sci.net/12/1353/2012/ doi:10.5194/nhess-12-1353-2012
© Author(s) 2012. CC Attribution 3.0 License.
Natural Hazards
and Earth
System Sciences
Changes in annual maximum number of consecutive dry and wet
days during 1961–2008 in Xinjiang, China
Y. Zhang1,2,5, F. Jiang1, W. Wei1, M. Liu1,5, W. Wang3, L. Bai1, X. Li4, and S. Wang1,2
1Xinjiang Institute of Ecology and Geography, Chinese Academy of Sciences, 818 South Beijing Road Urumqi, Xinjiang 830011, China
2Graduate School, Chinese Academy of Sciences, Beijing 100049, China 3Xinjiang Bureau of Meteorology, Urumqi, Xinjiang 830011, China
4Tianshan Snow Avalanche Research Station, Chinese Academy of Sciences, Urumqi, Xinjiang 830000, China 5Department of Mathematics, Xinjiang University, Urumqi, 830046, China
Correspondence to: W. Wei ([email protected])
Received: 27 September 2011 – Revised: 3 February 2012 – Accepted: 4 April 2012 – Published: 9 May 2012
Abstract. Extreme precipitation events are major causes of severe floods and droughts worldwide. Therefore, scientific understanding of changing properties of extreme precipita-tion events is of great scientific and practical merit in the de-velopment of human mitigation of natural hazards, such as floods and droughts. Wetness and dryness variations during 1961–2008 in Xinjiang, a region of northwest China charac-terised by an arid climate, are thoroughly investigated using two extreme precipitation indices. These are annual max-imum consecutive dry days (CDD) and annual maxmax-imum consecutive wet days (CWD), based on a daily precipitation dataset extracted from 51 meteorological stations across Xin-jiang. As a result, we present spatial distributions of mean annual CDD and mean annual CWD and their trends within the study period. The results indicate that:
(1) CDD maximize in the Taklimakan and Turban basins of southeast Xinjiang, while minima are found in the Tianshan Mountains and the Ili river valley of northwest Xinjiang. On the contrary, the longest CWD are observed in northwest Xinjiang and the shortest in the southeast part of the region. (2) On an annual basis, CWD temporal variability shows sta-tistically positive trends and a rate of increase of 0.1d/10a. CDD temporal variability shows statistically negative trends and a rate of decrease of 1.7d/10a. (3) Goodness-of-fit anal-ysis for three candidate probability distribution functions, generalised Pareto distribution (GPD), generalised extreme value (GEV) and Gumbel, in terms of probability behaviours of CDD and CWD, indicates that the GEV can well depict changes of CDD and CWD. (4) The CDD and CWD
bet-ter describe wet and dry conditions than precipitation in the Xinjiang. The results pave the way for scientific evaluation of dryness/wetness variability under the influence of chang-ing climate over the Xinjiang region.
1 Introduction
1354 Y. Zhang et al.: Changes in annual maximum number of consecutive dry and wet days
big river valleys since the 1990s. In addition, both flood and geological disasters have increased as a consequence of the increase in concentration of intense precipitation events (e.g., Zhang et al., 2008). Changes in spatial and temporal con-centration and variation of heavy precipitation were possible reasons for frequent flood disasters in China (Xie et al., 2005; Zhang et al., 2008, 2009a).
Xinjiang, in northwest China, is characterised by an arid climate. This climate and its unique topography, which is known as “two basins lying between three mountains,” form the unique water cycle of this region. Alterations of the climate and hydrologic cycles have occurred over the past 30 yr. Strong signals of climatic shift from warm-dry to warm-humid climate have been observed in the west-ern Tianshan Mountains and neighbouring regions, includ-ing northern Xinjiang, since the mid to late 1980s. Precipita-tion, glacial meltwater and river runoff are rising, resulting in increased flood damage and vegetation coverage and fewer dust storm events (Yang et a1., 2003). As one of the most important irrigated agricultural production areas in China, Xinjiang has a vulnerable ecological environment and seri-ous water shortage. Therefore, precipitation changes have a crucial role in the sustainable ecological and regional socio-economic environments. Increasing and intensifying weather extremes, such as with precipitation, will further increase the sensitivity of the ecological environment to climate changes, particularly changes in precipitation. This is the major mo-tivation for the current study. Jiang et al. (2002a, b, 2004a, b, 2005) indicated an increase of droughts and floods in the study region, which is in line with changing properties of floods and droughts in China and across the world. Shi et al. (2002, 2003) showed that the regional climate in north-west China exhibited a climate shift from dry to warm-wet states over the last two decades. Flood and drought will potentially increase, intensifying in the 21st century in Xin-jiang because of global warming (Xu, 1997; Jiang et al., 2004b; Zhang et al., 2008).
We analyse consecutive dry day (CDD) and consecutive wet day (CWD) changes and possible implications for flood and drought changes, using reliable, consistent and suffi-cient rain gauge data. Temporal variability of extremes is analysed over fixed decades, from 1961–1970, 1971–1980, 1981–1990, 1991–2000 and 2001–2008. CDD and CWD re-turn period analysis is used to study the variable probabil-ity of extreme rainfall events with observed data, to investi-gate changes in flood risk. Although there have been studies of drought/wetness variations elsewhere in China, e.g., the Pearl River basin (Zhang et al., 2009b), no such research is available for the Xinjiang region. We believe that the current study is necessary for understanding precipitation changes and possible implications for flood and drought changes in the study region, under the impacts of a changing climate.
2 Study region
Xinjiang, an autonomous region in northwest China, has the largest area of all province-level administrative regions and arid land in China. Its total area is about 1.6 million km2, which includes two vast deserts, the Taklimakan and the Gur-bantunggut. These are situated between three high mountain ranges, i.e., the Altun, Tianshan and Kunlun, which stretch across the north, middle and south of the study region (Jiang et al., 2009). The Tianshan Mountains divide Xinjiang into southern and northern parts. Located in the hinterland of the Eurasian continent, far from the ocean and surrounded by mountains, the Xinjiang region is dominated by a temperate continental climate with low precipitation. Annual precipita-tion is distributed unevenly, with an average of 130 mm, and the average number of rainy days is 55. The geographical distribution of precipitation is as follows: Precipitation in-creases from southeast to northwest, from windward to lee-ward slopes and from mountain areas to plains and basins. Precipitation dependence on elevation is obvious. The range of annual precipitation in the south is less than in the north (Su et al., 2007). The climate is affected mostly by the west-erly current from the Atlantic and Arctic Oceans. Now, sev-eral studies (Xu et al., 2008; Li et al., 2010) indicate that annual precipitation is showing an increasing trend with the increase in temperature. Variation of upper-air wind fields over northwest Xinjiang indicates that moist currents from the south are strengthened. At the same time, wind from the north is also strengthened over eastern Xinjiang and mois-ture transport from the southeast is weakened. This is the main reason for a wet north and a continued dry south.
3 Data and methods 3.1 Data
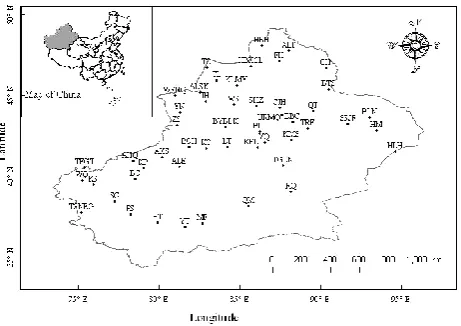
A daily precipitation dataset from 55 stations across Xin-jiang from 1961–2008 was provided by the National Cli-matic Centre of China, China Meteorological Administra-tion. This institution performed quality control of the dataset before its release in addition to homogeneous detection for the dataset (e.g., Feng et al., 2004; Li and Yan, 2009). Sta-tions with missing precipitation data of more than one year were excluded from the dataset; consequently daily precip-itation data from 51 meteorological stations were analysed. Figure 1 shows locations of these 51 stations. Meteorologi-cal stations are located in oasis areas. Since there are more oases in the north than the south, the number of stations fol-lows accordingly. Because the distribution of stations is not uniform, alternative analysis methods are used (Sect. 5) to ensure that key results are not biased by this distribution.
Y. Zhang et al.: Changes in annual maximum number of consecutive dry and wet days 1355
11 Figure 1
Fig. 1. Study area and location of meteorological stations.
3.2 Indices selected
First, it is useful to consider the following trends in simple statistics of the precipitation series: the daily mean with at least 0.05 mm of precipitation, the number of wet days per year, and the number of dry days per year. Analysis of CDD and CWD could be performed using different rainfall thresh-olds for a dry/wet day, such as less/more than or equal to 0.05 mm, 0.1 mm, 1.0 mm, 10 mm, etc. (Kutiel, 1985). In this study, CDD and CWD were evaluated using a definition with consideration of the arid climate in Xinjiang. The an-nual maximum consecutive dry or wet days (CDD/CWD) are defined as the greatest number of consecutive days with daily precipitation<0.05 mm d−1or>0.05 mm d−1, respectively.
Dry index (DI) is defined as DI=kTs
Ps ,
whereTsis the average summer temperature (June, July,
Au-gust),Ps is summer precipitation total, andk=17.5 is
con-stant. This index is from Introduction to Climate, Ecology and Environment in Northwest China (Ding et al., 2001), and reflects drought conditions in arid areas.
3.3 Distributions of extreme value
The theory of extreme value statistics states that the largest ofmindependent observations from a fixed distribution ap-proaches a known distribution asmincreases, regardless of the distribution from which the observations came (Coles, 2001). This is known as the extremal types theorem, which is analogous to the central limit theorem. The theory and ap-proaches are applicable to distributions of extreme minima by analysing the variableX(Embrechts et al., 1997).
The cumulative distribution function (CDF) of the gener-alised extreme value (GEV) is
F (x)=exp{−[1+κ(x−ς )
β ]
1/κ}. (1)
Now, ς,β andκ are the location, scale and shape parame-ters, respectively. Because the moments of the GEV involve the gamma function, estimation of GEV parameters using the method of moments is no more convenient than the alterna-tive method of maximum likelihood that is frequent in hy-drologic applications. Maximum likelihood methods can be easily adapted to include effects of covariates, or additional influences (Saralees and Choi, 2007). For moderate and large sample sizes, results of the two parameter estimation meth-ods are usually similar. Based on Eq. (1), the return period
XT can be computed as
XT =ς−
β
κ{1− [−log(1−
1
T)]
−κ}, κ6=0, (2)
XT =ς−β{log[−log(1−
1
T)]}, κ=0. (3)
The generalised Pareto distribution (GPD) is essentially a simple primitive distribution model (Ding et al., 2008), which is specifically designed to describe probability fea-tures of the whole observation dataset beyond a given critical value (threshold).
The distribution function of GPD is
F (x)=1− [1−κ(x−β1
α1
)]κ1, κ >0, β1≤x≤β1 (4)
+β1
κ or κ <0, β1≤x <∞,
F (x)=1− [1−κ(x−β1
α1
)]κ1, κ=0. (5)
whereβ1denotes the threshold,α1the scale parameter andκ the shape parameter (linear type). Ify=x−β1denotes val-ues of the variableXabove the thresholdβ1, we may rewrite the distribution function as λx=λt[1−F (x)].. It is seen
from Eq. (3.13) that forλx=λt[1−F (x)]., the GPD can be
simplified to a logarithmic distribution (Coles, 2001; Katz et a1., 2005).
Based on Eq. (4), the return periodXT can be computed
as
XT =β1+
α1
κ [1−(λT )
−κ], κ6=0. (6)
Based on Eq. (5), the return periodXT can be computed as
XT =β1+α1(I nλT ), κ=0. (7)
whereλdenotes the yearly mean crossing rate,β1the given threshold, α1 the scale parameter and κ the shape parame-ter (to denote the distribution curve type). Then, the related GPD model and its quantile can be found by obtaining GPD parameters using the given estimation method.
3.4 Estimation of parameters using maximum likelihood method
1356 Y. Zhang et al.: Changes in annual maximum number of consecutive dry and wet days
12 Figure 2
Fig. 2. Comparison of fit lines from Gumbel, GEV and GPD
mod-els.
and Choi, 2007). A much better approach to parameter fit-ting for the three distributions is the method of maximum likelihood. For many distributions, maximum likelihood fit-ting requires an iterative procedure that is only practical with a computer (Wilks, 2006). Supposingx1,· · ·, xn denote
an-nual maximum numbers of consecutive dry days for given
nyears, the method of maximum likelihood was used to fit these data. Assuming data independence, the likelihood is the product of the densities of Eq. (1) for the observations
x1,· · ·, xn, i.e.,
L(ς, β, κ)= 1
βn5
ni=1 (
1=κ(x1−ς )
β
1−κ1)
(8)
×exp (
−1+κ(x1−ς )
β 1
κ )
.
The estimates ofς, β andβ, say ς, β andκ, are taken as values that maximize the likelihood. This maximization was done by a quasi-Newton iterative algorithm. Standard errors of the estimates were computed by inverting the Fisher information matrix (Prescott and Walden, 1980).
4 Results and discussion
The CDD and CWD time series were assessed using daily precipitation data from 51 meteorological stations provided by the China National Meteorological Service, for the period 1961–2008. First, we compared the performances of GPD, GEV and Gumbel distribution functions; results are shown in Fig. 2. This figure indicates that the GEV is the best choice, followed by the Gumbel and GPD. Therefore, we chose GEV as the basic distribution function and calculated CDD and CWD values for different return periods. Parameters
13
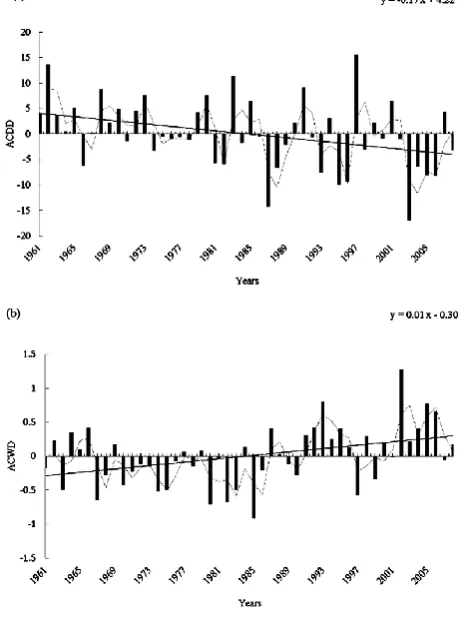
Note: ACDD (Anomaly of annual maximum consecutive dry days ) and ACWD ( Anomaly of annual maximum consecutive wet days )
Figure 3
Fig. 3. Changes of CWD and CDD anomalies over Xinjiang from
1961 to 2008: (a) Anomalies of CDD; (b) anomalies of CWD. Note: ACDD (Anomaly of annual maximum consecutive dry days) and ACWD (Anomaly of annual maximum consecutive wet days).
of the Gumbel, GEV and GPD distributions were estimated by using the maximum likelihood method. Goodness-of-fit is tested using the Kolmogorov-Smirnov statistic test (K-S), correlation coefficient (R), and mean square error (MSE) (Ding et al., 2008; Hosking, 1990). Results are displayed in Table 1. Table 1 shows that the GEV distribution is su-perior to Gumbel and GPD. Thus, both Table 1 and Fig. 2 indicate that GEV is the optimal choice. The parameters of GEV areς=58.56,β=6.87 andκ= −0.30 for CDD, and
ς=4.50,β=0.41 andκ= −0.18 for CWD. The return pe-riods of CDD and CWD are shown in Table 2. Now, we use the GEV statistical distribution function to fit the out-put of CDD/CWD for different return periods and map spa-tiotemporal distributions of CDD and CWD for different re-turn periods, using all data from the selected 51 stations. The drought and flood situation of the Xinxiang region in the next 5 yr, 10 yr, 20 yr, 30 yr, 50 yr and 100 yr is then discussed.
Y. Zhang et al.: Changes in annual maximum number of consecutive dry and wet days 1357
14 74° E 76° E 78° E 80° E 82° E 84° E 86° E 88° E 90° E 92° E 94° E 96° E
34° N 36° N 38° N 40° N 42° N 44° N 46° N 48° N 50° N
60 80 100 120 140 160 180 200 220 240 260 280 300 320 340 360
a
74° E 76° E 78° E 80° E 82° E 84° E 86° E 88° E 90° E 92° E 94° E 96° E
b
34° N 36° N 38° N 40° N 42° N 44° N 46° N 48° N 50° N
0 5 10 15 20 25 30
74° E 76° E 78° E 80° E 82° E 84° E 86° E 88° E 90° E 92° E 94° E 96° E 34° N
36° N 38° N 40° N 42° N 44° N 46° N 48° N 50° N
15 25 35 45 55 65 75 85 95 105 115 125 135
c
74° E 76° E 78° E 80° E 82° E 84° E 86° E 88° E 90° E 92° E 94° E 96° E 34° N
36° N 38° N 40° N 42° N 44° N 46° N 48° N 50° N
2 3 4 5 6 7 8 9 10
d
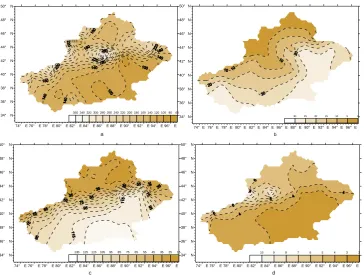
Figure 4
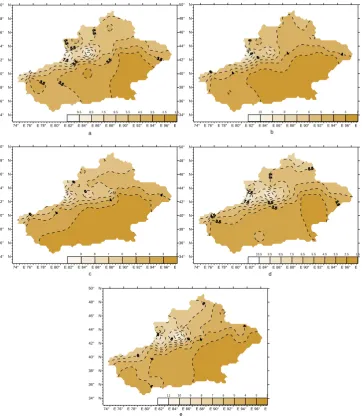
Fig. 4. Comparison of spatial distribution fits for (a) average annual precipitation, (b) drought index, (c) average CDD and (d) average CWD.
Table 1. Comparison of fits from GEV, Gumbel and GPD models.
stations GEV Gumbel GPD
K-S MSE R N K-S MSE R N K-S MSE R N
Xinjiang 0.05 0.01 0.99 51 0.14 0.03 0.99 51 0.23 0.14 0.98 51
4.1 Spatial distributions of CDD and CWD
To evaluate annual CDD and CWD trends, one may examine the temporal variability of mean annual anomalies of CDD and CWD (Fig. 3). Figure 3a shows that CDD decreases at a linear rate of 1.7 d per 10 a, with an unprecedented decline beginning in the mid-1980s. This demonstrates that consec-utive dry days in Xinjiang decreased constantly, explaining the decrease of drought disasters there. Figure 3b shows that CWD increased at a rate of 0.10 d per 10a. After 1988, the average CWD anomaly in most years was positive; there was a general increase before that year and a faster increase after-ward. By analysing CDD and CWD variations, we conclude that there was a regime shift from drought to wet in 1988. Shi et al. (2002) reported an increasing trend of annual mean rainfall in these regions.
Xinjiang is characterised by a great variation in geomor-phologic features and is mainly composed of a large desert in the middle and by mountains elsewhere. Figure 4 was created with GIS technology and the kriging interpolation
1358 Y. Zhang et al.: Changes in annual maximum number of consecutive dry and wet days
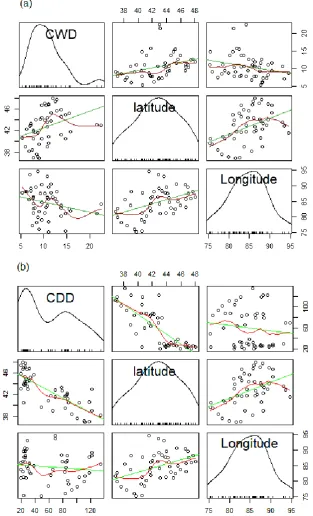
15 Figure 5
15 Figure 5
Fig. 5. Scatter plots of (a) CWD and longitude-latitude, (b) CDD and longitude-latitude.
from southeast to northwest, reflecting the precipitation and drought-wet distributions across the region. Xinjiang is a drought area, with extremely scarce precipitation and rare heavy rainfall. Continuously heavy rainfall causes disasters, e.g., floods, landslides, large areas of soil erosion and oth-ers. If a continuous frequency distribution of heavy precip-itation can be effectively estimated, then disasters and
dam-ages can be mitigated. Figure 4b shows the spatial pattern of annual drought index. This figure shows that this index declines gradually from southeast to northwest. The greater the drought index, the more serious the drought. The mean drought index can estimate the drought condition well and is principally used for climatic zoning. However, it does not reflect the frequency of regional drought. The spatial
Y. Zhang et al.: Changes in annual maximum number of consecutive dry and wet days 1359
16 74° E 76° E 78° E 80° E 82° E 84° E 86° E 88° E 90° E 92° E 94° E 96° E
34° N 36° N 38° N 40° N 42° N 44° N 46° N 48° N 50° N
20 30 40 50 60 70 80 90 100 110 120 130 140
a
74° E 76° E 78° E 80° E 82° E 84° E 86° E 88° E 90° E 92° E 94° E 96° E 34° N
36° N 38° N 40° N 42° N 44° N 46° N 48° N 50° N
20 30 40 50 60 70 80 90 100 110 120 130 140
b
74° E 76° E 78° E 80° E 82° E 84° E 86° E 88° E 90° E 92° E 94° E 96° E 34° N
36° N 38° N 40° N 42° N 44° N 46° N 48° N 50° N
15 25 35 45 55 65 75 85 95 105 115 125 135
c
74° E 76° E 78° E 80° E 82° E 84° E 86° E 88° E 90° E 92° E 94° E 96° E 34° N
36° N 38° N 40° N 42° N 44° N 46° N 48° N 50° N
15 25 35 45 55 65 75 85 95 105 115 125 135
d
74° E 76° E 78° E 80° E 82° E 84° E 86° E 88° E 90° E 92° E 94° E 96° E 34° N
36° N 38° N 40° N 42° N 44° N 46° N 48° N 50° N
15 25 35 45 55 65 75 85 95 105 115 125 135
e
Figure 6
Fig. 6. Spatial distribution of decadal average CDD in Xinjiang: (a) 1961–1970; (b) 1971–1980; (c) 1981–1990; (d) 1991–2000;
(e) 2000–2008.
Table 2. Return level estimates for T = 10, 20, 50, 100 over all Xinjiang.
GEV distribution Return level (95% confidence interval) T = 5 T = 10 T = 20 T = 30 T = 50 T = 100
MCDD 66.85 69.79 72.05 73.14 74.33 75.67
MCWD 5.04 5.26 5.44 5.54 5.65 5.78
Note: MCDD (maximum consecutive dry days) and MCWD (maximum consecutive wet days).
distribution of mean annual CDD (Fig. 4c) over the study period reveals that the longest CDD were in the Taklimakan and Turban basins of southeast Xinjiang, while the shortest CDD were in the Tianshan Mountains and Ili river valley of
1360 Y. Zhang et al.: Changes in annual maximum number of consecutive dry and wet days
17 74° E 76° E 78° E 80° E 82° E 84° E 86° E 88° E 90° E 92° E 94° E 96° E
34° N 36° N 38° N 40° N 42° N 44° N 46° N 48° N 50° N
1.5 2.5 3.5 4.5 5.5 6.5 7.5 8.5 9.5
a
74° E 76° E 78° E 80° E 82° E 84° E 86° E 88° E 90° E 92° E 94° E 96° E 34° N
36° N 38° N 40° N 42° N 44° N 46° N 48° N 50° N
2 3 4 5 6 7 8 9 10
b
74° E 76° E 78° E 80° E 82° E 84° E 86° E 88° E 90° E 92° E 94° E 96° E 34° N
36° N 38° N 40° N 42° N 44° N 46° N 48° N 50° N
2 3 4 5 6 7 8 9
c
74° E 76° E 78° E 80° E 82° E 84° E 86° E 88° E 90° E 92° E 94° E 96° E 34° N
36° N 38° N 40° N 42° N 44° N 46° N 48° N 50° N
1.5 2.5 3.5 4.5 5.5 6.5 7.5 8.5 9.5 10.5
d
74° E 76° E 78° E 80° E 82° E 84° E 86° E 88° E 90° E 92° E 94° E 96° E 34° N
36° N 38° N 40° N 42° N 44° N 46° N 48° N 50° N
2 3 4 5 6 7 8 9 10 11
e
Figure 7
Fig. 7. Spatial and temporal distribution of decadal average CWD in Xinjiang: (a) 1961–1970; (b) 1971–1980; (c) 1981–1990;
(d) 1991–2000; (e) 2000–2008.
There is positive correlation between CDD and longitude, and negative correlation between CWD and latitude. In the Taklimakan and Turban basins, actual precipitation is scarce and average CDD is greater. In the Tianshan Mountains and Ili river valley, actual precipitation is greater and CDD smaller. CDD as an extreme value has the advantage of producing statistics of annual maximum continuous drought days, which cannot be represented by the drought index. Drought forms when precipitation is lacking for a long pe-riod, therefore, CDD as continuous dry days (and not CCD) may indicate drought occurrence.
Maps of CDD spatiotemporal distribution in different pe-riods from 1961 to 2008 were made using the same inter-polation method. Figure 6a–e represents decadal averages from 1961 to 2008, respectively. Figure 6a shows that CDD
declined gradually from southeast to northwest. This indi-cates that in the period 1961–1970, there were more than four months (120 days) without precipitation in the south-east, while in the northwest the average CDD was less than forty days. Figure 6b shows that CDD in the southeast were greater than in the northwest. It also shows that CDD in the southeast from 1971–1980 (Fig. 6b) exceeded that from 1961–1970 (Fig. 6a). This explains why droughts from 1971–1980 were more serious than those from 1961– 1970. Figure 6c shows the CDD distribution from 1981– 1990. From this figure, we see that CDD changed greatly compared to 1971–1980. Generally, average CDD in the southeast and northwest were less than 135 and 35 days, re-spectively. Figure 6b indicates that CDD in the southeast and northwest were less than 140 and 40 days, respectively. This
Y. Zhang et al.: Changes in annual maximum number of consecutive dry and wet days 1361
18 74° E 76° E 78° E 80° E 82° E 84° E 86° E 88° E 90° E 92° E 94° E 96° E
34° N 36° N 38° N 40° N 42° N 44° N 46° N 48° N 50° N 20 30 40 50 60 70 80 90 100 110 120 130 140 150 160 a
74° E 76° E 78° E 80° E 82° E 84° E 86° E 88° E 90° E 92° E 94° E 96° E 34° N 36° N 38° N 40° N 42° N 44° N 46° N 48° N 50° N 20 30 40 50 60 70 80 90 100 110 120 130 140 150 160 170 180 b
74° E 76° E 78° E 80° E 82° E 84° E 86° E 88° E 90° E 92° E 94° E 96° E 34° N 36° N 38° N 40° N 42° N 44° N 46° N 48° N 50° N 20 30 40 50 60 70 80 90 100 110 120 130 140 150 160 170 180 190 c
74° E 76° E 78° E 80° E 82° E 84° E 86° E 88° E 90° E 92° E 94° E 96° E 34° N 36° N 38° N 40° N 42° N 44° N 46° N 48° N 50° N 20 30 40 50 60 70 80 90 100 110 120 130 140 150 160 170 180 190 d
74° E 76° E 78° E 80° E 82° E 84° E 86° E 88° E 90° E 92° E 94° E 96° E 34° N 36° N 38° N 40° N 42° N 44° N 46° N 48° N 50° N 20 30 40 50 60 70 80 90 100 110 120 130 140 150 160 170 180 190 e
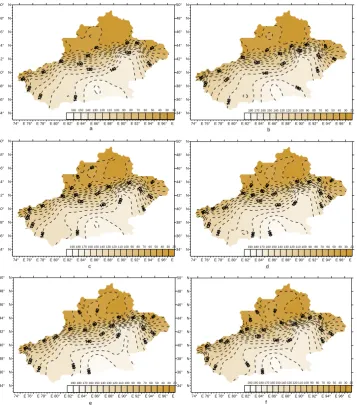
74° E 76° E 78° E 80° E 82° E 84° E 86° E 88° E 90° E 92° E 94° E 96° E 34° N 36° N 38° N 40° N 42° N 44° N 46° N 48° N 50° N 20 30 40 50 60 70 80 90 100 110 120 130 140 150 160 170 180 190 200 f Figure 8
Fig. 8. Spatiotemporal distribution of the estimated CDD in Xinjiang for various recurrence intervals: (a) 5 yr; (b) 10 yr; (c) 20 yr; (d) 30 yr; (e) 50 yr; (f) 100 yr.
indicates that from 1981–1990, drought conditions relaxed. Figure 4d shows a decrease of CDD compared to Fig. 6c. However, a different state is evidenced in Fig. 6e, in which CDD from 2001–2008 shows a slight increase.
Figure 7 shows spatiotemporal distributions of CWD time series from 1961–1970, 1971–1980, 1981–1990, 1991–2000 and 2001–2008. Figure 7a indicates that drought in the southeast was more serious than in the northwest. Rainfall and CWD in the southeast were less than in the northwest, indicating a positive correlation between CWD and precip-itation. Figure 7a clearly shows that CWD in the southeast was less than 4 days, while in the northwest it was more than 6 days. Figure 7b also shows that CWD in the southeast was less than in the northwest and the area with CWD>4 days accounts for half the Xinjiang region. Figure 7c shows that the area with CWD>4 days also exceeds half of the region.
Figure 7d–e shows that areas with CDD>4 days increased. This areal enlargement may indicate that the Xinjiang region is becoming wet.
4.2 Extreme wet and dry periods in the future
1362 Y. Zhang et al.: Changes in annual maximum number of consecutive dry and wet days
19 74° E 76° E 78° E 80° E 82° E 84° E 86° E 88° E 90° E 92° E 94° E 96° E
34° N 36° N 38° N 40° N 42° N 44° N 46° N 48° N 50° N 3 4 5 6 7 8 9 10 11 12 13 a
74° E 76° E 78° E 80° E 82° E 84° E 86° E 88° E 90° E 92° E 94° E 96° E 34° N 36° N 38° N 40° N 42° N 44° N 46° N 48° N 50° N 4 5 6 7 8 9 10 11 12 13 14 15 16 17 18 b
74° E 76° E 78° E 80° E 82° E 84° E 86° E 88° E 90° E 92° E 94° E 96° E 34° N 36° N 38° N 40° N 42° N 44° N 46° N 48° N 50° N 5 7 9 11 13 15 17 19 21 23 c
74° E 76° E 78° E 80° E 82° E 84° E 86° E 88° E 90° E 92° E 94° E 96° E 34° N 36° N 38° N 40° N 42° N 44° N 46° N 48° N 50° N 6 8 10 12 14 16 18 20 22 24 26 28 d
74° E 76° E 78° E 80° E 82° E 84° E 86° E 88° E 90° E 92° E 94° E 96° E 34° N 36° N 38° N 40° N 42° N 44° N 46° N 48° N 50° N 7 9 11 13 15 17 19 21 23 25 27 29 31 33 35 e
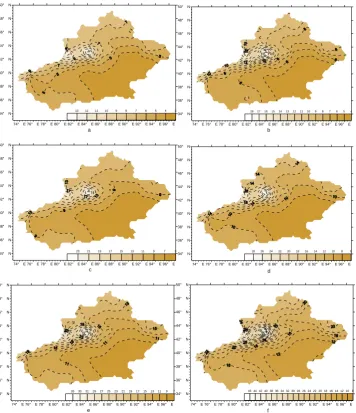
74° E 76° E 78° E 80° E 82° E 84° E 86° E 88° E 90° E 92° E 94° E 96° E 34° N 36° N 38° N 40° N 42° N 44° N 46° N 48° N 50° N 8 10 12 14 16 18 20 22 24 26 28 30 32 34 36 38 40 42 44 46 f Figure 9
Fig. 9. Spatiotemporal distribution of estimated CWD over Xinjiang for various recurrence intervals: (a) 5 yr; (b) 10 yr; (c) 20 yr; (d) 30 yr; (e) 50 yr; (f) 100 yr.
index distribution. It also shows an increasing trend of CDD
>140 days in the southeast, suggesting that drought risk in these areas will increase. Figure 8b shows the spatiotemporal distribution of CDD for the 10-yr return period. Comparing Fig. 8b and a, we found that the probability of CDD in excess of 140 days in the southeast for the 10-yr return period ex-ceeds that for the 5-yr return period. This demonstrates that the drought risk of CDD for the 10-yr return period exceeds that for the 5-yr return period. It also shows that decadal variability of the drought risk coefficient is closely related to the selected time span. Figure 8c shows CDD for the 20-year return period. By comparing Fig. 8b and c, we find that the frequency of CDD of more than 140 days for the 20-yr re-turn period is relatively high in the southeast. An increase in drought risk during the 20-yr return period is evident.
Fig-ure 8d shows spatial distributions of CDD for the 30-yr re-turn period. By comparing Figs. 8d and c, we clearly see that the rate of CDD>140 day expansion slows, whereas that of CDD>180 days becomes faster in the southeast. It is evident that areas with CDD>180 days are drought-prone, so more effort should be made for drought precautions. Figure 8e–f shows CDD spatial distributions for 50-yr and 100-yr return periods. These figures indicate a slow expansion of CDD
>180 days in the southeast.
Figure 9 was constructed using GIS technology and the In-verse Distance Weighted (IDW) interpolation method. Fig-ure 9a shows the CWD distribution for the 5-yr return pe-riod. A wetting trend in Xinjiang is indicated by compari-son of Fig. 9a and 6e. This is similar to Shi et al. (2002), which reports an increasing trend in mean annual rainfall in
Y. Zhang et al.: Changes in annual maximum number of consecutive dry and wet days 1363
the Xinjiang region. The CWD distribution for the 10-yr re-turn period is shown in Fig. 9b. Comparison of Fig. 9b and a reveals that the probability of CWD greater than 10 days for the 10-year return period exceeds that for the 5-year return period in the northwest. Figure 9c shows the CWD spatial distribution for the 20-yr return period. It shows that the area with CWD >10 days is about one third that of Xin-jiang. Figure 9d illustrates the CWD distribution for a 30-yr return period. From Fig. 9d, we find that the area with CWD
>10 days covers half the Xinjiang region. Figure 9e and f shows CWD distributions for a 50-yr and 100-yr return pe-riod, respectively. A flood risk increase in future decades is evident.
5 Conclusions
In this study, we applied the GEV statistical distribution function to fit the output of CDD/CWD with different re-turn periods to diagnose dry/wet environmental variability and spatial patterns in Xinjiang, a drought-susceptible region in northwest China. Interesting results were obtained, as fol-lows:
1. The dry/wet environment in Xinjiang has altered markedly. Aridity in Xinjiang has decreased promi-nently. CDD decreased at a rate of 1.7d/10a, while CWD increased at a relatively smaller rate of 0.1d/10a. This situation accords with the view that the climate of Xinjiang has been changing from warm-dry to warm-wet in recent years.
2. The findings indicate that mean annual CDD max-imized in the southeast, while minima were in the northwest. On the contrary, the longest mean annual CWD were in the west and northwest, whereas the shortest were in the east.
3. Spatiotemporal patterns of CDD/CWD indicate that dry/wet conditions in Xinjiang may be well represented by the return periods of CDD/CWD. The indexes were successfully applied to reflect drought and flood regimes in the region. Comparative analysis of CWD and CDD can depict drought and flood regimes in Xinjiang. Using specific numerical targets, regions suffering from drought or flood can be detected. From analysing CDD and CWD in future 5 a, 10 a, 20 a, 30 a, 50 a and 100 a periods, we conclude that flood risk will gradually increase, and drought risk will decrease.
4. CDD/CWD as indicators of drought and flood were used to expect shorter dry periods and longer wet peri-ods. Recently, much domestic climate change research has only addressed extreme precipitation, temperature,
aridity index (exponent) and others. However, research on the index of extreme precipitation, especially annual maximum numbers of consecutive dry/wet days as in this paper, has been sparse. The indexes were success-fully used here to portray drought and flood regimes in Xinjiang. The results are important in forming regional adaptation strategies against global warming.
Acknowledgements. The research presented in this article was jointly funded by the Knowledge Innovation key Project of Chinese Academy of Sciences (Grant No.: KZCX2-YW-GJ04); the “West-ern Light” Project (RCPY200902) of the Chinese Academy of Sciences; and the National Natural Science Foundation (41071072) of Xinjiang Institute of Ecology. The authors thank their colleagues for continuing support and discussion around the coffee breaks. Thanks are extended to Robin Crockett and another referee for assisting in evaluating this paper. The authors would like to thank the reviewers for their invaluable suggestions.
Edited by: R. Crockett
Reviewed by: two anonymous referees
References
Bordi, I. I., Fraedrich, K., Petitta, M., and Sutera, A.: Extreme value analysis of wet and dry periods in Sicily, Theor. Appl. Climatol., 87, 61–71, 2007.
Chen Xiru: An introduction to Mathematical statistics. Science Press, China, 1981.
Colombo, A., Etkin, D., and Karney, B.: Climate variability and the frequency of extreme temperature events for nine sites across Canada: implications for power usage, J. Climate, 12, 2490– 2502, 1999.
Coles, S.: An Introduction to Statistical Modeling of Extreme Val-ues, Springer Verlag, London, UK, 2001.
Cressie, N. A. C.: Statistics for Spatial Data, John Wiley and Sons, Inc., New York, 900 pp., 1991.
Ding, Y. and Wang S.: Introduction to Climate, Ecology and Envi-ronment in Northwest China, Meteorological Press, China, 2001. Ding, Y., Cheng, B., and Jiang, Z.: A Newly-Discovered GPD-GEV Relationship Together with Comparing Their Models of Extreme Precipitation in summer, Adv. Atmos. Sci., 25, 507–516, 2008. Easterling, D. R., Evans, J. L., Groisman, P. Y., Karl, T. R., Kunkel,
K. E., and Ambenje, P.: Observed Variability and Trends in Ex-treme Climate Events: A Brief Review, B. Am. Meteorol. Soc., 81, 417–425, 2000.
Embrechts, P., Kl¨uppelberg, C., and Mikosch, T.: Modelling Ex-tremal Events for Insurance and Finance, New York, Springer, 655 pp., 1997.
Feng, S., Hu, Q., and Qian, W. H.: Quality Control of Daily Me-teorological Data in China, 1951–2000: A New Dataset, Int. J. Climatol., 24, 853—870, 2004.
Fisher, R. A. and Tippett, L. H. C.: Limiting forms of the frequency distributions of the largest or smallest member of a sample, Pro-ceedings of the Cambridge Philosophical Society, 24, 180–190, 1928.
1364 Y. Zhang et al.: Changes in annual maximum number of consecutive dry and wet days
change and climate variations, American meteorological society 83rd annual meeting, Long Beach, 9–13, 2003.
IPCC: Climate change 2001: impacts, adaptation, and vulnerabil-ity, in: Contribution of working group II to the third assessment report of the intergovernmental panel on climate change, edited by: McCarthy, J. J., Canziani, O. F., Leary, N. A., Dokken, D. J., White, K. S., Cambridge University Press, 1035 pp., Cambridge, 2001.
IPCC: Climate change 2007: impacts, adaptation, and vulnerability, in: Exit EPA disclaimer contribution of working group II to the third assessment report of the intergovernmental panel on climate change, edited by: Parry, M. L., Canziani, O. F., Palutikof, J. P., van der Linden, P. J., Hanson, C. E., Cambridge University Press, Cambridge, 976pp., 2007.
Jenkinson, A. F.: The frequency distribution of the annual maxi-mum (or minimaxi-mum) of meteorological elements, Quart. J. Roy. Meteorol. Soc., 81, 158–171, 1955.
Jiang, F. and Yang, Y.: Potential links of Flood and Drought Dis-aters in Xinjiang to some Larger-scale Climatic Driving Forces, Arid Land Geography. Soc. China, 27, 148–153, 2004a. Jiang, F., Hu, R., and Yang, Y.: Abrupt Change in the Time
Se-quences of Flood Disasters in Xinjiang and Its Possible Climatic Reasons, J. Glaciol. Geocryol., 26, 674–681, 2004b.
Jiang, F., Li, X., Wei, B., Hu, R., and Li, Z.: Observed trends of heating and cooling degree-days in Xinjiang Province, China, Theor. Appl. Climatol., 97, 349–360, 2009.
Jiang, F., Zhu, C., Mu, G., and Hu, R.: Recent Magnification of Flood and Drought Calamities in Xinjiang: An Analysis of An-thropogenefic Effects, Acta Geographica Sinica. Soc. China, 57, 57–66, 2002a.
Jiang, F., Zhu, C., and Hu, R.: Statistical and fractal features of the flood and drought disasters in Xinjiang from 1950 to 1997, J. Nat. Disasters, 11, 96–100, 2002b.
Jiang, F., Zhu, C., Mu, G., Hu, R., and Meng, Q.: Magnification of Flood Disasters and its relation to regional precipitation since the 1980s in Xinjiang, North-western China, Nat. Hazards, 36, 307–330, 2005.
Journel, A. G. and Huijbregts, C.: Mining Geostatistics, Academic Press, USA, 600pp., 1978.
Katz, R. W., Brush, G. S., and Parlange, M. B.: Statistics of ex-tremes: Modeling ecological disturbance, Ecology, 86, 1124– 1134, 2005.
Karl, T., Knight, R., Easterling, D. and Quayle, R.: Indices of cli-mate change for the United States, B. Am. Meteorol. Soc., 77, 279–292, 1996.
Kharin, V. and Zwiers, F.: Changes in the Extremes in an Ensemble of Transient Climate Simulations with a Coupled Atmosphere Ocean GCM, J. Climate, 13, 3760–3788, 2000.
Kutiel, H.: The multimodality of the rainfall course in Israel as re-flected by the distribution of dry spells, Meteorol. Atmos. Phys., 39, 15–27, 1985.
Li, X., Jiang, F., Li, L., and Wang G.: Spatial and temporal vari-ability of precipitation concentration index, concentration degree and concentration period in Xinjiang, China, Int. J. Climatol., 31, 1679–1693, 2010.
Li, Z. and Yan, Z.: Homogenized Daily Mean/Maximum/Minimum Temperature Series for China from 1960–2008, Atmos. Ocean. Sci. Lett., 2, 1–7, 2009.
Ma, Z., Huang, G., Gan, W., and Chen, M.: Multi-scale temporal characteristics of the dryness/wetness over northern China during the last century. Chinese Journal of Atmospheric Sciences. Soc. China, 29, 671–681, 2005.
Nastos, P. T. and Zerefos, C. S.: On extreme daily precip-itation totals at Athens, Greece, Adv. Geosci., 10, 59–66, doi:10.5194/adgeo-10-59-2007, 2007.
Nastos, P. T. and Zerefos, C. S.: Decadal changes in ex-treme daily precipitation in Greece, Adv. Geosci., 16, 55–62, doi:10.5194/adgeo-16-55-2008, 2008.
Prescott, P. and Walden, A. T.: Maximum likehood estimation of parameters of the generalised extreme value distribution, Biometrika, 67, 723–724, 1980.
Qiang, Z., Chongyu, X., Becker, S., Zengxin, Z., Yongqin, D. C., and Coulibaly, M.: Trends and abrupt changes of precipitation extremes in the Pearl River basin, China. Atmos. Sci. Lett., 10, 132–144, 2009.
Qiang, Z., Chongyu, X., Xiaohong, C., and Zengxin, Z.: Statistical behaviours of precipitation regimes in China and their links with atmospheric circulation 1960–2005. Int. J. Climatol., 31, 1665– 1678, 2010a.
Schiermeier, Q.: Increased flood risk linked to global warming, Na-ture, 470, 316, 2011.
Saralees, N. and Choi, D.: Maximum daily rainfall in South Korea, J. Earth Syst. Sci., 116, 311–320, 2007.
Shi, Y.: An Assessment of the issues of Climate Shift from Warm-dry to Warm-Wet in Northwest China, China Meteorological Press, 2003.
Shi, Y., Shen, Y., and Hu, R.: Preliminary study on signal, im-pact and foreground of climatic shift from warm dry to warm-humid in Northwest China. Journal of Glaciology and Geocryol-ogy, Soc. China, 24, 219–226, 2002.
Shi, Y., Shen, Y., Li, D., Zhang, G., Ding, Y., Hu, R., and Kang, E.: Discussion on the present climate change from warm- dry to warm-wet in Northwest China, Quaternary Sci. Soc. China, 23, 152–164, 2003.
STARDEX: STAtistical and Regional dynamical Downscaling of EXtremes for european regions, EVK2-CT-2001-00115, 5th Framework European programme project http://www.cru.uea.ac. uk/cru/projects/stardex/(2002–2005).
Su, H., Shen, Y., Han, P., Li, J., and Lan, Y.: Precipitation and Its Impact on Water Resources and Ecological Environment in Xinjiang Region, J. Glaciol. Geocryol. Soc. China, 29, 343–349, 2007.
Hosking, J. R. M., Wallis, J. R., and Wood, E. F.: Estimation of the generalised Extreme value distribution by the method of Probability-Weighted Moments, Technimetrics, 27, 251–261, 1985.
Wilks, D. S.: Statistical Methods in the Atmospheric Sciences, Aca-demic Press, USA, 2005.
Xiao, Y.: Multivariate Hydrological Analysis and Estimation Meth-ods Based on Copula Function, China, Thesises, 2007.
Xie, Z., Du, Y., Jiang, A., and Ding, Y.: Climatic trends of differ-ent intensity heavy precipitation evdiffer-ents concdiffer-entration in China, J. Geogr. Sci. Soc. China, 4, 459–466, 2005.
Xu, G.: Global climate warm up bring what on Sinkiang economic construction and sustainable development?, Xinjiang Weather. Soc. China, 20, 1–3, 1997.
Y. Zhang et al.: Changes in annual maximum number of consecutive dry and wet days 1365
Xu, J., Chen, Y., Ji, M., and Lu, F.: Climate change and its effects on runoff of Kaidu River, Xinjiang, China: a multiple time-scale analysis, Chinese Geographical Sci. Soc. China, 18, 331–339, 2008.
Yang, L.: Cliamte change of extreme precipitation in Xin-jiang,China, Acta Geographica Sinica. Soc. China, 58, 577–583, 2003.
Zhang, Q., Tao, J., Yongqin, D. C., and Chen, X.: Changing proper-ties of hydrological extremes in south China: natural variations or human influences?, Hydrol. Process., 24, 1421–1432, 2010.
Zhang, Q., Xu, C., Marco, G., and Yongqin, D. C.: Changing properties of precipitation concentration in the Pearl River basin, China, Stochastic Environmental Research and Risk Assessment, 23, 377–385, 2009a.
Zhang, Q., Xu, C., Zhang, Z., Yongqin D. C., and Liu, C.: Spatial and temporal variability of precipitation maxima during 1960– 2005 in the Yangtze River basin and possible association with large-scale circulation, J. Hydrol., 353, 215–227, 2008. Zhang, Q., Xu, C., and Zhang, Z.: Observed changes of