www.orientjchem.org
An International Open Free Access, Peer Reviewed Research Journal
2018, Vol. 34, No.(3): Pg. 1597-1603
This is an Open Access article licensed under a Creative Commons Attribution-Non Commercial-Share Alike 4.0 International License (https://creativecommons.org/licenses/by-nc-sa/4.0/), which permits unrestricted Non Commercial use, distribution and reproduction in any medium, provided the original work is properly cited.
Influence of Surface modified Graphene Oxide on Mechanical
and Thermal Properties of Epoxy Resin
PARUL MALIk
1, BHASHA
2and PURNIMA JAIN*
3Department of Chemistry, Netaji Subhas Institute of Technology, University of Delhi, New Delhi, India. *Corresponding author E-mail: parul.malik0909@gmail.com
http://dx.doi.org/10.13005/ojc/340353
(Received: March 31, 2018; Accepted: May 02, 2018)
ABSTRACT
The principal aim of this work is to investigate the mechanical and thermal properties of graphene oxide reinforced epoxy composites. Surface modification was carried out by 3-aminopropyltriethoxysilane (APTS) with aqueous solution method. Surface modified graphene oxide was mixed in epoxy matrix by sonication process and composites were prepared by compression moulding technique. Three different formats: graphene (G), graphene oxide (GO) and APTS graphene oxide (APTS-GO) were incorporated respectively in an epoxy matrix to form composites. The tensile and impact tests show that the surface modified graphene oxide reinforced epoxy composites gives better results than unmodified graphene oxide reinforced epoxy composites. Scanning electron microscope images revealed that the dispersion of the surface modified graphene oxide on epoxy matrix was better at high frequency sonication than unmodified graphene oxide on epoxy system. The thermal properties of composites were analysed by Differential Scanning Calorimetry (DSC).
keywords: Graphene, Graphene Oxide, APTS-GO, SEM, DSC.
INTROdUCTION
Epoxy resin is genetically brittle and this problem can be mitigated by the incorporation of nanoadditives. Although may successful attempts have been made for the development of novel nanocomposites for epoxy resins, however challenges still exist in selection of material and fulfil the potential to achieve a level of performance. So many researches have been conducted to brittle
epoxy using additive like block copolymer, rubbers, silicates, liquid crystals, clays, CNT, carbon fiber etc1-4. So, these entire additives generally reinforced
A single layer graphene is sp2- hybridized
carbon and two dimensional honeycomb lattice structures. It has attracted amazing growing attention in the past several years, As a result of its outstanding behaviour in optic, mechanical, thermal, electrical and other properties7. According, polymer
composites have various uses like adhesive, coating, electronic, automobile, aircraft, aerospace etc. Pure form of graphene and graphene oxide is not adaptable with either polymers or organic solvents and does not form comparable composites8-10. To improve
the distribution of graphene oxide in a polymer, reduction, oxidation and various functionalization of the carbonaceous surface is required. Graphene oxide has been mainly synthesised by the Hummer’s methods and modified hummer’s methods11-13.
The surface functional groups of Graphene oxide are carboxylic acids, alcohols, epoxides and other ketone groups. The percentage of these functional groups can vary significantly, depending on the initial material.
Polymer/graphene oxide nanocomposites obtain superior thermal, mechanical, morphological and electrical properties as compared to neat polymers, observed by Jiacheng Wei et al.,14.
Le et al.,15 in composition 0.5 wt% silane graphene
oxide/epoxy composites by bath sonication and mechanical mixing enhance 16% and 20% in tensile strength and elastic modulus as compared to neat epoxy. Equivalently, Rafiee et al.,16 recorded
a significant increment in Young’s modulus at 0.1 wt% of graphene/epoxy composites fabricated by sonication. Qi et al.,17 reported thermotropic liquid
crystalline epoxy functionalize graphene oxide and the assemble composites enhance 42.5% and 100% at 1 wt% in tensile strength and impact strength.
In this work, researcher investigates the surface functionalize graphene oxide with APTS (3-aminopropyltriethoxysilane) using aqueous solution method. The epoxy composites with Graphene, Graphene oxide (GO) and APTS graphene oxides (APTS-GO) were prepared. Researcher observed improved dispersion of APTS-GO in epoxy resin when compared to that of GO and Graphene prepared with similar process with epoxy resin. Moreover, the thermal and mechanical properties were measured and compared to further understand the role of APTS onto GO surface of composites.
ExPERIMENTAL
Material
Liqu+-eous epoxy resin (Diglycidyl ether of Bisphenol-A, Araldite, LY 556) and Triethyleneteramine (TETA) hardeners were obtained from Huntsman, Mumbai. Graphene was obtained from Avansa Technology, Kanpur, U.P., India. 3-aminopropyltriethoxysilane (APTS) was supplied by Sigma-Aldrich. 30% hydrogen peroxide (H2O2), acetone, sulphuric acid, potassium permanganate, sodium nitrate and other chemicals were purchased from Merck & Co., India.
Preparation of Graphene Oxide
For synthesis of graphene oxide modified Hummer’s method was used18. Graphene (3 g),
sodium nitrate (1.5 g) and 70 ml sulphuric acid were added in beaker on an ice bath. Gradually KMnO4 was added to maintaining the temperature under 20 oC for 1 hour. The mixture was kept on an ice bath
for 2 h, followed by keeping at room temperature for next 2 hours. Drop by drop deionized water was added when the mixture turned into a highly-viscous liquid, maintaining mixture temperature around 50 oC.
300 ml water and 10 ml hydrogen peroxide (30 wt% aqueous solutions) was added to for terminate the reaction. The mixture was centrifuged and washed by deionized water till pH become ~7. The product obtained was dried in a vacuum oven.
Preparation of Functionalized Graphene Oxide
Around 4g NaOH was added into GO solution (600 mg GO in 500 ml water) under stirring. After complete dissolve of NaOH, the mixture was refluxed at 80 oC for 3 h followed by centrifugation.
Preparation of Nanocomposites
Solutions of graphene, graphene oxide and APTS-GO in acetone were sonicated for 1 hour. Liquid epoxy was added in above filler/acetone solution and sonicated for one hour. When homogenous mixture was obtained, the mixture was stirred at 70 oC for 4 hours. The
mixtue solution was kept in a vacuum oven at 80 oC for till assure of complete removal of acetone.
Amine hardener (TETA) was mixed thoroughly for approximately 5 min., by mechanical stirring. The mixture was kept in vacuum oven to degas for 1 h and poured into silicon moulds for various specimen and cured at room temperature for 24 h and post curing for 8 h at 100 oC.
Characterization
T h e m e c h a n i c a l p r o p e r t i e s o f nanocomposites were measured on a universal testing machine (Zwick 010) with a 5kN load cell and tests were performed at 27 oC and 50% humidity and
dumbbell-shaped samples with crosshead speed of 2mm/minute. The at least five specimen were tested for each composite. Differential scanning calorimetric (Mettler Toledo, DSC instrument) analysis was carried out with a heating rate of 10 OC/min. in nitrogen (40 mL/minute). Field
emission scanning electron microscopy (FESEM) (SIGMA, CARL ZEISS, Germany) was used for surface morphology and fractographic study. Earlier to imaging the composite were coated with gold-palladium sputtering. Fourier transform infrared (FTIR) spectra were reported using a powder in KBr pellets using vertex 70V, Bruker Optik in the transmission mode. Raman spectra were recorded using STR 500 CONFOCAL MICRO RAMAN SPECTRO with 50x objective lens at room temperature, a 633 nm He-Ne laser beam.
RESULT ANd dISCUSSION
Characterization of Graphene, Graphene Oxide and APTS-GO
Figure 1 present FTIR spectra of graphene, graphene oxide and APTS-GO, show that there is a clear change in Graphene, GO and APTS-GO. Several absorption bands can be found for Graphene Oxide: an intense and broad band at 3450-3600 cm-1
attributed to O-H stretching vibration, at 1723 cm-1
band assigned to carboxyl groups or C=O stretching
of carbonyl, a band detect at 1620 cm-1 assigned to
un-oxidized graphitic domain and at 1401cm-1 and
1098 cm-1 band equivalent to in plane –COH bending
and epoxy C-O-C bond, respectively. These results confirm the successful preparation of Graphene Oxide (GO). Besides, an important peak appear in GO indicating the affluence hydroxyl, carboxyl and epoxy group which can act as active sites to implant functional molecules into the board of graphene oxide.
After salinization of APTS, new spectral features view in APTS-GO spectrum (Fig. 1). The band at 2920 and 2850 cm-1 are assigned to
stretching vibration of –CH2 groups, Stretching vibration of the –CO- group is attributed to an absorption band at 1720 cm-1. A strong band at
1075 cm-1 and 1395 are due to the stretching
vibration of SiO and SiCH2 bands, respectively. The band corresponding to the amine groups of the APTS units on the graphene sheets at 2830 cm-1, indicates
that amine group has been strongly imported into the surface of the graphene oxide. Usually, the characteristic peaks of hydrophilic group (eg –COOH and –OH) can be shown with high intensity, which show that the whole process of modification did not lead to the modification of the graphene oxide.
Raman spectroscopy is helpful to study the defect and disorder in structure of crystal and characterization study of graphene and derivatives of graphene. Intensity ratio between the disorder induced D band (Id) and Raman allowed G band (IG) is used to determine disorder. Fig. 2 presents Raman spectra of graphene, graphene oxide and APTS-GO. The G band is at 1597 cm-1, 1607 cm-1 and 1595
cm-1 and D band is at 1365 cm-1, 1364 cm-1 and
1355 cm-1 for Graphene, Graphene Oxide and
APTS-GO respectively. In graphene oxide D band is broadened arises to decreases in size of the sp2
domains by the formation of vacancies, distortion and defects during oxidation. For all sp2 carbon
from, G band is common and it due to C-C band stretch and make by first order Raman scattering. In graphene oxide spectrum, the G band is switch to higher wavenumber as a result oxygenation of graphene that leads to formation of sp3 carbon
to the graphene. In the APTS-GO, number of sp2
carbon atoms increases so G band shifted to lower wavenumber. During reduction D band intensity is lowered, but not enough as comparison to graphene and graphene oxide. The intensity ratio becomes 0.93 for APTS-GO which reveals that removal of almost all the functional groups consisting oxygen. The ratio of Id/IG in APTS-GO is higher than that of graphene oxide and graphene because of the newly formed sp2 domains during reduction process.
resin and its composites also exhibit brittle behaviour. Stress-strain curve of the epoxy composites obtained in tensile testing are shown in Fig. 3(A). Fig. 3(B) present tensile strength was varied with the filler contents. All composites show linear stress-stain character up to failure, without plastic deformation and all specimen exhibit similar curve shape. The results also show an increment in tensile strength and young’s modulus of composites as compared to neat epoxy. In other word, the dispersion of amine functionalized graphene oxide in epoxy resin show high reinforcement in the mechanical properties as compared to neat epoxy.
Figure 3 (B,D) present the variation in tensile strength and impact strength of the composites. Clearly, the tensile strength and impact strength of the composites are improved effectively on addition of fillers. As shown in figure, for neat epoxy tensile strength and impact strength are 54MPa and 26.15KJ/m-2 respectively. The
composite with APTS-GO show the highest values of tensile strength (76 MPa) and impact strength (54.43 KJ/m-2), around 41% and 97% larger than
that of neat epoxy resin. This is attributed to the large surface area and multiple interactions between the matrix and functional groups of the fillers in the composites.
However, a little increment in toughness and ductility was shown upon the addition of Graphene, Graphene Oxide and APTS-GO probably due to the energy dissipation at the interface between the matrix and the filler. Such increment in ductility is comparably significant for Graphene Oxide/epoxy composites. Fig. 3(C) shows the Young’s Modulus (E). The addition of nanoparticles improves the modulus without leading to reduction in strain to failure. The nanocomposite with APTS-GO shows best mechanical properties with 37.5% increment of Young’s Modulus. In general, the characteristic improvement in the mechanical properties is ascribed to a powerful interaction between surface modified graphene oxide and matrix. So, the effective load transfer between nanoparticle and the matrix can take place. Additionally, the nanoparticles may play as connecting bridges to avoid the matrix from fracturing upon mechanical deformation hence improving the mechanical properties of epoxy. Mechanical Properties of Composites
T h e m e c h a n i c a l p r o p e r t i e s o f nanocomposites are summarized in Figure 3 and Table 1. The toughness of composites was calculated by the area of the stress-strain curve. The epoxy
Fig. 1. FTIR spectra of Graphene, Graphene Oxide and APTS-GO
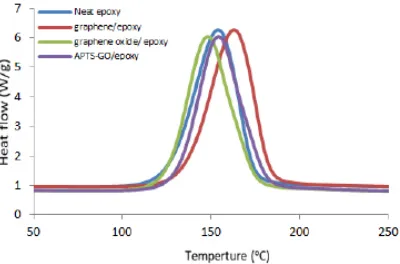
Cure Behaviour of Epoxy Composites by dSC dynamic Scan
Figure 4 presents the DSC thermograms for different epoxy composites at heating rate 10 oC.
For analysis of composites, it is essential to notice that there are any other overlapping transitions. Kinetic events are functions of both temperature and
time like decomposition, cure, evaporation etc. The transition will be shifted to a higher temperature at higher heating rates as a result of the epoxy achieves minimum time for transitioning at a particular temperature. Hence, higher heating rate increases the resolution because composites achieve sufficient time to transition at a particular temperature.
Table 1: Mechanical Properties of Epoxy Composites and Neat Epoxy
Sample ID Tensile Strength Impact Strength Young’s Modulus
σ (MPa) (Kj/m-2) (GPa)
Neat Epoxy 54 26.15 2.4
Graphene/Epoxy 70 44.25 2.8
GO/Epoxy 72 48.75 2.9
APTS-GO/Epoxy 76 51.43 3.1
There is only one exothermic peak for all four specimens as show in Fig. 4. So, epoxy composites with graphene, graphene oxide and APTS-GO as compare to neat epoxy lower the exothermic peak height which signifies enhanced degree of interaction as well as physical hindrance. The effect of graphene, graphene oxide and
APTS-GO on epoxy can be confirmed by peak temperature (Tp) and onset temperature (Ti) and the total heat of reaction (ΔH), listed in Table 2. Table show that heat of reaction is decreasing because well distributed fillers can act as physical hindrance to the movability of polymeric molecule and lower movability of polymeric chain may conclusion in
the decline in the total heat of reaction. Further, assemble graphene oxide are much less effective in obstruct polymeric molecule movability and have scarcely any impact on total heat of reaction.
Table 2: Characteristics Properties Obtained From dCS dynamic Scan
Sample ID ΔH Ti Tp
Neat epoxy 323.5 148.54 199.9
Graphene /epoxy 321.5 139.91 196.19
GO/epoxy 302.3 148.64 202.01
ATPS-GO/epoxy 304.2 144.65 202.01
Fracture Mechanisms via Fractography
Figure 5 presents the FESEM images of fracture surface of composites. The fracture surfaces of all composites show the river mark like design. These river marks like designs were expectably to be developed at the time of the crack propagation. So, these designs suggest the fracture to be a mix manner (shear and tensile) of failure. As shown in Fig. 5, neat epoxy comparably less in number of river like design with flat fracture surface. This indicates restricted plasticity on the crack tips and very quick crack propagation. In comparison to neat epoxy, sample with nanofiller show higher number of river like design with fracture rougher surface. Furthermore, the composites with fractured surfaces show ductile and coarser morphology as compared to neat epoxy. This manner can be interrupted by deflection phenomena in which nanofiller show in a way of propagating crack, the crack is expectedly to deflect and taken lengthy way in order to propagate again, which is surely visible from higher magnify fractographs. Hence, as a result of crack deflection, higher energy is possible to absorb than when in the way of crack show no obstacle.
Fig. 5. FESEM Images of Epoxy Specimen: (A) Neat Epoxy, (B) Graphene/Epoxy, (C) Graphene Oxide/Epoxy, (d) APTS-GO/Epoxy
(a) (b)
(c) (d)
CONCULSION
In this paper, we have demonstrated the advantage of functional group attached to graphene oxide and upon their addition to an epoxy resin. In comparison to neat epoxy, the young’s modulus, tensile strength and impact strength of composites were increased and the best increments were observed for APTS-GO, which can be attributed to the strong covalent bonding between the APTS-GO and epoxy resin leading to good load transfer. Fractography recommended that the primary toughing mechanism in composites was primarily due to the mutual effects of expanded plastic deformation near the crack deflection and
crack tip. Thus, the amine functionality of GO is able to manipulate the specific characterization of GO, indicating the potential to design modification of GO to make it more suitable for applications in a variety of polymer-based nanocomposites, not only for mechanical performance, but also for controlling barrier and other function properties.
ACkNOwLEdGEMENT
Author would like to acknowledge the facilities provided by NSIT, University of Delhi and Department of Polymer science, University of Delhi for providing Mechanical testing.
REFERENCES
1. Lu, S.; Li, S., Yu J., Yuan Z., Qi B., RSC Adv.,
2013, 3, 8915–8923.
2. Nazir, T., Afzal, A., Siddiqi, H.M., Saeed, S., Dumon, M., Polym Bull., 2011, 67, 1539–1551.
3. Davis, S.R., Brough, A.R., Atkinson, A., J
Non-Cryst Solids., 2003, 315, 197–205.
4. Liang, Y.L., Pearson, R.A., Polymer., 2010,
51, 4880–4890.
5. Yuan, X., Polym Bull., 2011, 67, 1785–1797.
6. Pandey, J.K., Raghunatha, R.K., Pratheep, K. A., Polym Degrad Stab., 2005, 88, 234–250.
7. Stankovich, S., Dikin, D.A., Dommett, G.H.B,
Nature., 2006, 442, 282–286.
8. Kuilla, T., Bhadra, S., Yao, D., Kim N.H., Bose, S., Lee, J.H., Prog Polym Sci., 2010, 35,
1350-1375.
9. Potts, J.R., Dreyer, D.R., Bielawski, C.W., Ruoff, R.S., Polymer., 2011, 52, 5-25.
10. Kuilla, T., Bose, S., Kumar, A., Khanra, P., Kim, N.H., Lee, J.H., Prog Mater Sci., 2012,
57, 1061-1105.
11. Rourke, J.P., Pandey, P.A., Moore, J.J., Bates, M., Kinloch, I.A., Young, R.J., Angew Chem
Int., 2011, 50, 3173-3177.
12. Wang, Z.W., Shirley, M.D., Meikle, S.T., Whitby, R.L.D., Mikhalovsky, S.V., Carbon.,
2009, 47,73-79.
13. Young, R.J., Kinloch, I.A., Gong, L., Novoselov, K.S.,
Compos Sci Technol., 2012, 72, 1459-1476.
14. Jiacheng, W., Thuc, V., and Fawad, I., RCS
Adv., 2015, 5, 73510-73524.
15. Li, Z., Wang, R., Young, R. J., Deng, L., Yang, F., Hao, L., Jiao, W., Liu, W., Polymer., 2013,
54, 6437–6446.
16. Rafiee, M. A., Rafiee, J., Wang, Z., Song, H., Yu, Z.-Z., Koratkar, N., ACS Nano., 2009, 3,
3884–3890.
17. Qi, B., Lu, S.R., Xiao X.E., Pan L.L., Tan F.Z., Yu J.H., eXPRESS Polym. Lett., 2014, 8,
467–479.
18. Hummers W.S., Offeman R.E. J. Am. Chem