www.nat-hazards-earth-syst-sci.net/10/1739/2010/ doi:10.5194/nhess-10-1739-2010
© Author(s) 2010. CC Attribution 3.0 License.
and Earth
System Sciences
Public assessment of the usefulness of “draft” tsunami evacuation
maps from Sydney, Australia – implications for the establishment
of formal evacuation plans
F. Dall’Osso1,2,3and D. Dominey-Howes2
1CIRSA, Interdepartemental Centre for Environmental Science, University of Bologna, via S. Alberto 163, 48100 Ravenna, Italy
2Australian Tsunami Research Centre and Natural Hazards Research Laboratory, University of New South Wales, Sydney, NSW 2052, Australia
3Med Ingegneria S.r.l., via P. Zangheri 16, 48100 Ravenna, Italy
Received: 18 January 2010 – Revised: 14 July 2010 – Accepted: 26 July 2010 – Published: 25 August 2010
Abstract. Australia is at risk from tsunamis and recent work has identified the need for models to assess the vulnerability of exposed coastal areas – a fundamental element of the risk management process. Outputs of vulnerability assessment can be used as a baseline for the generation of tsunami pre-vention and mitigation measures, including evacuation maps. Having noted that no evacuation maps exist for Manly, Syd-ney (an area recently subjected to high resolution building vulnerability assessment by Dall’Osso et al., 2009b), we use the results of the analysis by Dall’Osso et al. (2009b) to “draft” tsunami evacuation maps that could be used by the local emergency service organisations. We then interviewed 500 permanent residents of Manly in order to gain a rapid assessment on their views about the potential usefulness of the draft evacuation maps we generated. Results of the sur-vey indicate that residents think the maps are useful and un-derstandable, and include insights that should be considered by local government planners and emergency risk manage-ment specialists during the developmanage-ment of official evacua-tion maps (and plans) in the future.
1 Introduction
Globally, efforts are underway to assess the risk to coasts from tsunamis. Risk assessment such as that detailed in the Australian and New Zealand Risk Management Standard
Correspondence to: F. Dall’Osso
(filippodallosso@gmail.com)
(the As/NZS ISO 3100 Risk Management Standard) requires a probabilistic quantification of the hazard and permits the estimation of frequency, magnitude and return periods for events of particular magnitudes. From such work, hazard scenarios can be identified and risk managers use these to ex-plore the exposure and vulnerability of people and infrastruc-ture to events. Estimates of probable maximum loss (PML) may then used to develop a range of risk reduction strategies (Fig. 1).
Australia is at risk from tsunamis. The 2004 Indian Ocean and 2006 Java tsunamis resulted in flooding in NW West-ern Australia and the 2007 Solomon, 2009 New Zealand and 2010 Chile tsunamis were all recorded on tide gauges in Australia although there was no significant inundation (Dominey-Howes and Goff, 2010). In New South Wales (NSW) (Fig. 2a), historically, only small tsunamis have oc-curred (Dominey-Howes, 2007) but geological evidence sug-gests that megatsunamis larger than the 2004 Indian Ocean event may have occurred repeatedly (Bryant, 2001; Bryant et al., 1992a,b; Young and Bryant, 1992; Nott, 1997, 2004; Bryant and Nott, 2001; Bryant and Young, 1996; Switzer et al., 2005; Young, et al., 1995, 1996). The possibility exists that submarine slides off the NSW continental shelf could trigger large, locally damaging tsunamis and as such, Geo-science Australia has completed surveys of these slide fail-ures (Glenn et al., 2008).
Fig. 1. The risk management process: a simplified flow diagram block indicating the main elements.
Dominey-Howes, 2007; Goff and Dominey-Howes, 2009), but if validated, it has profound implications for the coastal vulnerability of NSW and government agencies (such as the NSW State Emergency Service (NSW SES) – the lead combat agency for tsunamis in NSW) are unprepared for such events (Dominey-Howes, 2007; Dominey-Howes et al., 2006; Dominey-Howes and Goff, 2010).
Hall et al. (2008) outlined a useful “step-by-step process” to assess the tsunami risk to coasts. Step one identifies all tsunami sources, estimates frequencies and propagates waves from source into shallow coastal water providing a proba-bilistic wave height for any particular return period. Step two utilises inundation modelling to examine exactly how far in-land and to what elevation a tsunami might flood. Presently in Australia, Geoscience Australia is the lead agency that un-dertakes these steps.
The last step in Hall et al.’s process is to map the “ex-posure” of buildings within the inundation zone and assess building “vulnerability”. To date, this has not been under-taken by any official government agency or emergency ser-vice in Australia. Such work has however, been undertaken by Dall’Osso et al. (2009a,b).
1.1 Assessment of the vulnerability of buildings to tsunami: the PTVA Model
Dall’Osso et al. (2009a,b) carried out an assessment of the vulnerability of buildings to tsunami in the Manly Local Government Authority (LGA) region, Sydney (Fig. 2b,c). The method used was the PTVA-3 model.
The PTVA is a GIS-based model developed using infor-mation about tsunami impacts and results from post-tsunami
surveys and building damage assessments. PTVA-1 was developed by Papathoma et al. (2003) and Papathoma and Dominey-Howes (2003), who identified and ranked a series of attributes (engineering and environmental) known to be responsible for controlling the type and severity of tsunami damage to buildings. PTVA-1 required the attributes to be ranked in order of importance – a subjective procedure that relied heavily on expert judgment.
A review of the PTVA-1 attributes using post-event data from the Indian Ocean Tsunami lead to the development of a revised version of the model, PTVA-2 (Dominey-Howes and Papathoma, 2007). Dominey-Howes and Papathoma (2007) confirmed that many of the PTVA-1 attributes correlated well with the type and severity of the damage they observed and PTVA-2 featured changes to the ranking and details of the attributes. PTVA-2 was used to provide estimates of PML for a Cascadia tsunami impacting Seaside, Oregon, USA (Dominey-Howes et al., 2010).
Fig. 2. (a) Broad location of the study region of Sydney located in New South Wales (NSW) on the SE coast of Australia. The hatched
oval encompassing the region north of Sydney south to beyond Batemans Bay is the region reported to have been affected by Holocene megatsunami (Bryant, 2008). NSW = New South Wales, NT = Northern Territory, SA = South Australia, TAS = Tasmania, VIC = Victoria, WA = Western Australia. (b) Simplified map of the Sydney Harbour region with our specific field study area of Manly located NE of the CBD. Highways 1 and 2 are shown. (c) Detailed GIS map of our study area of Manly. Area of inundation (including relative water depths above land surface) associated with the selected tsunami scenario are shown in blue. Principal features are high-lighted and buildings inundated by the tsunami are indicated in orange. The green and yellow rectangular frames indicates the position of the vulnerability and “draft” evacuation maps shown in Figs. 3, 4, 5, and 6.
In Dall’Osso et al. (2009b), the PTVA-3 was used to un-dertake an assessment of 1100+ individual buildings located within the expected flood zone associated with a particular tsunami scenario (Fig. 2c). Selected results of this analysis are shown in Figs. 3 and 4, which cover the northern and the southern parts of Manly respectively (indicated as “map frames” 1 and 2 in Fig. 2c). These two areas are shown here since that are markedly different in character.
The scenario used by Dall’Osso et al. (2009b) relates to a tsunami triggered by an underwater sediment slide east of Sydney. The tsunami would reach the coast somewhere in the range of five to twenty minutes after generation (J. Sex-ton, personal communication, 2009). This is the worse case scenario because such an event could occur suddenly without an earthquake trigger that would otherwise initiate an alarm warning from the Australian Tsunami Warning System. With a tsunami arriving at the coast with no official warning, in-sufficient time would exist to fully evacuate low lying areas close to the shoreline. We assume the inundation achieves a
run-up of +5 m above sea level (m a.s.l.), occurring during a peak of high tide (+2 m a.s.l.).
1.2 Moving forward from building vulnerability assessments to evacuation maps
Individual building vulnerability assessment can be used to develop building codes and regulations, to develop a program of building retrofitting, to outline land-use zones, and to aid in emergency risk management (NTHMP, 2001). With re-gard to this last option, vulnerability assessments can help to formulate evacuation maps (Schiermeier, 2005a,b).
Fig. 3. Tsunami inundation and water depth in the northern part of Manly (Map Frame n. 1). The RVI scores of every building located within
the inundation zone are indicated.
Fig. 4. Tsunami inundation and water depth in the southern part of Manly, the Central Business District (Map Frame n. 2). The RVI scores
community responds to risk reduction efforts including evac-uation plans, varies enormously from place to place and for hazard to hazard. Tsunami evacuation planning has recently been the focus of a number of studies (e.g., Bellotti et al., 2009; Taubenb¨ock et al., 2009; Post et al., 2009).
In an interesting study of significant natural disasters, Th´evenaz and Resodihardjo (2010) identified a series of fac-tors and conditions that hamper effective community emer-gency response during disasters. They classified these fac-tors in to groups, but importantly, their focus on “Policy” (and its associated planning) high-lights the importance of contingency plans (which we interpret to include evacuation plans) as a vital element in effecting community response in emergencies.
Tsunami evacuation maps are used in two ways. First, they are used to identify “unsafe” areas or zones from which peo-ple must clear entirely into “safe” zones outside the evac-uation areas. The second is to identify individual building structures within the inundation zone that are safe to permit “vertical” evacuation when insufficient time exists to enable complete ground-based evacuation of an area (FEMA, 2009). 1.3 Aims of this work
In light of our introduction, the aims of this study are to: – construct “draft” evacuation maps that include the identification of safe evacuation zones and safe evacua-tion buildings (using the inundaevacua-tion scenario and data on building vulnerability undertaken by Dall’Osso et al., 2009); and
– to recruit 500 permanent residents and ask them to evaluate the potential usefulness of the “draft” evacua-tion maps we create.
This work is necessary because the General Manager of the Manly Local Government Authority (Manly LGA) con-firmed to us that no official tsunami evacuation plans exist although the LGA is keen to develop such maps as part of an “all hazards” risk management approach. Further, the lo-cal Manly unit of the State Emergency Services (SES) con-firmed that no tsunami evacuation plans exist. Whilst the lo-cal Manly unit of the State Emergency Service (the lead com-bat agency for responding to a tsunami) has not yet under-taken tsunami vulnerability assessment or evacuation plan-ning, we acknowledge that at the State level, the NSW SES is working through a program of tsunami risk related activities and will undoubtedly at some point in the future, consider evacuation planning.
Examination of secondary sources of information (namely local/regional newspaper archives) reveals that the current lack of tsunami evacuation planning has been high-lighted in the local community. The Manly Daily newspaper in a critical Editorial statement indicated that there is:
. . . a need for preparation . . . with as little time to evacuate as five minutes, authorities must work together to establish
an effective warning system . . . the majority would feel more
comfortable knowing that in the event of a disaster an effec-tive warning system [including evacuation plan] was at least in place.
(Editorial, The Manly Daily, p. 11, 2009) Further, members of the local community resident in Manly LGA who were interviewed about tsunami risk and the current lack of tsunami risk management and evacuation planning provided responses such as:
I don’t think you could run very far . . . it would be impos-sible to escape. (MB)
It does scare me a bit . . . (LW) I think it’s a real possibility . . . (BC)
. . . you can’t pretend it’s an impossible scenario . . . Manly is situated quite low so I wouldn’t want to be around if and when it hit. (KD)
(Woolley, p. 5, 2009) Henry Wong, General Manager of Manly Council stated:
. . . the council had received advice that residents in 2500 houses would have five to 20 minutes from the time of a sub-marine landslide before the tsunami hit the beach. The coun-cil had to take warnings seriously.
(Sydney Morning Herald, p. 7, 2009) He also stated: . . . the biggest challenge would be
evacu-ating the CBD (central business district) . . .
(Woolley, p. 5, 2009) It is clear therefore, that there is a need for tsunami evacu-ation plans. Whilst we have stated our aims, we need to make it clear that this paper does not seek to explore the multitude of reasons that influence public perceptions of the draft evac-uation plans we develop. We recognise such work is valu-able both academically and for practical reasons. However, the aim of this work is to provide practical support and tools to the local emergency services and information to help them plan and to test the communities tolerance for our draft maps. It is not to advance the theoretical understanding of the sub-ject area.
2 Approach and results
2.1 Generating “draft” evacuation maps
Fig. 5. “Draft” evacuation map for the northern part of Manly (map frame n. 1). The star indicates the location of the identified evacuation
point. Safe buildings for vertical evacuation are colored in green.
1. they are located outside the inundation zone;
2. they are as close as possible to inundated building blocks meaning they represent the shortest horizontal evacuation distances from the nearest shoreline; and 3. they are located along main roads which is important
when considering which alternative evacuation corri-dors are most suitable (Taubenb¨ock et al., 2009). Next, we recognised that it is extremely unlikely all peo-ple located within the expected inundation zone will be able to safely evacuate outside this area once inundation at the shore has commenced (FEMA, 2009). This recognition is based on the fact that some evacuation points/assembly ar-eas are located some distance from the contemporary shore-line and it takes times to physically walk this distance. Post et al. (2009) estimated that on average, pedestrians evacuate at a minimum speed of 0.6 m/sec. This value considers the effect of land use type, terrain and slope, population den-sity and the presence of critical facilities such as hospi-tals or kindergarden. These factors considerably affect the free walking speed of pedestrians when they are not hin-dered by other people or obstacles (Daamen and Hoogen-doorn, 2005; Weidmann, 1993).
By using the results of the PTVA-3 analysis of building vulnerability displayed in GIS format, we were able to
iden-tify those buildings within the inundation zone that would be suitable for permitting “vertical evacuation”. Specifically, we identified buildings within 10 min walking time of the contemporary shoreline. Our analysis reveals that people liv-ing in buildliv-ings within the yellow block, in the north part of Manly (Fig. 5), would not be able to reach any safe evacu-ation point/assembly area in less than 10 min. Furthermore, the bridge at the northern end of the bay could not be used for escape on foot because tsunami flow-depth over the bridge will exceed 4 m.
Given the findings, the only way people could escape tsunami inundation would be via vertical evacuation in to safe buildings (FEMA, 2009). Consequently, we identified individual buildings across the study area that could be used for vertical evacuation above the maximum expected flood level. In Figs. 5 and 6, these buildings are coloured green. These buildings are identified from the PTVA-3 Model anal-ysis carried out by Dall’Osso et al. (2009b) because they have the lowest RVI values and because their upper floors lie well above the expected maximum flood height. That is, these buildings have at least two floors above the expected maxi-mum flood level.
Fig. 6. “Draft” evacuation map for the southern part of Manly (map frame n. 2). The stars indicate the location of the identified evacuation
points. Safe buildings for vertical evacuation are colored in green.
would be (relatively speaking) the “safest” structures for ver-tical evacuation. We accept that more detailed work needs to be undertaken but in the absence of any information at all, ur approach represents a defensible, common sense approach. 2.2 Public evaluation of the usefulness of the “draft”
evacuation maps
Once we had developed the draft evacuation maps, we wanted them to be evaluated by Manly residents (the “pub-lic”). We were specifically interested in knowing whether local residents (as well as visitors but we did not interview non-residents in this study) – for whom such maps are devel-oped, found them potentially useful for identifying safe areas and what they did and did not like about the draft maps. We believe such analysis will assist risk managers when devel-oping official evacuation maps at a later stage.
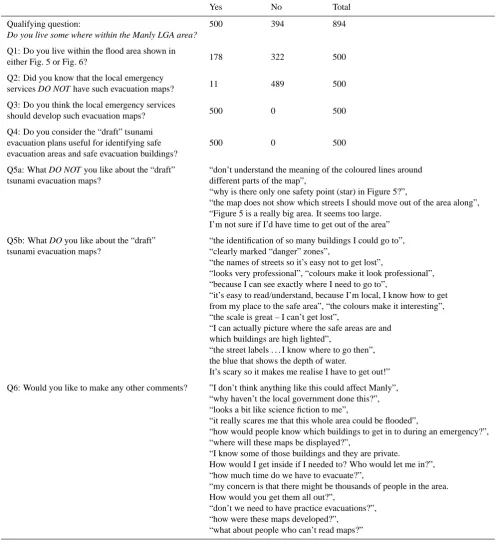
We developed a very simple questionnaire survey that comprised just six questions (see Table 1). We were not in-terested in specifics about respondent gender, age, level of education and prior tsunami experience and knowledge. We simply needed to know that they were local residents and what they thought of the draft maps. As such, our survey technique used a purposive sampling approach and followed the latest guidelines for emergency risk management socially oriented research published in this journal by Bird (2009).
We asked two types of questions: simple questions that permitted quick “quantitative” analysis (i.e., X percentage of participants think . . . ) (these were the qualifying question and questions 1 to 4 in Table 1) and more complex questions that required explanation of views thus permitting more de-tailed “qualitative” analysis (i.e., explain . . . ) (questions 5 and 6 in Table 1).
We found that:
– In order to recruit 500 “valid” participants (that is, peo-ple who are residents (local government tax payers) in the Manly LGA), we had to approach 894 people in to-tal;
– 178 participants (or 35.6% of the sample) actually live within the tsunami inundation zones shown in either Fig. 5 or Fig. 6;
– 322 participants (or 64.4% of the sample) live elsewhere within the Manly LGA area. These people were still valid participants as their taxes help support the local emergency risk management policies and practices; – 489 participants (or 97.8% of the sample) did not know
that the local State Emergency Service (SES) have not yet developed official evacuation maps;
Table 1. A quick look summary of the Short Survey questionnaire we used and the results.
Yes No Total Qualifying question: 500 394 894
Do you live some where within the Manly LGA area?
Q1: Do you live within the flood area shown in
178 322 500
either Fig. 5 or Fig. 6?
Q2: Did you know that the local emergency
11 489 500
services DO NOT have such evacuation maps? Q3: Do you think the local emergency services
500 0 500
should develop such evacuation maps? Q4: Do you consider the “draft” tsunami
evacuation plans useful for identifying safe 500 0 500 evacuation areas and safe evacuation buildings?
Q5a: What DO NOT you like about the “draft” “don’t understand the meaning of the coloured lines around tsunami evacuation maps? different parts of the map”,
“why is there only one safety point (star) in Figure 5?”,
“the map does not show which streets I should move out of the area along”, “Figure 5 is a really big area. It seems too large.
I’m not sure if I’d have time to get out of the area” Q5b: What DO you like about the “draft” “the identification of so many buildings I could go to”, tsunami evacuation maps? “clearly marked “danger” zones”,
“the names of streets so it’s easy not to get lost”,
“looks very professional”, “colours make it look professional”, “because I can see exactly where I need to go to”,
“it’s easy to read/understand, because I’m local, I know how to get from my place to the safe area”, “the colours make it interesting”, “the scale is great – I can’t get lost”,
“I can actually picture where the safe areas are and which buildings are high lighted”,
“the street labels . . . I know where to go then”, the blue that shows the depth of water.
It’s scary so it makes me realise I have to get out!” Q6: Would you like to make any other comments? ”I don’t think anything like this could affect Manly”,
“why haven’t the local government done this?”, “looks a bit like science fiction to me”,
“it really scares me that this whole area could be flooded”,
“how would people know which buildings to get in to during an emergency?”, “where will these maps be displayed?”,
“I know some of those buildings and they are private.
How would I get inside if I needed to? Who would let me in?”, “how much time do we have to evacuate?”,
“my concern is that there might be thousands of people in the area. How would you get them all out?”,
“don’t we need to have practice evacuations?”, “how were these maps developed?”,
“what about people who can’t read maps?”
– 100% of our participants considered that our “draft” tsunami evacuation plans are useful for identifying safe evacuation areas and safe evacuation buildings.
about an evacuation map is significant because these insights help ensure maps can be designed in a way that maximises their acceptance by the public and just as importantly, their compliance during an emergency. Questions 5 and 6 were de-signed to gain these insights so that these may be considered in the future design of “official” tsunami evacuation maps.
In relation to Questions 5 and 6, we report that:
– 224 participants (or 44.8% of our sample) provided comments about what they did not like about our draft tsunami maps (Question 5a). The vast majority of the negative comments were the same. As such, we do not list 224 responses that are the same. However, Table 1 provides a summary of the “key messages” about what our respondents did not like about the maps;
– 276 participants (or 55.2% of our sample) said there was nothing they did not like about the draft tsunami evacu-ation maps;
– 421 participants (or 84.2% of our sample) provided comments on what they did like about the draft evac-uation maps (in response to Question 5b). Again, the responses provided by our participants were very sim-ilar and “examples” of these responses are provided in Table 1;
– 79 participants (or 15.8% of our sample) provided no response to the Question 5b; and last
– 121 participants (or 24.2% of our sample) provided re-sponses to Question 6 and offered some other com-ments. Again, responses were broadly similar and the most frequently provided comments are listed in Ta-ble 1.
3 Discussion
3.1 Implications of findings for Australia
In addition to residents living within the forecast inundation zones, numerous other stakeholders will be interested in the management of risk associated with tsunamis (i.e. the emer-gency services, urban planners, insurance companies, real es-tate officers, etc.). However, here we focus on Australian Lo-cal Government Authorities (LGA’s) (including their LoLo-cal Emergency Management Officers, LEMO’s) and LGA units of the State Emergency Service (SES) who are at the sharp end of dealing with hazardous events such as tsunamis.
In a major Australian Government report on coastal vul-nerability1(Australian Government, 2009), it was noted that 1We note that this report focused mostly on the vulnerability of
coasts to climate change, sea level rise and storm surges. However, tsunamis present similar challenges to vulnerability as do storm surges and the questions related to risk assessment and inundation are identical.
Local Government LEMO’s and State Emergency Service personnel are interested in (amongst others) questions such as:
– Which areas of the coast are likely to experience flood-ing associated with a tsunami of a particular magni-tude/return period?
– Which areas of low-lying coastal land will need to be evacuated in the event of a tsunami of a particular mag-nitude/return period?
– What areas can be identified as “safe zones” to which people may be moved during an evacuation?
– What are the best routes to “safe evacuation areas”?
– In the event that it is not possible to move all people lo-cated within the expected inundation zone into “safe” evacuation areas outside of the expected flood zone, which buildings provide the best options for “vertical evacuation” above the maximum expected flood level? The work we have done here addresses these questions. We have verified that, at present, no tsunami evacuation plans are in place for the Manly LGA area and as such, the local population remain highly vulnerable to tsunamis. Dall’Osso et al. (2009b) undertook a detailed building-by-building as-sessment of structural vulnerability in Manly. Here, we have used some of the results generated by Dall’Osso et al. (2009b) to explore the identification of areas that might be classified as “safe evacuation points” during a tsunami. The outputs of Dall’Osso et al. (2009b) are useful, because they are already organised in GIS layers and include most of the input data required for the drafting of the evacuation maps in a georeferenced vector format (i.e. building physical features and vulnerability, topography, terrain slope, land and building use, the number of residential units per building, the presence and location of critical facilities, etc.).
Figure 6 shows the mixed residential and commercial area of Manly CBD. Although the flow depth above ground sur-face is rather high in the tsunami scenario examined in this case, many individual buildings are assessed as being suit-able for vertical evacuation. Given that the ocean beach at Manly is a favourite with beach visitors and can be heavily populated on a sunny summer weekend, the close proximity of many buildings suitable for vertical evacuation, is signifi-cant.
The “draft” evacuation maps we generated show how the vulnerability data provided by Dall’Osso et al. (2009b) can be used to organise tsunami prevention measures at the local level, and they are a first step in that direction. Such maps can be used by local emergency planners as a baseline to create official evacuation plans. Such plans will have to: (1) include detailed and reliable data on the local population; (2) arrange temporary shelters in appropriate zones; and (3) include the possibility of vertical evacuation (FEMA, 2009).
To our knowledge, within Australia, no tsunami evacua-tion maps (draft or otherwise) have yet been developed or trialled with the public. As such, our survey of 500 Manly residents, though modest, represents a very significant test of the potential usefulness of such maps to residents who will need to be evacuated in the event of an emergency.
Responses to Questions 4, 5, and 6 (shown in Table 1) provide useful insights and feedback on our draft evacua-tion maps that official government agencies such as the State Emergency Service will need to keep in mind during the de-velopment of official maps in the future. In fact, we recom-mend that official emergency agencies actually “test” draft maps with the community/public/relevant stakeholders be-fore finalising any future official maps in order to increase community compliance.
The main limitation of our approach is the lack of a Proba-bilistic Tsunami Hazard Assessment (PTHA) for New South Wales upon which we can run our vulnerability assessment (Dominey-Howes et al., 2010).
3.2 Implications of findings for other locations and recommendations
We understand that readers based in other locations will ask what value there is in our work to their areas? This is a rea-sonable question. We see the following issues as relevant to other locations both within Australia and internationally:
– To ensure “compliance” by the public during an evacua-tion exercise or real event, we suggest that “draft” evac-uation maps should always be trialled with local pop-ulations to identify potential sticking points and issues that require clarification. Such trialling is likely to in-crease public understanding of the intent and value of evacuation maps.
– Scale seems very important. Our respondents noted that the high resolution of the maps with clearly identifiable
streets, parks and locations meant they “knew” the place contained in the map. This increased their trust in the map.
– Use of colour seems important. Colour makes the maps more interesting and seemed to help engage respondents interests; and finally
– There needs to be a clearly identified process that under-pins the development of the maps and that this process is important to the public. They need to know how the maps have been generated in order to increase their con-fidence the map is meaningful.
The observations we have made in our study location of Manly and the implications of our work elsewhere need to be tested with larger sample sizes. We recommend that local governments together with the emergency services test some of the approaches and issues we have raised here.
4 Conclusions
As our cities expand, the exposure of our built environment to hazards such as tsunamis increases. Australia is at risk to tsunamis. Abandoning coastal regions affected by hazards such as tsunamis is simply not possible for a variety of rea-sons. Therefore, in order to enhance tsunami risk reduction strategies, high-resolution assessments of building vulnera-bility are required. Such assessments provide the building blocks upon which appropriate risk reduction strategies may be formulated. Recent work by Dall’Osso et al. (2009a, b) using a newly revised and improved PTVA-3 Model has been shown to be useful for providing assessments of the vulner-ability of individual building structures to tsunamis of par-ticular magnitudes. In this paper, we have taken the outputs from Dall’Osso et al. (2009b) and shown where and how they may be used to address important questions of relevance to local government and emergency services officers. We use a detailed case study from Manly, Sydney to explore these questions and options. We have not made specific recom-mendations since in our view, it is the role of responsible professional decision makers to best decide how such data might be used.
For the Local Government Area (LGA) of Manly, Sydney, we have been able to identify specific points that lie outside tsunami inundation zones that would be suitable to evacuate to. Further, where insufficient time exists to enable people to fully evacuate from the inundation zone, we have been able to identify specific buildings that would be appropriate to fa-cilitate vertical evacuation. This is because these buildings have been assessed as having low relative vulnerability index and because they would be only partially inundated by the adopted tsunami scenario.
maps are useful. There are however, a few useful pointers about map layout and style that will be useful for the rel-evant emergency services to consider in the future as they move towards the development of official maps.
Acknowledgements. We would like to thank Geoff Withycombe
of the Sydney Coastal Councils Group Inc. for his considerable efforts in helping to organise contact with Sydney local government authorities. We thank Manly Local Government for access to data used in the modelling undertaken in this study. James Goff at the Australian Tsunami Research Centre, UNSW is thanked for helpful discussion about ideas expressed herein. We also wish to thank three referees who made significant comments on earlier drafts of the manuscript. Residents of Manly who took time to participate in our survey are also thanked.
Edited by: S. Tinti
Reviewed by: two anonymous referees
References
Australian Government: Climate Change Risks to Australia’s Coasts, A first pass national assessment Australian Federal Government Report, Department of Climate Change, 172 pp., November 2009.
Bird, D. K.: The use of questionnaires for acquiring information on public perception of natural hazards and risk mitigation - a review of current knowledge and practice, Nat. Hazards Earth Syst. Sci., 9, 1307–1325, doi:10.5194/nhess-9-1307-2009, 2009. Bird, D. and Dominey-Howes, D.: Testing the use of a “ques-tionnaire survey instrument” to investigate public perceptions of tsunami hazard and risk in Sydney, Australia, Nat. Hazards, 45, 99–122, 2008.
Bird, D. and Dominey-Howes, D.: Tsunami risk mitigation and the issue of public awareness, The Australian Journal of Emergency Management (AJEM), 21(4), 29–35, 2006.
Bellotti, G., Di Risio, M., and De Girolamo, P.: Feasibility of Tsunami Early Warning Systems for small volcanic islands, Nat. Hazards Earth Syst. Sci., 9, 1911–1919, doi:10.5194/nhess-9-1911-2009, 2009.
Bryant, E.: Tsunami: the underrated hazard, Cambridge University Press, 320 pp., 2001.
Bryant, E.: Tsunami: The underrated hazard, 2nd edn., Chichester, Springer Praxis Publishing, 342 pp., 2008.
Bryant, E. and Nott, J.: Geological indicators of large tsunami in Australia, Nat. Hazards, 24, 231–249, 2001
Bryant, E. and Young, R.: Bedrock-sculpting by tsunami, south coast New South Wales, Australia, J. Geol., 104, 565–582, 1996. Bryant, E., Young, R., and Price, D.: Evidence of tsunami sedi-mentation on the southeastern coast of Australia, J. Geol., 100, 753–765, 1992a.
Bryant, E., Young, R., Price, D., and Short, A.: Evidence for Pleis-tocene and Holocene raised marine deposits, Sandon Point, New South Wales, AJEM, 39, 481–493, 1992b.
Chen, K. and McAneney, J.: High-resolution estimates of Aus-tralia’s coastal population, Geophys. Res. Lett., 33, L16601, doi:10.1029/2006GL026981, 2006.
Daamen, W. and Hoogendoorn, S. P.: Free speed distributions – Based on empirical data in different traffic conditions, in:
Pedes-trian and evacuation dynamics, Springer Verlag-Berlin Heilde-berg, 13–25, 2007.
Dall’Osso, F., Gonella, M., Gabbianelli, G., Withycombe, G., and Dominey-Howes, D.: A revised (PTVA) model for assessing the vulnerability of buildings to tsunami damage, Nat. Hazards Earth Syst. Sci., 9, 1557–1565, doi:10.5194/nhess-9-1557-2009, 2009. Dall’Osso, F., Gonella, M., Gabbianelli, G., Withycombe, G., and Dominey-Howes, D.: Assessing the vulnerability of buildings to tsunami in Sydney, Nat. Hazards Earth Syst. Sci., 9, 2015–2026, doi:10.5194/nhess-9-2015-2009, 2009b.
Dawson, A.: Linking tsunami deposits, submarine slides and off-shore earthquakes, Quatern. Int., 60(1), 119–126, 1999. Dominey-Howes, D. and Goff, J.: Tsunami: unexpected blow foils
flawless warning system, Nature, 464, p. 350, 2010.
Dominey-Howes, D. and Papathoma, M.: Validating a Tsunami Vulnerability Assessment Model (the PTVA Model) Using Field Data from the 2004 Indian Ocean Tsunami, Nat. Hazards, 40, 113–136, 2007.
Dominey-Howes, D.: Geological and historical records of Aus-tralian tsunami, Mar. Geol., 239, 99–123, 2007.
Dominey-Howes, D. P., Verner, J., and Papathoma-K¨ohle, M.: Es-timating probable maximum loss from a Cascadia tsunami, Nat. Hazards, 53, 43–61, 2010.
Dominey-Howes, D., Humphreys, G., and Hesse, P.: Tsunami and palaeotsunami depositional signatures and their potential value in understanding the late-Holocene tsunami record, The Holocene, 16(8), 1095–1107, 2006.
Felton, A. and Crook, K.: Evaluating the impacts of huge waves on rocky shorelines: an essay review of the book “Tsunami – the underrated hazard”, Mar. Geol., 197, 1–12, 2003.
FEMA (Federal Emergency Management Agency): Vertical evac-uation from tsunamis: a guide for community officials, FEMA P646A, 50 pp., June 2009.
Gissing, A., Webb, R., and Hanslow, D.: Emergency management of tsunami in New South Wales and the response to the Solomon Islands tsunami of April 2nd, 2007, AJEM, 23(3), 28–34, 2008. Goff, J. and Dominey-Howes, D.: Palaeotsunamis – does Australia
and New Zealand have a shared prehistory?, Earth Science Re-views, 97, 159–166, 2009.
Goff, J., Hulme, K., and McFadgen, B.: “Mystic Fires of Tamaatea”: attempts to creatively rewrite New Zealand’s cultural and tectonic past, J. Roy. Soc. New Zeal., 33(4), 795–809, 2003. Goff, J. and McFadgen, B.: Large earthquakes and the abandonment of prehistoric coastal settlements in 15th century New Zealand, Geoarchaeology, 18(6), 609–623, 2003.
Hall, G., Stevens, R., and Sexton, J.: Tsunami planning and prepa-ration in Western Australia: application of scientific modelling and community engagement, AJEM, 23(4), 30–36, 2008. Noormets, R., Crook, K., and Felton, E.: Sedimentology of rock
shorelines 3. Hydrodynamics of mega-clast emplacement and transport on a shore platform, Oahu, Hawaii, Sediment. Geol., 172, 41–65, 2004.
Nott, J.: Extremely high energy wave deposits inside the Great Bar-rier Reef, Australia: determining the cause – tsunami or tropical cyclone, Mar. Geol., 141, 193–207, 1997.
NTHMP: Designing for tsunamis. Seven principles for planning and designing for tsuanmis, National Tsunami Hazard and Mitigation Program (NTHMP) Report, 60 pp., March 2001.
Opper, S. and Gissing, A.: Anticipating waves of destruction, un-published report, 8 pp., available at: http://www.ses.nsw.gov.au/ infopages/2276.html (last access: 11 August 2010), 2005. Papathoma, M. and Dominey-Howes, D.: Tsunami vulnerability
assessment and its implications for coastal hazard analysis and disaster management planning, Gulf of Corinth, Greece, Nat. Hazards Earth Syst. Sci., 3, 733–747, doi:10.5194/nhess-3-733-2003, 2003.
Papathoma, M., Dominey-Howes, D., Zong, Y., and Smith, D.: As-sessing tsunami vulnerability, an example from Herakleio, Crete, Nat. Hazards Earth Syst. Sci., 3, 377–389, doi:10.5194/nhess-3-377-2003, 2003.
Post, J., Wegscheider, S., M¨uck, M., Zosseder, K., Kiefl, R., Stein-metz, T., and Strunz, G.: Assessment of human immediate re-sponse capability related to tsunami threats in Indonesia at a sub-national scale, Nat. Hazards Earth Syst. Sci., 9, 1075–1086, doi:10.5194/nhess-9-1075-2009, 2009a.
Schiermeier, Q.: The chaos to come, Nature, 438, 903–906, 2005b. Switzer, A. D. and Pucillo, K.: Sea Level, Storm, or Tsunami: Enig-matic Sand Sheet Deposits in a Sheltered Coastal Embayment from Southeastern New South Wales, Australia, J. Coastal Res., 21(4), 655–663, 2005.
Sydney Morning Herald: Manly tsunami threat, Sydney Morning Herald Newspaper, p. 7, 9 November 2009.
Taubenb¨ock, H., Goseberg, N., Setiadi, N., L¨ammel, G., Moder, F., Oczipka, M., Kl¨upfel, H., Wahl, R., Schlurmann, T., Strunz, G., Birkmann, J., Nagel, K., Siegert, F., Lehmann, F., Dech, S., Gress, A., and Klein, R.: “Last-Mile” preparation for a potential disaster - Interdisciplinary approach towards tsunami early warn-ing and an evacuation information system for the coastal city of Padang, Indonesia, Nat. Hazards Earth Syst. Sci., 9, 1509–1528, doi:10.5194/nhess-9-1509-2009, 2009.
Th´evenaz, C. and Resodihardjo, S.: All the best laid plans. . . condi-tions impeding peroper emergency response, In. J. Prod. Econ., 126(1), 7–21, 2010.
Weidmann, U.: Transporttechnik der Fussganger, 2 edn., in: Schriftenreihe des IVT, vol 90. Institute for Transport Planning and Systems ETH Zurich, 1993 (in German).
Woolley, R.: Tsunami warning!, The Manly Daily, p. 1, p. 5, p. 11, 10 November 2009.
Young, R, Bryant, E., and Price, D.: Catastrophic wave (tsunami?) transport of boulders in the southern New South Wales, Aus-tralia, Z. Geomorphol., NF, 40(2), 191–207, 1996.
Young, R. and Bryant, E.: Catastrophic wave erosion on the south-eastern coast of Australia: impact of the Lanai tsunami ca. 105 ka?, Geology, 20, 199–202, 1992.