University of Pennsylvania
ScholarlyCommons
Publicly Accessible Penn Dissertations
1-1-2014
Essays in Applied Economics
Daniel Sacks
University of Pennsylvania, sacks.daniel@gmail.com
Follow this and additional works at:
http://repository.upenn.edu/edissertations
Part of the
Economics Commons
This paper is posted at ScholarlyCommons.http://repository.upenn.edu/edissertations/1430
For more information, please contactlibraryrepository@pobox.upenn.edu.
Recommended Citation
Sacks, Daniel, "Essays in Applied Economics" (2014).Publicly Accessible Penn Dissertations. 1430.
Essays in Applied Economics
Abstract
Essay 1 studies physician agency problems, which arise whenever physicians fail to maximize their patients' preferences, given available information. These agency problems are well documented, but the magnitude of their welfare consequences for patients---the losses from suboptimal treatment choice induced by agency---are unclear. I infer patient drug preference from their compliance decisions. I begin by showing that initial
prescriptions respond to physician financial incentives to control costs and to pharmaceutical detailing, but compliance does not, pointing to agency problems. I then develop and estimate a model of physician-patient interactions where physician write initial prescriptions, but patients choose whether to comply. Fully eliminating agency problems increases compliance by 6.5 percentage points, and raises patient welfare by 22\% of drug spending. Contracts that better align doctor and patient preferences can improve patient welfare, but attain only half the gains from eliminating agency completely. Although physician agency problems reduce patient welfare, eliminating them is thus likely difficult.
Essay 2, co-authored with Alexander M. Gelber and Damon Jones, studies frictions in adjusting earnings to changes in the Social Security Annual Earnings Test (AET) using a panel of Social Security Administration microdata on one percent of the U.S. population from 1961 to 2006. Individuals continue to "bunch" at the convex kink the AET creates even when they are no longer subject to the AET, consistent with the existence of earnings adjustment frictions in the U.S. We develop a novel estimation framework and estimate in a baseline case that the earnings elasticity with respect to the implicit net-of-tax share is 0.23, and the fixed cost of adjustment is \$152.08.
Essay 3 studies the impact of health expenditure risk on annuitization. Theoretical research suggests that such risk can have an ambiguous influence on the annuitization decisions of the elderly. I provide empirical evidence on this linkage, by estimating the impact of supplemental Medicare insurance (Medigap) coverage on the annuity demand of older Americans. Medigap coverage has a strong impact on annuitization: the extensive margin elasticity is 0.39, the overall elasticity of private annuity income with respect to Medigap coverage is 0.56. These results are robust to controls for health, wealth, and preferences, as well as other robustness tests. They suggest that medical expenditure risk has a large impact on underannuitization.
Degree Type Dissertation
Degree Name
Doctor of Philosophy (PhD)
Graduate Group Applied Economics
Second Advisor Katja Seim
ESSAYS IN APPLIED ECONOMICS
Daniel W. Sacks
A DISSERTATION
in
Applied Economics
For the Graduate Group in Managerial Science and Applied Economics
Presented to the Faculties of the University of Pennsylvania
in
Partial Fulfillment of the Requirements for the
Degree of Doctor of Philosophy
2014
Supervisor of Dissertation Co-Supervisor of Dissertation
Uli Doraszelski Katja Seim
Professor of Associate Professor of
Business Economics and Public Policy Business Economics and Public Policy
Graduate Group Chairperson
Eric Bradlow, Professor of Marketing Statistics and Education
Dissertation Committee
Uli Doraszelski, Professor of Business Economics and Public Policy
Katja Seim, Associate Professor of Business Economics and Public Policy
Mark Duggan, Professor of Business Economics and Public Policy
ESSAYS IN APPLIED ECONOMICS
c
COPYRIGHT
2014
Daniel William Sacks
This work is licensed under the
Creative Commons Attribution
NonCommercial-ShareAlike 3.0
License
To view a copy of this license, visit
ACKNOWLEDGEMENT
I am deeply grateful to my dissertation committee, Mark Duggan, Bob Town, and
espe-cially my advisors Uli Doraszelski and Katja Seim. Their advice and comments, and their
high standards, have improved the dissertation enormously. Alex Gelber and J.F. Houde
were not on my committee but might as well have been; their advice, too, has been hugely
valuable. Many others have provided helpful comments on one or multiple papers in the
dissertation: Mike Abito Raj Chetty, Jim Cole, Anthony Defusco, Hanming Fang Jonathan
Fisher, Richard Freeman, John Friedman, Bill Gale, Matt Grennan, Josh Gottlieb, Ben
Handel, Hilary Hoynes, Adam Isen, Henrik Kleven, Matt Notowidigdo, Mark Pauley
Em-manuel Saez, Naomi Sacks, Kent Smetters, Cindy Soo, Amanda Starc, Ashley Swanson, and
Jeremy Tobacman. I am grateful to Dr. Stephen Gottlieb and Dr. Sarah Miller for
provid-ing helpful detail about prescribprovid-ing anti-cholesterol drugs. I acknowledge financial support
from the Wharton Center for Human Resources and the Wharton Risk and Decision
Pro-cesses Center, from NIH grant #1R03 AG043039-01, from a National Science Foundation
Graduate Research Fellowship, and from support from the U.S. Social Security
Administra-tion through grant #5RRC08098400-05-00 to the NaAdministra-tional Bureau of Economic Research
(NBER) as part of the SSA Retirement Research Consortium. The ndings and conclusions
expressed are solely those of the authors and do not represent the views of SSA, any agency
of the Federal Government, or the NBER. The research uses data from the Census Bureau’s
Longitudinal Employer Household Dynamics Program, which was partially supported by
the following National Science Foundation Grants: SES-9978093, SES-0339191 and
ITR-0427889; National Institute on Aging Grant AG018854; and grants from the Alfred P. Sloan
ABSTRACT
ESSAYS IN APPLIED ECONOMICS
Daniel W. Sacks
Uli Doraszelski
Katja Seim
Essay 1 studies physician agency problems, which arise whenever physicians fail to
max-imize their patients’ preferences, given available information. These agency problems are
well documented, but the magnitude of their welfare consequences for patients—the losses
from suboptimal treatment choice induced by agency—are unclear. I infer patient drug
preference from their compliance decisions. I begin by showing that initial prescriptions
re-spond to physician financial incentives to control costs and to pharmaceutical detailing, but
compliance does not, pointing to agency problems. I then develop and estimate a model
of physician-patient interactions where physician write initial prescriptions, but patients
choose whether to comply. Fully eliminating agency problems increases compliance by 6.5
percentage points, and raises patient welfare by 22% of drug spending. Contracts that
bet-ter align doctor and patient preferences can improve patient welfare, but attain only half
the gains from eliminating agency completely. Although physician agency problems reduce
patient welfare, eliminating them is thus likely difficult.
Essay 2, co-authored with Alexander M. Gelber and Damon Jones, studies frictions in
adjusting earnings to changes in the Social Security Annual Earnings Test (AET) using a
panel of Social Security Administration microdata on one percent of the U.S. population
from 1961 to 2006. Individuals continue to ”bunch” at the convex kink the AET creates
even when they are no longer subject to the AET, consistent with the existence of earnings
adjustment frictions in the U.S. We develop a novel estimation framework and estimate in
0.23, and the fixed cost of adjustment is $152.08.
Essay 3 studies the impact of health expenditure risk on annuitization. Theoretical research
suggests that such risk can have an ambiguous influence on the annuitization decisions of
the elderly. I provide empirical evidence on this linkage, by estimating the impact of
supple-mental Medicare insurance (Medigap) coverage on the annuity demand of older Americans.
Medigap coverage has a strong impact on annuitization: the extensive margin elasticity is
0.39, the overall elasticity of private annuity income with respect to Medigap coverage is
0.56. These results are robust to controls for health, wealth, and preferences, as well as
other robustness tests. They suggest that medical expenditure risk has a large impact on
TABLE OF CONTENTS
ACKNOWLEDGEMENT . . . iii
ABSTRACT . . . iv
LIST OF TABLES . . . ix
LIST OF ILLUSTRATIONS . . . xii
CHAPTER 1 : Physician Agency, Compliance, and Patient Welfare: Evidence from Anti-Cholesterol Drugs . . . 1
1.1 Introduction . . . 1
1.2 Background on anti-cholesterol drugs . . . 7
1.3 Data . . . 8
1.4 Initial evidence on the impact of prices and advertising . . . 13
1.5 A model of doctor-patient interactions . . . 22
1.6 Estimation results . . . 34
1.7 Can better contracts reduce agency problems? . . . 39
1.8 Conclusion and directions for future work . . . 43
CHAPTER 2 : Earnings Adjustment Frictions: Evidence from the Social Security Earnings Test . . . 57
2.1 Introduction . . . 57
2.2 Policy Environment . . . 61
2.3 Initial Bunching Framework . . . 65
2.4 Data . . . 67
2.5 Earnings Response to Policy . . . 69
2.7 Estimating Elasticities and Adjustment Costs . . . 79
2.8 Conclusion . . . 91
CHAPTER 3 : Health Expenditure Risk and Annuitization: Evidence from Medi-gap Coverage . . . 102
3.1 Background on Medigap insurance . . . 106
3.2 Data: Weiss Ratings and the Health and Retirement Study . . . 108
3.3 Empirical strategy and first stage results . . . 111
3.4 Results: Medigap coverage increases annuitization . . . 118
3.5 Robustness . . . 121
3.6 Conclusion . . . 124
APPENDIX . . . 136
LIST OF TABLES
TABLE 1 : Molecule summary statistics, all years . . . 46
TABLE 2 : Multinomial logit estimates of the impact of patient price, plan price, and advertising on initial prescription . . . 47
TABLE 3 : Logit estimates of the impact of patient price, plan price, and ad-vertising on compliance . . . 48
TABLE 4 : Differential responses by capitation status . . . 49
TABLE 5 : Robustness to informational content of advertising . . . 50
TABLE 6 : Parameters of doctor’s and patient’s utility function . . . 51
TABLE 7 : Match quality distribution . . . 52
TABLE 8 : Goodness-of-fit . . . 53
TABLE 9 : Impact of agency . . . 54
TABLE 10 : Summary Statistics, Social Security Administration Master Earn-ings File . . . 100
TABLE 11 : Estimates of Elasticity and Adjustment Cost Using Sharp Change Method . . . 101
TABLE 12 : Summary statistics . . . 127
TABLE 13 : First stage results . . . 128
TABLE 14 : Correlation between instrument and regressors . . . 129
TABLE 15 : Impact of Medigap coverage on annuity income . . . 130
TABLE 16 : Impact of Medigap coverage on extensive margin of annuity demand 131 TABLE 17 : Impact of Medigap coverage on “true” annuity demand, extensive margin . . . 132
TABLE 19 : Include state-level Medicare expenditures . . . 134
TABLE 20 : Include Medicaid policy variables . . . 135
TABLE 21 : Imputed and mode prices for two plans, 2003 . . . 148
TABLE 22 : Predictive power of imputed prices . . . 149
TABLE 23 : Sample sizes and composition . . . 150
TABLE 24 : Patient summary statistics . . . 151
TABLE 25 : Robustness of initial prescription estimates to alternative samples . 152 TABLE 26 : Robustness of compliance estimates to alternative samples . . . 153
TABLE 27 : Compliance regression: robustness to alternative definitions of com-pliance . . . 154
TABLE 28 : Relationship between compliance and actual prices . . . 155
TABLE 29 : Robustness to including outside option . . . 155
TABLE 30 : LDL cholesterol reduction, by drug . . . 156
TABLE 31 : Results from the Monte Carlo Experiment: Utility Function Estimates156 TABLE 32 : Results from the Monte Carlo Experiment: Match Quality Distribution157 TABLE 33 : Robustness to CP(2) in permanent income and preferences . . . 160
TABLE 34 : Control for pre-age 65 endogenous variables . . . 161
TABLE 35 : Control for spouse’s preferences . . . 162
TABLE 36 : Exclude Medicaid recipients . . . 163
TABLE 37 : Estimates of Elasticity and Adjustment Cost Using Sharp Change Method and Disappearance of Kink at Age 70 . . . 219
TABLE 38 : Estimates of Elasticity and Adjustment Cost Using Sharp Change Method and 1990 Policy Change, Assuming no Pre-Period Bunching Attenuation . . . 220
LIST OF ILLUSTRATIONS
FIGURE 1 : Out-of-pocket and plan prices, by plan, 2008 . . . 55
FIGURE 2 : Out of sample fit for Lipitor, Zocor, and Mevacor . . . 55
FIGURE 3 : Impact of alternative contracts on compliance and patient welfare 56 FIGURE 4 : Key Earnings Test Rules, 1961-2009 . . . 94
FIGURE 5 : Histograms of Earnings, 59-73-year-olds Claiming OASI by Age 65, 1990-1999 . . . 95
FIGURE 6 : Adjustment Across Ages: Normalized Excess Mass, 59-73-year-olds Claiming OASI by Age 65, 1990-1999 . . . 96
FIGURE 7 : Adjustment Across Years: Histograms of Earnings and Normalized Excess Mass, 66-69 year olds Claiming OASI by Age 65, 1996-2004 97 FIGURE 8 : Normalized Excess Bunching by Year, 1961-2005 . . . 98
FIGURE 9 : Bunching Responses to a Convex Kink, with Fixed Adjustment Costs 99 FIGURE 10 : Relationship between Medigap and lnprice . . . 125
FIGURE 11 : Relationship between endogenous variables and lnprice . . . 126
FIGURE 12 : Distribution of prices in two plans, 2003 . . . 158
FIGURE 13 : Empirical distribution of prices in 2001 . . . 159
FIGURE 14 : Bunching Response to a Convex Kink (Frictionless Case) . . . 197
FIGURE 15 : Bunching Estimation Methodology . . . 198
FIGURE 16 : Mean Percentage Change in Earnings from Age 70 to 71, by Earn-ings at 70, 1990-1998 . . . 199
FIGURE 17 : Adjustment Across Ages: Histograms of Earnings and Normalized Excess Mass, 59-73-year-old OASI Claimants, 1990-1999 . . . 200
FIGURE 18 : Adjustment Across Ages: Histograms of Earnings and Normalized
FIGURE 19 : Adjustment Across Ages: Histograms of Earnings and Normalized
Excess Mass, 59-73-year-olds Claiming OASI by Age 65, 1983-1989 202
FIGURE 20 : Adjustment Across Ages: Histograms of Earnings and Normalized
Excess Mass, 59-73-year-olds Claiming OASI by Age 65, 2000-2006 203
FIGURE 21 : Comparison of Normalized Excess Bunching Among 62-64
Year-Olds and 66-69 Year-Year-Olds, 1982-2004 . . . 204
FIGURE 22 : Adjustment Across Ages: Histograms of Earnings, 66-69
Year-Olds, 1999-2001 . . . 205
FIGURE 23 : Adjustment Across Ages: Histograms of Earnings and Normalized
Excess Mass, 59-73-year-olds Claiming OASI by Age 65, 1990-1999 206
FIGURE 24 : Robustness to Polynomial Degree: Normalized Excess Mass by Age
and Year, OASI Claimants by 65 . . . 207
FIGURE 25 : Robustness to the Excluded Region: Normalized Excess Mass by
Age and Year, OASI Claimants by 65 . . . 208
FIGURE 26 : Adjustment by Sex: Histograms of Earnings, 59-73-year-olds
Claim-ing OASI by Age 65, 1990-1999 . . . 209
FIGURE 27 : Adjustment Across Ages: Histograms of Earnings, 59-73-year-olds
Claiming OASI by Age 65 with Self-Employment Income, 1990-1999210
FIGURE 28 : Mean Percentage Change in Earnings from Age 69 to 70, by
Earn-ings at 69, 1990-1998 . . . 211
FIGURE 29 : Probability that Earnings Move with Kink, 1990-1998 . . . 212
FIGURE 30 : Earnings Distributions by Age, OASI Claimants by Age 65, 1990-1999213
FIGURE 31 : Mortality Analysis: Mean Age at Death, 62-69-year-olds Claiming
OASI by Age 65, 1966-1971 and 1990-1999 . . . 214
FIGURE 32 : Normalized Excess Mass at Kink by Age, 1966-1971 . . . 215
FIGURE 33 : Fraction of Workers Changing Employers from Age t to Age t+1,
by Age t Earnings, 1990-1998 . . . 216
FIGURE 35 : Probability of claiming OASI in year t+1 among 61-68 year-olds in
CHAPTER 1 : Physician Agency, Compliance, and Patient Welfare: Evidence from
Anti-Cholesterol Drugs
1.1. Introduction
Imperfect physician agency arises whenever physicians fail to maximize their patients’
pref-erences, given available information. Because doctors face myriad financial incentives,
ex-plicit and imex-plicit, to provide some treatments but not others, there are many opportunities
for imperfect agency, with broad consequences. Physician incentives affect the quantity and
type of care provided (Gruber and Owings, 1996; Yip, 1998; Stern and Trajtenberg, 1998;
Hellerstein, 1998; Coscelli, 2000; Iizuka, 2007; Liu et al., 2009; Limbrock, 2011; Epstein and
Ketcham, 2012; Clemens and Gottlieb, 2013; Engelberg et al., 2013), the amount spent by
private and public insurers (Iizuka, 2012; Dickstein, 2012), and even patient health (Johnson
and Rehavi, 2013; Jacobson et al., 2013).1
Despite the many studies documenting physician agency problems, there exists little work
quantifying its welfare losses for patients or exploring whether alternative physician
con-tracts could correct it. The welfare losses include not only worse health, but also more
expensive or less desirable treatment. Quantifying the welfare losses from agency therefore
requires learning patient preferences for different treatments. This is difficult since patients
have few ways to reveal their preferences over medical treatment. Indeed, the existing
literature on the demand for healthcare does not distinguish between doctor and patient
preferences, and the resulting demand estimates recover some combination of the two.
To avoid this problem, I follow a suggestion by Ellickson et al. (2001), and focus on a unique
aspect of the prescription drug market: although patients cannot purchase drugs without
a prescription from a doctor, once they have a prescription they are free to comply with it
or not. My premise in this paper is that compliance decisions reveal patient preferences.
By separating initial prescriptions and compliance decisions, I learn doctors’ and patients’
1For recent surveys of the large literature on physician agency, see McGuire (2000), McClellan (2011),
preferences from two separate demand curves. I first provide descriptive evidence on agency
problems, then develop and estimate a structural model of doctor-patient interactions,
and use the model to quantify the welfare consequences of eliminating agency entirely or
developing contracts to better align doctor and patient preferences.
I study the market for anti-cholesterol drugs. Anti-cholesterol drugs, with $20 billion in
sales, are a large segment of the prescription drug market, itself a $320 billion sector (IMS,
2011). These drugs are important for health, reducing mortality, stroke and heart disease
(Baigent et al., 2005). Attaining these benefits requires actually taking these drugs, so
compliance is a medically important outcome in its own right.
There are several potential sources of agency problems in this market. Pharmaceutical
companies spent nearly $650 million in 2004 on promotional activity targeting physicians—
called detailing—that is intended to persuade them to prescribe new, expensive drugs.
While some of this advertising is no doubt informative, critics of detailing allege that it
skews prescriptions away from the patient’s ideal.2 Moreover, insurance companies provide
incentives, implicit or explicit, for doctors to control costs, in part by prescribing drugs that
are cheap for the insurance plan to procure. A final source of agency problems is legitimate
disagreement between doctor and patient about which drugs are medically appropriate; in
such cases, the doctor’s views may trump the patient’s wishes.
Using a large insurance claims database which features rich information on health and
healthcare utilization, I study how initial prescriptions and compliance respond to detailing
expenditures, out-of-pocket prices, and plan prices, i.e. the cost to the insurance plan of
procuring the drug. To identify patient and doctor price sensitivity, I exploit the
consid-erable variation across insurance plans in out-of-pocket prices and plan prices charged for
a given drug in a given year. To avoid the problem that patients may select plans with
generous coverage for their drug, I limit my sample to patients new to taking these drugs.
2
Thus the price variation I exploit for identification is plausibly exogenous to patient drug
preferences.
I show that the drug the doctor initially prescribes depends on out-of-pocket prices, on
detailing expenditures, and on plan prices. Of these variables, however, only out-of-pocket
prices affect the compliance decision. These results, which survive extensive robustness
tests, provide clear evidence of agency problems. A perfect agent would only respond to
variables that affect a patient’s utility, but because detailing and plan prices do not directly
affect compliance, they likely do not directly affect patient welfare.
To quantify the consumer welfare consequences of these agency problems, I must address two
challenges. First, the doctor’s initial prescription decision depends on her preferences and
her patient’s, and these two factors need to be separated. Second, the initial prescription
also likely depends on patient-drug match quality, observed by doctors but unobserved by
the econometrician. The doctor only prescribes an expensive drug if her patient has a high
match quality for it—for example, a patient with a more severe cholesterol disorder will likely
be matched to a more powerful drug. This selection problem may bias estimates of patient
preferences. My next step, therefore, is to implement a structural model that separately
identifies doctor and patient preferences, allowing for this heterogeneous, unobserved match
quality.
The model formalizes the notion that doctors write initial prescriptions but patients choose
whether to comply, and these separate decisions can be used to separately identify doctor
and patient preferences. In the model, the patient derives utility from drug consumption.
Drug utility depends on drug and patient characteristics as well as unobserved patient-drug
match quality. The patient cannot choose his preferred drug; instead, the doctor chooses
an initial prescription for him. The doctor cares about the patient’s utility but her choice
may also depend on detailing and financial incentives, as well as differential evaluation of
drug quality, and idiosyncratic factors. Physician agency is imperfect to the extent that the
the patient is free to quit treatment, to comply with the prescribed drug, or to return to
the doctor to demand a different prescription.
Since doctors make discrete choices for the initial prescription, the model resembles the
discrete choice demand models used in a growing literature that explores the industrial
organization of prescription drug markets (Stern, 1996; Ellison et al., 1997; Cleanthous,
2002; Branstetter et al., 2011; Bokhari and Fournier, 2012; Arcidiacono et al., 2012; Dunn,
2012). This literature uses standard demand estimation techniques to recover preferences
and uses the estimated demand systems to study counterfactual policies. With physician
agency problems, however, market demand data do not necessarily reveal either patient or
doctor preferences, and so these estimated parameters cannot be interpreted as preferences.
As Dunn (2012) notes, to the extent that agency problems affect choice, “the model [he
estimates] will only be an approximation to individual utility, and may be more
appropri-ately viewed as a market demand function” (p. 173). This concern applies to estimates of
patient utility in the prescription drug context, so the model I develop may be useful more
broadly by providing a way to separate doctor and patient preferences.
I estimate the model via maximum likelihood. Estimation requires integrating over the
high-dimensional match quality distribution, so I use sparse grid integration to make the
problem computationally tractable (Heiss and Winschel, 2008). To solve the identification
problem that the prescribed drug’s match quality is correlated with the drug’s
character-istics, I rely on exclusion restrictions. The characteristics of other drugs serve as natural
excluded variables, since they affect the probability of a receiving a prescription for a given
drug, but not the utility from filling it. To see how excluded variables help identification,
consider increasing the price of one drug (say, Lipitor). This increases the share of
peo-ple prescribed another drug (say, Zocor) but also changes their composition: in particular,
people who switch to Zocor because of Lipitor’s price increase have a relatively low match
quality for Zocor (or else they would been prescribed it to begin with), and so average
identifies the density of Zocor’s match quality distribution. Once this density is known, it
is straightforward to parametrically correct for the selection bias.
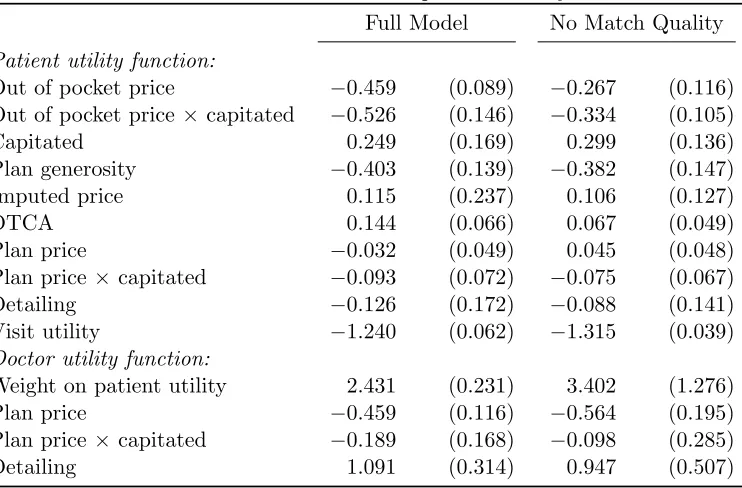
The point estimates, consistent with the descriptive results, indicate that doctors value not
only patient utility but also plan prices and detailing. For example, doctors are roughly
indifferent between a $1 increase in the monetized utility patients receive from a given drug,
and a $2.41 decrease in plan prices for that drug. Doctors also evaluate the health benefits
of drugs differently than do patients. The model therefore clearly points to imperfect
physician agency. Accounting for match quality is important; ignoring it biases patient
price sensitivity downward, by nearly half. The model fits the data well, both in sample
and in a random hold out sample.
I use the estimated model to quantify the welfare losses from agency problems. Shutting
down all agency problems, by requiring doctors to prescribe the utility-maximizing
pre-scription, increases patient utility by about 22% of total anti-cholesterol drug spending.
Compliance also rises, from 53.1% to 59.6%.3 Plan spending changes only slightly, and
so the overall impact on efficiency of eliminating agency is large and positive. Physician
agency therefore has important consequences for patient welfare, compliance, and overall
efficiency. Eliminating individual aspects of agency, however, has markedly different
ef-fects. Removing doctor’s cost-containment incentives, for example, increases plan spending
by $48 per patient per year but has only a small impact on patient welfare, so overall it
reduces efficiency. This result implies that insurance companies are setting incentives fairly
effectively: they are able to control costs without overly harming patient welfare.
Fully eliminating agency problems is likely difficult, because prescribing the patient’s utility
maximizing drug requires observing match quality. Instead, I consider easily implementable
alternative contracts to better align doctor and patient preferences. First I consider paying
3
doctors a bonus for prescribing the drug with the highest average quality net of price. This
contract encourages doctors to prescribe drugs that work well for the average patient. One
danger of such a contract is that it may encourage doctors to prescribe drugs that they
know to be a poor match, simply because they are attractive to the average patient. To
avoid this problem, I also consider contracts that pay doctors a bonus based on the ex
post compliance of their patients. Since doctors use unobserved match quality to forecast
compliance, these contracts take advantage of doctors’ private information.
Both contracts increase compliance and patient utility. Paying for compliance, by taking
advantage of the doctor’s private information, produces bigger gains for patients than
pay-ing for average quality; with strong enough incentives, it can increase compliance to over
58%, close to the agency-free level. The contracts attain only about half of the gain in
con-sumer surplus of moving to the agency-free level, however. Realizing the full gains requires
changing the prescriptions of inframarginal patients, who would comply with their current
drug but would nonetheless prefer a different one. Such patients are hard to identify and
so it is difficult to design contracts to help them. Overall, therefore, I find that agency
problems have a substantial impact on patient welfare and compliance, but fully solving
these problems is difficult with feasible contracts.
The remainder of the paper is structured as followed. Section 1.2 provides background on the
market for anti-cholesterol drugs, and Section 1.3 describes the data sources and the creation
of key variables, and contains summary statistics. Section 1.4 shows the basic evidence for
physician agency. Section 1.5 introduces the model and estimation procedure, and section
1.6 presents the point estimates, quality of fit, and impact of eliminating agency. Section
1.7 explores the impact of alternative contracts, and Section 1.8 concludes and discusses
1.2. Background on anti-cholesterol drugs
Anti-cholesterol drugs help regulate the level of cholesterol in the body.4 The most popular
class of anti-cholesterol drugs is statins, which are both effective in reducing cholesterol and
widely tolerated. The statin class contains six different molecules during my sample period.
In addition to statins, several other classes of drugs reduce cholesterol, although non-statins
are not as effective and often have worse side effects than statins. Drugs from these classes
are indicated when patients are statin-intolerant or have particular cholesterol disorders
for which statins are ineffective. Some classes can also be prescribed in combination, and
combination products may be more powerful in reducing cholesterol or targeting multiple
cholesterol problems than statins alone.
The National Cholesterol Education Program offers clear guidelines on when to prescribe
anti-cholesterol drug (Gundry et al., 2001): if a patient has high cholesterol given his
risk factors and if lifestyle intervention fails. The risk factors include cigarette smoking,
hypertension, low HDL cholesterol, family history of chronic heart disease, age (greater
than 45 for men and 55 for women), and diabetes and heart disease. The more risk factors
a patient has, the lower the cholesterol threshold at which to prescribe. Once drug therapy
begins, the report recommend that it continue indefinitely; anti-cholesterol drugs do not
permanently cure cholesterol disorders. Cholesterol drugs are therefore purely maintenance
medications: once they are prescribed, patients must keep taking them in order to realize
their benefits. This fact is critical for my interpretation of non-compliance: failing to comply
with the medication—ceasing treatment—actually indicates dissatisfaction, and not a cure.
Despite these guidelines, the report offers doctors less guidance about which drug to
pre-scribe. Talbert (2008) suggests statins as a first line therapy, but does not recommend
a particular statin. Doctors apparently have a great deal of flexibility on this margin,
especially among statins.
4
1.3. Data
I study a sample drawn from the Thompson-Reuters Marketscan databases. These databases
contain inpatient, outpatient, and prescription drug insurance claims from about 100 large,
self-insured companies. These claims include all drugs purchased and procedures performed,
as well as the prices paid, by the patient and by the insurer. The data are limited, however:
they contain very little demographic information and no information on income. Although
I observe which insurance plan each patient belongs to, I have no information on the set
of insurance plans available to him, making it impossible to model plan choice. A further
limitation is that Marketscan defines a “plan” by the benefits offered, so that if a plan
changes its benefits from year to year, the plan’s identifier changes; this rules out exploiting
within-plan, over-time variation in benefits.
I supplement the Marketscan databases with drug-by-year information on total expenditures
on direct to consumer advertising (DTCA) and detailing, from IMS health. These data are
only available for 2001-2005 and 2008-2009 so I limit the Marketscan data to these years as
well. In this section, I provide a description of the key aspects of the data. Appendix A.1
contains a more detailed description of the data, including definitions of all variables and
products.
1.3.1. Drug price imputation
From the claims data, I observe two prices in each transaction: the out of pocket price paid
by the patient, and the total amount paid to the pharmacy by the insurer and the patient,
less the out of pocket payment. I call the first price the out-of-pocket price and the second
price the plan price. The out-of-pocket price represents the actual cost to the patient of
obtaining the drug. The plan price is related to but not exactly the cost to the plan of
procuring the drug; the true cost accounts for the rebates that many insurance companies
have negotiated with pharmaceutical companies. As in all empirical work on drugs, I do
plan prices’ impact on prescribing behavior is likely mitigated by rebates, and this affects
the interpretation of my results.5
I only observe prices paid, but demand estimation requires the full menu of prices faced,
by the patient and by the plan. I therefore impute out-of-pocket and plan prices as the
average price per days supplied at the plan-year-molecule level. Some small plan-years have
zero sales for a given molecule; for these plan-year-molecules, I impute the price as the
maximum of the other prices, and in all specifications I control for an indicator for this kind
of imputation.
This imputation aggregates over three sources of price heterogeneity. First, some plans offer
discounts for bulk purchases of 90 days supplied; the imputation reflects these discounts,
yielding lower prices for plans with more generous discounts.6 Second, identical molecules
in a given plan can transact at different prices because of differences in dosage and in
branding. I average over the differences in dosage. In practice the differences in branding
are not important because when a molecule faces generic competition, branded sales are a
trivial fraction of all sales (for example, two percent for simvastatin/Zocor; see Appendix
A.1.1 for further discussion). Third, for plans which have a coinsurance or deductible for
drug coverage, the out-of-pocket price will depend on local pharmacy prices and on spending
throughout the year, and the average price will be a poor proxy for the price a given patient
faces.
The procedure therefore works best in insurance plans with formularies, in which only a
small number of out-of-pocket prices are charged. For example, a plan might charge $10 for
generic drugs, $20 for preferred branded drugs, and $40 for all other drugs. Although the
5Arcidiacono et al. (2012), however, infer rebates from pricing and demand data as well as institutional
details of the drug market. Their procedure relies on an equilibrium pricing model for pharmaceutical companies; incorporating the drug supply side with physician agency, while an interesting topic for future research, is substantially beyond the scope of this paper.
6
Marketscan databases do not contain any indicators for formulary plans, it is easy to identify
such plans from the distribution of prices paid: in formulary plans this distribution will have
very limited support, while non-formulary plans will have a dispersed price distribution.
Appendix Figure A.5 shows the empirical distribution of prices for the 24 largest plans in
2001. As the figure shows, some plans have an empirically obvious formulary: essentially
all of the claims occur at three prices. Other plans have much more dispersed prices. I
therefore define “formulary plans” as plans in which at least 80% of claims are at the top
four modal prices (since many plans have a small mass of claims with zero price), and I
limit the sample to formulary plans only. Appendix Table A.5 shows that the imputation
procedure is much more accurate for formulary than non-formulary plans.
1.3.2. Sample creation
Starting with the full dataset, I limit the sample in several ways, intended to improve data
quality and reduce endogeneity concerns. Appendix Table A.5 shows how these restrictions
affect the size and composition of the sample. To avoid off-label use, my analysis sample
consists of people with at least one chronic heart disease risk factor (as discussed in Section
1.2), who fill one or more prescriptions for a cholesterol drug, with their first fill at least six
months after entering the data. These criteria follow Dunn (2012). I further exclude people
with heart disease risk factors who fill no prescriptions for anti-cholesterol drugs because
it is impossible for me to learn about their drug preferences, since I never observe them
making a compliance decision, and this group is likely to be different in unobservable ways
from people who fill at least one prescription (since the large majority of people with no
fills are people who never received a prescription to begin with).
I limit the sample in three further ways. First, I require that people be continuously enrolled
in the Marketscan data (but possibly with different plans) for at least 12 months after their
first prescription, so if a patient’s first prescription occurs in February, I require that he be
enrolled through the following January.7 By focusing on patients with new prescriptions
7
and following them for a year only, I avoid the concern that people are selecting their drug
insurance plan based on their medication mix. Second, I require that people belong to
formulary-based insurance plans, as defined in Section 1.3.1. This restriction improves the
accuracy of imputed prices. Third, I exclude people older than 65, because in later years
these people have access to drug insurance through Medicare Part D, so the ones who retain
employer provided insurance are likely to be very different from the rest of my sample.
The final dataset consists of 296,760 people in 383 plans. Appendix Table A.5 offers a
snapshot of the sample at the time of the first prescription fill. The sample is relatively old
and male, all reflecting the characteristics of people at risk for heart disease. About
two-thirds of the sample have a claim with a diagnosis for a cholesterol disorder; the other risk
factors—diabetes, heart disease, and hypertension—are all prevalent, but not
overwhelm-ingly so.
On average people in my sample spend about $140 on cholesterol drugs per year, but $425 on
other drugs, and almost $600 on inpatient and outpatient procedures. These figures provide
further evidence that people are unlikely to choose their insurance plan based on the price
of particular anti-cholesterol drugs (conditional on plan generosity), since cholesterol drug
spending represents a small share of out-of-pocket spending.
People belong to large plans, with over 92,000 claims per plan; the median plan has 4,482
claims. For the most part, prices paid are close to the modal prices defined in Section 1.3.1.
98% of claims in these plans are at one of the top four modes, suggesting that prices are
accurately imputed. About 25% of patients belong to capitated plans, comparable than
the national average of about 22% during this time period (Kaiser Family Foundation and
Health Research and Educational Trust, 2012). Statins are the clear majority of drugs
prescribed, with a market share of about 80%.
Patients comply with their initial prescription—the first drug the doctor prescribes—about
52% of the time. Here compliance is defined as refilling at least 180 days supplied of the
initial prescription in the first 330 days, with no fills of another anti-cholesterol drug. If the
patient fills a prescription for another drug, but still has at least 180 days supplied, I say
that he has switched; on average patients switch 12% of the time.8
1.3.3. Molecule-level summary statistics
Table 1.8 shows molecule-level summary statistics, pooling all years of data. The table
reveals large differences across molecules in their initial prescription probabilities. The
blockbuster Lipitor captures nearly 40% of the market, and Zocor takes almost a quarter;
no other molecule has even 10% market share. Despite its popularity, Lipitor is far from
the most expensive drug, to plans or patients, ranking behind Zocor, Pravachol, and the
Bile Acid Resins (BARs). The non-statins, Fibrate, Niacin, and BARs, have fairly low
market shares, individually and collectively. Zetia/Vytorin, a relatively new product meant
to complement statins, also has a fairly low market share.
It is natural to think that the most heavily prescribed drugs are the best drugs, as viewed
by patients and as reflected in compliance. If so, then Lipitor and Zocor should have the
highest compliance rates. While compliance for these molecules is high, they rank behind
Mevacor, the third most popular drug by initial prescription rate. In general there is much
more compression in the compliance rates than in the initial prescription rates, and only
Mevacor stands out as having especially high compliance. Patients are also unlikely to
switch away from Mevacor, although Zocor and Lipitor’s switch rates are not far behind.
The next three columns of the table provide a hint about Lipitor and Zocor’s high initial
prescription rates but unexceptional compliance rates. Lipitor was under patent protection
for the entirety of my sample period, and Zocor for the first half (until 2006); the
paten-tholders Pfizer and Merck spent heavily on promotion for these products. But their patent
protection yielded high prices, both to plans and especially to patients. Mevacor’s patent,
8
also held by Merck, expired in 2001, so Mevacor’s price, to patients and to plans, was much
lower throughout the sample period.
These descriptive statistics therefore suggest that doctors face a trade-off between drugs
patients like (including low cost drugs), and drugs that are heavily detailed. Working
against this effect is the fact that heavily detailed drugs are expensive for insurance plans
to procure, and plans may provide incentives for doctors to prescribe cheaper drugs.
In the rest of the paper, I move beyond these descriptive statistics in two ways. First, I
use a regression framework to tease apart the impact of patient prices, plan prices, and
advertising on initial prescriptions and refill rates. Because prices and advertising likely
depend on drug quality, these regressions include molecule-specific means that account for
most of the differences in quality across drugs. Second, I develop a structural model of
doctors’ prescription decisions and patients’ compliance, switch, and quit decisions. The
model accounts for the fact that doctors do not match patients to drugs randomly. In
particular, although patients on Mevacor are more compliant than patients on Lipitor, it
does not necessarily follow that switching patients from Lipitor to Mevacor would increase
compliance; perhaps Lipitor is the best match available for patients who are prescribed it.
1.4. Initial evidence on the impact of prices and advertising
In this section, I present empirical evidence testing a specific hypothesis about imperfect
agency: that doctors but not patients value detailing and plan prices. Under this hypothesis,
these variables will affect initial prescription decisions but not compliance. To investigate
decisions:
P r(dprescribed) = (1.1)
expαIpoopitd +AdtdγI+pplanitmθI+XiβI+µId
P
jexp
αIpoop
itj +AdtjγI+pplanitj θI+XiβI+µIj
,
P r(Complyid|dprescribed) = (1.2)
exp
αCpoopitd +AdtdγC +pplanitd θC+XiβC +µCd
1 + exp
αCp
itd+AdtdγC+pplanitd θC +XiβC+µCd
,
where poopitd is the out of pocket price to individual iin year t of molecule d, Adtd a vector
of molecule-year level advertising characteristics, and pplanitd the price to the plan. The
additional controls, Xi, are person-level characteristics including health status and plan
generosity, and µd is a drug-specific mean. Note that the person-level characteristics Xi
drop out of the initial prescription regressions.
These equations do not account for the interdependence between compliance and initial
prescriptions, but they offer a transparent look at the major patterns in the data, i.e. the
relationship between compliance probabilities or initial prescriptions, and drug prices and
advertising. Ultimately these relationships will be critical for identifying the full model.
A strong and robust relationship among prices, compliance, advertising, and prescriptions
indicates that features of the data, and not primarily the modelling choices, drive the model.
1.4.1. Sources of price and advertising variation
Equations (1.1) and (1.2) are essentially demand equations, and the usual concerns about
identification of demand systems apply here. In particular, pricing and marketing variables
may be correlated with product quality. In the insurance context, this is less of a problem,
especially for out-of-pocket prices, which are not set to maximize profits from drug sales.
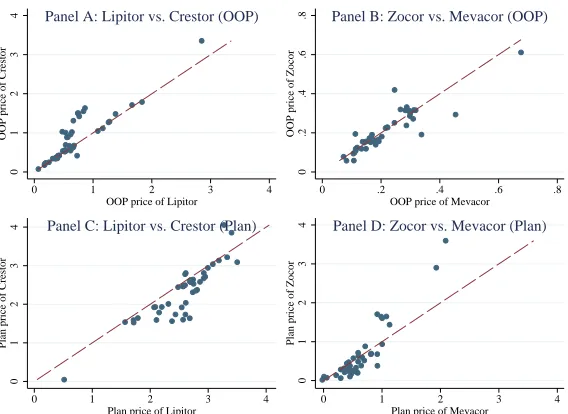
Indeed, there is considerable variation in both out-of-pocket prices and plan prices for a
for two generic drugs (Zocor and Mevacor) and two on-patent drugs (Lipitor and Crestor)
for each plan in 2008. Drug prices differ widely, as do relative prices and even the relative
rankings of prices in plans (indicated by prices being on both sides of the 45-degree line).
The plan price variation represents idiosyncratic differences in pharmacy prices and in deals
negotiated between pharmacies and insurance companies. This out-of-pocket price variation
reflects differences in formulary placement—some plans place Lipitor on the middle tier
and others on the top tier. Although patients may select plans with generous coverage
for their preferred drugs, this is unlikely in my sample of patients who are new to taking
anti-cholesterol drugs.
A second source of out-of-pocket price variation represents a threat to identification: overall
plan generosity. Patients who are more likely to comply with their medication may select
into more generous plans, which would bias my estimated price sensitivities. In my preferred
specifications, I therefore control for plan generosity, defined as the average price of branded
anti-cholesterol drugs in the plan. Alternatively I control for plan fixed effects, which absorb
all aspects of plan generosity.9
Although there is considerable price variation in the data, and this price variation may
be uncorrelated with patient or doctor preferences, the advertising variation is much more
limited, only at the molecule-year level. Much of the advertising variation is related to
patent status: Zocor, Mevacor, and Pravachol all experience a decline in advertising as they
go off patent. Crestor and Zetia’s advertising, however, likely reflects perceived product
quality: initial clinical trials showed that these drugs had a large impact on cholesterol,
but later research suggested that these cholesterol gains did not translate into reductions
in mortality, heart attack, or stroke, Advertising expenditures on these drugs initially rises
and then falls, following this pattern of clinical results. Overall, I cannot separate easily
separate these sources of variation—driven by quality or by market structure—and so the
advertising coefficients should be interpreted with caution.
9
A separate identification issue arises in the compliance regressions. Because doctors may
match patients to drugs on the basis of (unobserved) match quality, patients who are
pre-scribed a relatively high price drug are likely to have a relatively high match quality (or
else the doctor would have prescribed a cheaper drug). Thus by conditioning on drug
selec-tion, I end up with a biased sample. The model developed in Section 1.5 below explicitly
addresses this selection problem. Despite the bias, the reduced form estimates here are still
informative, since the bias is towards zero. The point estimates reported here can be viewed
as lower bounds (in absolute value).
1.4.2. Results for initial prescription choice
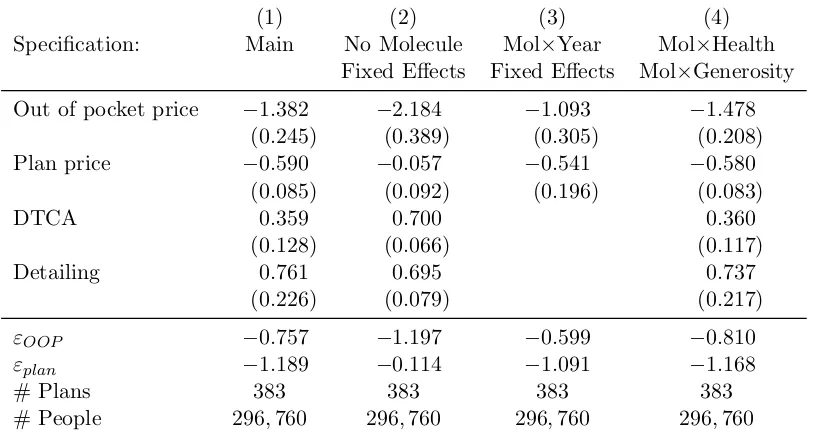
The results for the initial prescription regressions are in Table 1.8. The main specification,
presented in column (1), shows that patient prices, plan prices, and detailing all affect the
initial prescription decision, even conditional on molecule fixed effects. The standard errors,
here and throughout the paper, are heteroskedasticity robust and clustered on insurance
plan, the level of variation for most of the independent variables.10 The coefficient on patient
price is about twice as large as on plan price, but because patient prices are typically much
less than half plan prices, the elasticity of initial prescriptions with respect to plan prices,
-1.189, is about fifty percent larger than the elasticity with respect to out-of-pocket price,
-0.757. Nonetheless the results clearly indicate that both prices affect the initial prescription
decision.
Both DTCA and detailing have a clear impact on initial prescriptions, although the impact
of detailing is about twice as large as DTCA’s, comparable to the impact of plan price. The
coefficient on detailing, 0.761, gives the impact on drug utility of a one standard-deviation
increase, about $110 million. Pharmacies dispensed 52.7 million prescriptions for Lipitor
in 2009, implying that increasing advertising by about $1 per prescription has a similar
10
impact on prescription probabilities to reducing price by $0.61 per prescription.
These results rely on the identification assumption that prices and advertising are
uncorre-lated with quality. Molecule fixed effects are intended to control for quality, so in column
(2) I gauge their importance by removing them from the specification. The results are
strikingly different. The coefficient on plan price falls to -0.057, a statistically insignificant
tenth of its original level. The coefficients on DTCA is much larger, and the coefficient on
detailing slightly smaller. These changes are consistent with the endogeneity of prices and
advertising: higher quality drugs are more expensive to plans and more heavily advertised.
Perhaps surprisingly, however, the coefficient on out of pocket price becomes more negative,
not less, and about twice as large in absolute value. But out of pocket prices are set by
insurance companies, not drug companies, so they need not be positively correlated with
quality. The regression results suggest that out-of-pocket prices are negatively correlated
with average drug quality, consistent with the possibility that insurance companies place
“best-in-class” branded drugs such as Lipitor (which has a relatively low price) in a preferred
position on their formulary, while placing less effective drugs on higher tiers.
The results in column (2) suggest that the molecule fixed effects control for important
aspects of drug quality, but to the extent that drug quality is changing over time, they
may be inadequate. In column (3) I therefore include molecule-by-year fixed effect, which
control for all within-year aspects of drug quality. Because advertising is measured at the
molecule-year level, it is collinear with these fixed effects, so this specification drops the
advertising variables. While adding molecule fixed effects has a very large impact on
out-of-pocket and plan price sensitivity, the impact of the molecule-year fixed effects is small,
suggesting that the molecule fixed effects account for most of the endogeneity problems. In
the context of prescription drugs, this is perhaps not surprising, since drug characteristics
essentially do not change over time, although clinical knowledge evolves.
The final columns further test the robustness of the relationship between initial prescription
implicitly controls for all factors that vary across people but not across drugs within person,
so it is not necessary to control, for example, for type of insurance plan, health status, or
plan generosity. Nonetheless if patients in different insurance plans have different tastes for
drugs, and face different drug prices, then the coefficients on the price variables could be
picking up this taste heterogeneity. In column (4) I include a full set of molecule-by-health
status fixed effects (i.e. all the interactions between molecule fixed effects and sex, age risk,
cholesterol, diabetes, hypertension, and heart disease) as well as a full set of interactions
between molecule fixed effects and plan generosity, allowing people in more generous plans
to have differential tastes for each drug. These additional fixed effects do not meaningfully
change the point estimates.
1.4.3. Results for the compliance decision
The estimates in Table 1.8 are difficult to interpret because a positive coefficient on a
variable could arise for two reasons: doctors have a direct taste for prescribing cheaper
or more heavily advertised drugs, or patients prefer such drugs, and doctors take patient
preferences into account in prescribing drugs. To help distinguish between these hypotheses,
Table 1.8 shows the analogous results for patients’ compliance decision, estimated via logits.
Since it is unlikely that patients comply with their prescriptions out of regard for their
doctor’s utility, I interpret these specifications as reflecting patient preferences over drug
characteristics.
The main specification in column (1) includes the price and advertising variables, as well as
molecule fixed effects, plan generosity, and an indicator for imputed price. The results show
clear and statistically significant out-of-pocket price sensitivity. The coefficient, -0.498,
im-plies an elasticity of -0.141. Aside from out-of-pocket price, however, the coefficients look
qualitatively unlike the initial prescription results: plan prices and detailing have essentially
no impact on patients’ compliance decisions, and even DCTA has a small and insignificant
effect. These results therefore suggest that plan prices and detailing affect doctor’s
It is especially interesting that plan price is uncorrelated with the compliance decision. If
plan prices were highly correlated with quality and did not otherwise affect compliance,
then we would expect a positive coefficient on them. Instead, the zero coefficient suggests
that these prices are not terribly endogenous.
The identifying assumption behind these regressions is that the price and advertising
varia-tion is uncorrelated with patients’ underlying compliance propensities. Two main threats to
identification are that patients with higher utilization tendencies select more generous plans,
with lower prices, and that better drugs have higher prices and more advertising, Both of
these threats would bias the price coefficient towards positive values. I attempt to address
them by controlling for molecule fixed effects and average plan generosity. In column (2)
I remove the controls for plan generosity, and in column (3) I remove the molecule fixed
effects. As expected, plan generosity is correlated with compliance propensity, so removing
the plan generosity controls increases the coefficient on out of pocket price. Removing the
molecule fixed effects, however, has a dramatic effect. It nearly doubles price sensitivity,
and makes the advertising variables change sign. It also makes the plan price coefficient
significantly negative. These results suggest that while advertising is highly correlated with
quality (as patients perceive it), out of pocket prices are negatively correlated with it. This
negative correlation could arise if insurance companies put the consensus best drug (e.g.
Lipitor and Zocor) on the first or middle tier of the formulary, but put lower quality branded
drugs on the top tiers.
In column (4) I add richer controls for plan generosity by controlling for plan fixed effects.11
Controlling for plan fixed effects increases out-of-pocket price sensitivity considerably (and
also increases the coefficient on detailing, although it remains insignificant). These results
suggest that out-of-pocket prices are correlated with plan compliance propensity, in ways
not captured by my generosity measure. Somewhat surprisingly, the results here imply that
people in plans with low prices have low compliance tendencies. The results continue to
11
shiw the basic story, however, that compliance responds to out-of-pocket prices but not to
plan prices or detailing. Adding molecule×year fixed effects in column (5) or a full set of
interactions between molecule fixed effects and health and molecule fixed effects and plan
generosity, in column (6) does not alter this conclusion.
1.4.4. Further robustness
The results in Tables 1.8 and 1.8 show robustness to alternative and increasingly detailed
controls. It is possible, however, that my results are driven by my sample selection
pro-cedure, my price imputation propro-cedure, or the definition of compliance (requiring at least
180 days supplied). In Appendix A.2, I present additional robustness tests to address these
issues. The basic patterns are robust to looking at people in non-formulary plans; to looking
at people in plans in which all available drugs have at least 10, 25, or 50 claims; to using
actual rather than imputed prices in the compliance decision; and to defining compliance as
requiring 90, 120, 150, 210, 240, 270, 300, or 330 days supplied. Finally, the initial
prescrip-tion equaprescrip-tion estimates are similar if I include an outside opprescrip-tion—i.e., no prescripprescrip-tion—in
the choice set.
1.4.5. Differential effects by capitation status
The results suggest that doctors but not patients respond to plan price. I do not observe
any details about doctors’ contracts with insurance companies, so it is difficult for me to
explore the mechanisms that might generate this response. I do, however, observe plan
capitation status. Doctors of patients in capitated plans are the residual claimants for
medical expenditures, so they likely face true financial incentives to control costs. I therefore
reestimate equations (1.1) and (1.2), but looking separately at doctors in capitated and
uncapitated plans.
The results in Table 1.8 confirm that capitated doctors respond to plan prices, providing
suggestive evidence that plan prices reflect doctor’s incentives to control costs. These results
different: out-of-pocket price sensitivity is much higher, and the detailing response different
between these plans.
1.4.6. Agency or Information?
My preferred interpretation of the results so far is that they point to two physician agency
problems. Doctors are more likely to prescribe heavily detailed drugs, but patients are
no more likely to comply with prescriptions for these drugs. Doctors also shy away from
prescribing drugs that are expensive to procure (even conditional on the price to the patient),
but patients have no particular aversion to such drugs. These distortions imply that doctors
do not prescribe the compliance maximizing or patient utility maximizing drug.
This view of the facts suggests that preferences change between the initial prescription and
the compliance decision. An alternative interpretation, however, is that information has
changed: at the time of the initial prescription, it is unclear how the patient will react to
a certain drug, and plan prices and advertising contain information useful for forecasting
that reaction. After the patient fills an initial prescription, though, there is no longer useful
information in advertising or prices, and so they do not predict choice.
While I cannot rule out this interpretation entirely, two considerations make it unlikely.
First, as Figure 1.8 shows, the plan prices vary at a very fine level—within drug and year,
across plans. If they contained meaningful information about match quality, then this
information would also have to vary across plans. This could happen if plans worked out
lower prices for drugs that they thought their patients would be especially likely to use.
But I focus on patients new to taking these drugs, and in some specifications I control
for health×molecule fixed effects (so that the information would have to be orthogonal
to observable health status). Thus it is unlikely that information drives the relationship
between initial prescriptions and plan prices.
Detailing, on the other hand, undoubtedly does contain useful information. Indeed, a great
to control, in a blunt way, for new information: I control for the number of times each drug
is mentioned in publications indexed by PubMed in each year, as well as the lag number of
mentions.12 Controlling for each drug’s publication count and its lags does not meaningfully
affect the coefficient on detailing, suggesting that the response to detailing corresponds to
more than just information.
Finally, in a recent paper, Carrera et al. (2013) argue that doctors are imperfectly informed
about patient preferences and the prices patients face. Although such information problems
are likely present, it is unlikely that they could explain my results, since they would suggest
that doctors respond too little to out-of-pocket prices, whereas I find that doctors respond
too much to other variables. I conclude that these results provide initial evidence for agency
problems in the market for anti-cholesterol drugs.
1.5. A model of doctor-patient interactions
In this section I develop a model of doctor-patient interactions in the market for
anti-cholesterol drugs. The model will let me study how compliance and welfare change in
counterfactuals as I shut down all or some agency problems, or implement alternative
con-tracts to more closely align doctor and patient preferences.
The model formalizes the notion that compliance decisions reveal patient preferences, as
initial prescriptions do for doctors. The model builds on the reduced form regressions in
two ways. First, the model allows for doctors matching patients with drugs on the basis of
unobserved match quality. This matching can induce a correlation between match quality
and prices that might bias the estimated price sensitivity; the model corrects for this bias.
Second, the model allows patients to switch drugs as well as comply or not. The patient
switches if the doctor prescribes him a drug that he dislikes, when there are better options
12
available. Switching lets patients veto a very poor initial prescription, and provides some
protection against agency. Accounting for switching is therefore important for measuring
the welfare consequences of physician agency correct. The model builds on the work of
Ellickson et al. (2001), who develop but do not estimate a model of doctor-patients conflicts
of interest in which compliance decisions identify patient preferences. I extend their model
to allow for patient switching, and take it to the data.
The model is meant to capture physician agency in a simple way that nonetheless lets
me study welfare in counterfactuals. It abstracts from several rich features of the market,
including uncertainty and learning about match quality, the process of patients matching to
doctors, and decision making by pharmaceutical companies, insurers, and pharmacies (and
therefore treats all prices and product offerings as endogenous). Exploring these aspects of
the market is beyond the scope of this paper, but an important and interesting avenue for
future work.
1.5.1. Model details
Timing I model doctor patient interactions as a two-period game. In the first period,
the patient (he) visits the doctor (she) for the first time, she writes a prescription, and
he fills it. In the second period, the patient decides whether to comply, visit the doctor
to switch drugs, or quit. If he visits the doctor, she must write a prescription for a new
drug, which the patient must fill. The periods are unequal length: the first period action
reflects a single month’s purchase, but the second period reflects 11 months of purchase and
non-purchase. The second period decision in the model can be viewed as a reduced form
for a more complete dynamic model in which the patient decides every month whether to
fill his prescription, visit the doctor, or not take the drug.
Drug preferencesDoctor’s and patient’s action-specific utilities derive from the patient’s
utility from drug consumption. Patientiobtains utility from consuming drugdas follows:
α measures price sensitivity, pid is the price to patient i of drug d, and XidP is a vector of
patient or drug characteristics affecting utility from consumption, including for example
patient’s health status or direct to consumer advertising. µPd is average drug quality as
patients perceive it and ξid is a patient-drug specific match term. µPd is meant to reflect
the average benefit of taking an anti-cholesterol drug, so it includes both average side
ef-fects/tolerability and effectiveness. People differ, however, in both how well they tolerate
drugs and in how they value the health benefits of anti-cholesterol drugs. The idiosyncratic
aspect of match quality, ξid, reflects these patient-drug interactions. I assume that ξid is
normally distributed with mean zero and variance σd2, independent across drugs.
Indepen-dence imposes many restrictions on substitution patterns, but these substitution patterns
are not the focus of my counterfactuals (as they would be if I were interested in changes in
competition or market structure).
ComplianceThe patient’s utility from complying with his prescription consists of the drug
utility plus an idiosyncratic shock:
uPc(ξi, d, εic) =ud(ξid) +εic, (1.4)
whereεc is a type I extreme value shock. εc reflects the many factors affecting compliance
not included in drug utility. For example, it includes the convenience cost of filling a
pre-scription. While I assume that εic is part of people’s utility, an alternative interpretation
is that εic reflects whether patients remember to fill their prescription. This
interpreta-tion is consistent with the view, articulated forcefully by Baicker et al. (2013), that most
non-compliance is a mistake. So long as these mistakes are uncorrelated with drug
char-acteristics, however, they do not affect my empirical analysis. In the welfare calculation, I
calculate consumer surplus both treatingεic as part of patient utility and not.
Switching and quittingIf the patient visits the doctor to switch, the doctor writes a new
prescription which the patient fills. The patient does not know what drug the doctor will
drugd0 when the initial prescription isdand match qualityξ. Visiting the doctor to switch
yields a net benefit or costθs, an idiosyncratic type I extreme value shockεs, as well as the
expected utility of the new prescription, with the expectation taken over the prescription:
uPs(ξi, d, εis) =θs+
X
d0
˜
P r(d0|ξi, d)ud0(ξid0)
!
+εis= ¯us(ξd, d) +εis (1.5)
Mean utility from quitting is normalized to zero, and quit utility consists only of a type I
extreme value shock.
uPq(ξi, d, εiq) =εiq. (1.6)
As with the compliance error εic, εis and εiq can be interpreted either as idiosyncratic
convenience shocks or as mistakes, and I provide welfare calculations below for both
inter-pretations.
Initial prescription and second drug choiceThe doctor’s utility from prescribing drug
d, as an initial prescription or a second drug choice, is
uM Dd (ξd) =wud(ξid) +XidM DβM D+αM Df inid+µM Dd +εM Ddt . (1.7)
The doctor places a weight w on the patient’s utility from consuming the drug, ud, but
she also values other drug characteristics, XidM D (e.g. detailing) and financial incentives
f inid, which may be explicit or implicit. Finally the doctor may disagree with her patient
about average match quality, for example because doctors may disagree with patients about
the relative importance of side effects and efficacy. µM Dd is a drug-specific intercept in the
doctor’s utility function to reflect such disagreements. εM Ddt is a type I extreme value shock,
and thetsubscript indicates that the first and second prescription are governed by different
draws.
I do not directly observef inid. Instead I observe plan prices, the prices to plans of procuring