Using Prospect Theory To Explain The
Setting Of The Expected Rate Of
Return On Pension Assets
Pei-Hui Hsu, California State University, East Bay, USAYao-Min Chiang, National Taiwan University, Taiwan
ABSTRACT
Studies often use earnings management to explain the setting of assumed expected rate of return (ERRs) on pension assets in the defined benefit plans. In this paper, we argue that a manager’s risk attitude toward investment may have an impact on setting ERRs on pension assets. Prospect theory is a theory of decision making under risk and is used to explain firms’ behavior with regard to earnings management. We believe that prospect theory also can be used to explain firms’ setting of ERRs, which critically depends on managers’ expectations regarding risky investment. Empirical evidence shows that prospect theory can explain how firms set their ERRs on pension assets. We find that firms in the high-ERR group are risk-averters; that is, there is a positive relationship between risk and return. On the other hand, firms in the low-ERR group are risk-lovers and have an inverse risk-return relationship. Our findings contribute to the literature by suggesting that managers’ risk attitudes also affect the choice of ERR.
Keywords: Defined Benefit Plan; Assumed Expected Rate of Return; Earnings Management; Prospect Theory
1. INTRODUCTION
ASB 1985 requires corporations to disclose long-term expected rates of return on pension assets. In 2003, the FASB issued SFAS 132R, requiring the disclosure of the percentage composition of pension assets among major investment categories. Chuk (2011) argues that, under pension accounting rules, the composition of pension assets is one of the key determinants of assumed expected rate of return (ERR) on pension assets. However, firms tend to assume unrealistically high rates of return for pension assets. Borrus and Dwyer (2004) and Revell (2002) express concern that ERRs are too high when comparing returns on pension assets with historical returns in equity and in bond markets.
Comprix and Muller (2011) point out that ERR is one of three important assumptions when measuring net pension obligation and net periodic pension cost.1 An increase in ERR lowers pension cost. Bergstresser, Desai, and Rauh (2006) show that firms have considerable discretion when choosing ERR for a pension plan. They argue that managers opportunistically choose higher ERRs in order to boost reported earnings.2 This earnings management argument may provide a plausible explanation for a firm’s choice of high ERRs. However, what is a firm’s incentive to set ERRs in order to manage earnings? We suspect that managers’ risk attitude toward investment may affect the choice of ERRs.
Prospect theory, based on a psychological model, explains an individual’s behavior when presented with risky alternatives (Kahneman & Tversky, 1979). The theory suggests that when choosing among risk alternatives, individuals behave as if they evaluate outcomes as changes from a reference point. The reference point is usually an
1 SFAS 87 requires the use of three important assumptions to measure the net pension obligation and net periodic pension cost: the expected rate
of return (ERR), the salary inflation rate (SIR), and the discount rate (DR).
2 When computing pension expense, the assumed expected return on pension assets (ERR) offsets the service cost and interest costs. A higher
ERR assumption results in higher reported earnings.
aspect of the decision maker’s current state. Thus, for a given outcome, the increase in utility is greater when the outcome increases from below the reference point to above the reference point. For example, if $0 is the reference point, $1 is large compared with nothing, while $100 is not significantly different from $10 (McDermott, 2001).
Burgstahler and Dichev (1997) and Degeorge, Patel, and Zeckhauser (1999)3 find that earnings slightly less than zero occur less frequently than expected and earnings slightly greater than zero occur more frequently than expected. This evidence is consistent with the prediction of prospect theory; managers are willing to take more risk (e.g., to use discretionary accruals to manage earnings upward) when earnings number is below a reference point (zero earnings level).4
Prospect theory is a theory of decision making under risk and is used to explain firms’ behavior with regard to earnings management. We believe that prospect theory also can be used to explain firms’ setting of ERRs, which critically depends on managers’ expectations regarding risky investment. We argue that managers’ utility derives from a reputation for exceptional ability in selecting investments instead of deriving from wealth. Since ERRs reflect the efficiency of pension investment, higher ERRs reflect a manager’s superior ability to identify high-return investments, enhancing the manager’s reputation. Therefore, if a manager’s preferences are consistent with prospect theory, they will yield the greatest utility (from obtaining a good reputation) when choosing ERRs above a reference point. Managers should therefore be willing to accept more risk when selecting pension investments to boost ERRs above such a threshold.
One critical issue when applying prospect theory is determining the reference point. The reference point is usually some aspect of the decision maker’s current stage and is likely to be perceptually salient (Degeorge, Patel, & Zeckhauser, 1999). For example, Degeorge et al. (1999) and Burgstahler and Dichev (1997) demonstrate a relatively smoothed single-peaked, bell-shaped distribution except in the area of zero earnings. Based on such graphic evidence, both studies suggest that a zero earnings level should serve as threshold. Following these studies, we plot a histogram of ERRs and find that many firms report ERRs just at the median ERR value, and firms with ERRs less than the median ERR value occur much less frequently than expected, given the smoothness of the remainder of the distribution (see Figure 1). The median value of ERRs is a natural choice of threshold in our analysis.5
According to Fiegenbaum (1990), the S-shape prospect theory suggests that the decision maker will be risk-averse above the reference point and risk-seeking below it. This implies that the relationship between risk and return is positive above the reference point and negative below it. Following Fiegenbaum’s approach, we empirically test the asymmetric risk-return relationship for ERRs. We calculate mean (as RETURN) and standard deviation (as RISK) of ERRs of each firm for 2003–2012. We divide the firms into two groups: “high-ERR group” and “low-ERR group.” To examine whether there is an asymmetric risk-return relationship between these two groups, we regress “RISK” on “RETURN” for each group. Consistent with the predictions of prospect theory, we find that firms in the high-ERR group are risk-averters; that is, there is a positive relationship between risk and return. On the other hand, firms in the low-ERR group are risk-lovers and have an inverse risk-return relationship. In addition, we find that the absolute value of coefficients for the low-ERR group is greater than for the high-ERR group, suggesting an asymmetric risk-return association between these two groups of firms.
These findings contribute to the literature on pension accounting. Prior studies generally suggest that managers take advantage of their discretion in setting assumed ERR and that using ERR to manage earnings appears to be effective because the market does not fully impound pension information (Picconi, 2006). We provide evidence showing that the prospect theory provides incentives for the setting of ERRs, and therefore, contribute to the literature by suggesting that managers’ risk attitudes also affect the choice of ERR.
3 Burgstahler and Dichev (1997) find that managers use accounting discretion to avoid reporting small earnings decreases. Degeorge et al. (1999)
also find evidence of earnings management that exceeds each of three thresholds: reported positive profits, sustained recent performance, and the meeting of analyst expectations.
4 Prospect theory suggests that individuals derive value from gains and losses with respect to a reference point, rather than from absolute levels of
wealth. Thus, for a given increase in wealth, the increase in value is greatest when the wealth of the individual increases from a loss to a gain. If stakeholder preferences are consistent with prospect theory, a manager has an incentive to report earnings exceeding zero to obtain more rewards.
5 In the sensitivity tests, we also use the median value of ERRs for each year and the median value of ERRs in prior years as thresholds. All
The paper is organized as follows: Section 2 describes the study’s motivation and the relevant FASB accounting standards for defined benefit (DB) pensions. Section 3 discusses the data, empirical methods, and results. Section 4 presents the conclusion.
2. INSTITUTIONAL BACKGROUND OF PENSION ACCOUNTING
In the last few years, defined benefit (DB) pension plans have gained increased attention due to the relatively large value of their liabilities and assets. A firm sponsoring a DB pension plan has a liability equaling the present value of all future payments due its employees. Since DB pension plans involve various estimates, and small changes in estimates can result in large changes in pension plan value, the funded status of pension plans is extremely volatile, making pension accounting an area for potential earnings management.
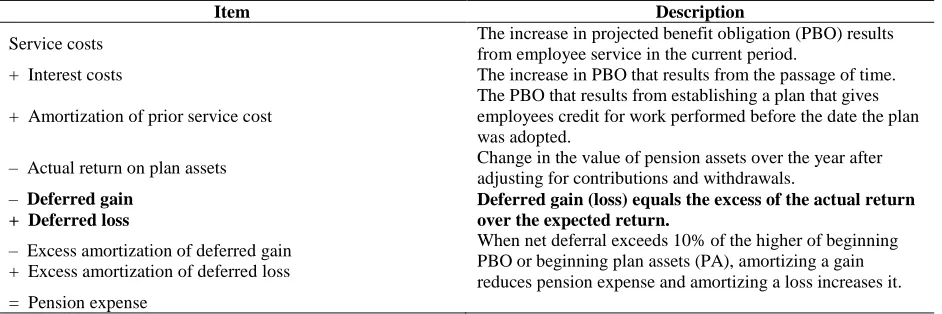
According to pension accounting rules, the assumed expected return on pension assets (ERR) offsets service and interest costs when computing pension expense, such that a higher ERR assumption results in higher reported earnings. Changes in the ERR can result in economically significant changes in reported earnings. For example, Bergstresser et al. (2006) suggest that at median pension sensitivity, an increase in the assumed return from 7% to 10% will boost reported income by over 2%. See Table 1 for a summary of pension accounting.
Table 1: Elements of Pension Expenses
Item Description
Service costs The increase in projected benefit obligation (PBO) results
from employee service in the current period.
+ Interest costs The increase in PBO that results from the passage of time.
+ Amortization of prior service cost
The PBO that results from establishing a plan that gives employees credit for work performed before the date the plan was adopted.
– Actual return on plan assets Change in the value of pension assets over the year after adjusting for contributions and withdrawals.
– Deferred gain + Deferred loss
Deferred gain (loss) equals the excess of the actual return over the expected return.
– Excess amortization of deferred gain + Excess amortization of deferred loss
When net deferral exceeds 10% of the higher of beginning PBO or beginning plan assets (PA), amortizing a gain reduces pension expense and amortizing a loss increases it. = Pension expense
Since managers enjoy significant discretion in setting ERRs used for the calculation of pension cost on the income statement, prior studies examine managers’ incentive to manage earnings through ERRs. Bergstresser et al. (2006) find that managers use higher ERRs when they prepare to acquire other firms, when they are near critical earnings thresholds, and when their managers exercise stock options. This evidence suggests that managers may take advantage of their discretion in selecting ERRs when they have strong incentives to manipulate earnings.
Consequently, in 2003 the SEC issued SFAS 132R requiring annual disclosure of the percentage composition of major categories of pension plan assets (Financial Accounting Standards Board (FASB), 2003). The issuance of SFAS 132R allows users to assess the reasonableness of the ERRs with respect to the riskiness of the pension assets’ investment categories. However, concern about ERRs still exists. For example, by using survey data, Amir and Benartzi (1998) suggest that the ERR is only “weakly” related to assets allocation.6 In addition, the median value of ERRs during 2003-2012 was still as high as 8%, which is higher than the suggested 6.5% to 7% (Revell, 2002). All of this evidence shows that firms set their ERRs to manage earnings.
6 However, Chuk (2012) finds that firms take actions to more closely align the ERR with asset allocation following SFAS132R. The implied
3. DATA, EMPIRICAL METHODS, AND RESULTS
3.1 Data
Our sample consists of the Compustat universe of U.S. firms with DB pensions. More specifically, we employ non-missing and non-zero ERRs for our 2003–2012 sample period. We restrict the sample to post-2003 to focus on the post-SFAS 132R period. We also delete observations that do not disclose the percentage composition of pension assets among major categories. Lastly, we winsorize ERRs to the first and 99th percentiles to reduce the effect of outliers. This sample selection yields 15,705 firm-year observations.
Table 2: Summary Statistic
N Mean Std Dev Q1 Median Q3
2003 1,068 8.19 0.91 8.00 8.50 8.75
2004 1,618 7.87 1.16 7.50 8.00 8.50
2005 1,779 7.77 1.23 7.50 8.00 8.50
2006 1,773 7.65 1.25 7.20 8.00 8.50
2007 1,675 7.61 1.23 7.00 8.00 8.50
2008 1,610 7.56 1.25 7.00 8.00 8.40
2009 1,588 7.43 1.31 7.00 7.90 8.25
2010 1,550 7.31 1.34 6.86 7.65 8.00
2011 1,550 7.13 1.37 6.50 7.50 8.00
2012 1,494 6.86 1.43 6.25 7.25 7.80
Total 15,705 7.52 1.30 7.00 8.00 8.50 This table reports summary statistics of ERR for each year. The sample includes 15,705 firm-year observations with non-missing ERR disclosure from the Compustat database. We winsorize ERR to the first and 99th percentiles to reduce the effect of outliers. We also delete observations that do not disclose pension assets allocation or that have zero ERR.
Table 2 provides summary ERR statistics. The median (mean) value of ERRs is 8 (7.52) for our sample. There has been a downward movement of ERRs since 2003, which is consistent with Chuck (2012). The median (mean) value of ERR was 8.50 (8.19) in 2003 and decreased to 7.25 (6.86) in 2012.
This histogram is based on 15,705 firm-year observations with non-missing ERR disclosure from the Compustat database. We truncate ERR to the first and 99th percentiles to reduce the effect of outliers. We also delete observations with zero ERR.
Before empirically testing prospect theory, we first plot the histogram of ERRs. Figure 1 shows the histogram. Two conclusions can be drawn. First, the histogram of ERRs is a half bell-shaped distribution. That is, ERRs below the median occur much less frequently than would be expected given the smoothness of the remainder of the distribution. Second, there is a large jump in the distribution at the median value of ERRs. In the region below the median, the distribution appears to have been “shaved," with some density mass transferred to the median or slight above it. This distribution of ERRs is similar to the distribution of earnings documented by prior studies (Burgstahler & Dichev, 1997; Degeorge et al., 1999; Shen & Chih, 2005).
We then plot the histogram of ERRs for each year in Figure 2 to determine whether there is any change in distribution over time. We still observe clear jumps at the median ERR value for each year from 2004 to 2010, which is consistent with our prediction. However, in recent years, the distribution of ERRs is much closer to a normal distribution. For example, in 2011 and 2012, the distribution is smooth, and no significant spike can be observed. This may suggest that SFAS132R effectively has recently dragged down some “too high” reported ERRs, or that firms set lower ERRs to reflect lower market returns in those years.
3.2 Empirical Methods and Results
Fiegenbaum (1990) applied the prospect theory to explain the risk-return relationship in 85 industries. We use the means and standard deviations of ERR to present RETURN and RISK, respectively. We calculate mean (as RETURN) and standard deviation (as RISK) of ERR for each firm during 2003–2012.
Firms are divided into two groups, “high-ERR group” and “low-ERR group,” based on the median of ERRs. We then regress RISK on RETURN for each group:
Li i L
L
i
RETURN
RISK
(1)Hi i H
H
i
RETURN
RISK
(2)where i denotes firm, and L and H represent low- and high-ERR groups, respectively. α is the constant term, and β is the coefficient that measures the tradeoff between risk and return.
Based on Fiegenbaum’s (1990) argument to prove prospect theory, the sign on βL should be negative, the sign on βL should be positive, and the absolute value of βL must be greater than that of βh. That is, if we find βH > 0 > βL and |βL| > |βH|, then we cannot reject the hypothesis that the given ERR threshold is a reference point corresponding to prospect theory.
Table 3: The Test of Prospect Theory: Whole Sample Median ERR as Threshold
High ERR Low ERR
RETURN 0.043** –0.052***
[2.056] [–4.743]
Observations 1,024 1,271
R2 0.004 0.017
This table presents empirical results when using the whole sample median value of ERR during 2003–2012 as threshold. The dependent variable is RISK, which is estimated as the standard deviation of ERR of each firm during 2003–2012. Return is estimated as the mean value of ERRs of each firm for the 2003-2012 periods. Firms are classified into the high-ERR group if RETURN is above the median value of ERR, while firms are classified into the low-ERR group if RETURN is below the median value of ERR.
Table 3 presents the estimation results of Equations (1) and (2). Consistent with our prediction, the coefficient on RETURN is 0.043 (with p-value < 0.01), which is significantly positive in the high-ERR group. The coefficient on RETURN, –0.052 (with p-value < 0.01), is significantly negative in the low-ERR group. These results clearly demonstrate that firms above the ERR threshold are risk averters. On the other hand, firms below the ERR threshold are risk lovers. In addition, the absolute value of βL is greater than the absolute value of βH, which is also consistent with the prediction of prospect theory.
Table 4: The Test of Prospect Theory: Alternative Threshold Measurements
Prior Year Median ERR as Threshold Current Year Median ERR as Threshold High ERR Low ERR High ERR Low ERR RETURNi 0.047*** –0.067*** 0.031* –0.055***
[2.860] [–6.833] [1.667] [–5.250]
Observations 948 1,347 1,108 1,187
R2 0.009 0.034 0.003 0.023
We further conduct robustness tests by using two other measures of threshold: prior year's median value of ERRs and current year's median value of ERRs. Table 4 presents the results. All of the findings are consistent with our prediction. The coefficients on RETURN are always significantly negative in low-ERR group while the coefficients on RETURN are consistently positive in high-ERR groups. Consistent with the theory, the absolute value of βL is always greater than the absolute value of βH, suggesting asymmetric behavior below and above the threshold.
4. CONCLUSIONS
In this paper, we examine whether prospect theory can explain managers' choice of ERR for pension assets. Because the higher the setting of ERR, the higher the reported net income, prior studies generally suggest that managers take advantage of ERR to manage earnings. We attempt to provide an alternative explanation for the setting of ERRs, namely the prospect theory.
The setting of ERRs depends on managers' expectations regarding risky investment. We believe that managers will be more willing to take more risk on their pension investment to boost ERRs above a threshold. Consistent with our prediction, we find that there is a clear jump in ERR distribution at the median value of ERRs; i.e., more firms report ERR just at the median value, while fewer firms report ERRs just below the median of ERRs. We also empirically test the asymmetric risk-return relationship, finding that firms below the ERR are risk lovers and firms above ERR are risk-averters. We determined that our results are robust by using alternative measures of thresholds.
Overall, we provide evidence to show that prospect theory can be used to explain the choice of ERRs.
ACKNOWLEDGEMENT
Pei-Hui Hsu gratefully acknowledges financial support from the College of Business and Economics China America Business and Education Center, California State University, East Bay.
AUTHOR INFORMATION
Pei-Hui Hsu is an assistant professor at California State University, East Bay. She earned her PhD in Accounting from University of Oregon in 2013. E-mail: [email protected] (Corresponding author)
Yao-Min Chiang is a professor at National Taiwan University. He earned his PhD in Finance from the University of Iowa. E-mail: [email protected]
REFERENCES
1. Amir, E., & Benartzi, S. (1998). The expected rate of return on pension funds and asset allocation as predictors of portfolio performance. The Accounting Review, 73(2).
2. Bergstresser, D., Desai, M., & Rauh, J. (2006). Earnings manipulation, pension assumptions, and managerial investment decisions. The Quarterly Journal of Economics, 121(1), 157-195.
3. Borrus, A., & Dwyer, P. (2004). Pumped-up pension plays. Bloomberg Businessweek Magazine, October 24.
4. Burgstahler, D., & Dichev, I. (1997). Earnings management to avoid earnings decreases and losses. Journal of Accounting and Economics, 24(1), 99-126.
5. Chuk, E. C. (2012). Economic consequences of mandated accounting disclosures: Evidence from pension accounting standards. The Accounting Review, 88(2), 395-427.
6. Comprix, J., & Muller, K. A., III. (2011). Pension plan accounting estimates and the freezing of defined benefit pension plans. Journal of Accounting and Economics, 51, 115-133.
8. Fiegenbaum, A. (1990). Prospect theory and the risk-return association: An empirical examination in 85 industries. Journal of Economic Behavior & Organization, 14(2), 187-203.
9. Financial Accounting Standards Board (FASB). (2003). Employers' disclosures about pensions and other postretirement benefits. Statement of Financial Accounting Standards 132R. Norwalk, CT: FASB. 10. Kahneman, D., & Tversky, A. (1979). Prospect theory: An analysis of decision under risk. Econometrica:
Journal of the Econometric Society, 263-291.
11. McDermott, R. (2001). Risk-taking in international politics.
12. Picconi, M. (2006). The perils of pensions: Does pension accounting lead investors and analysts astray? The Accounting Review, 81(4), 925-955.
13. Revell, J. (2002). Beware the pension monster. Fortune-European Edition, 146(11), 53-57. 14. Shen, C., & Chih, H. (2005). Investor protection, prospect theory, and earnings management: An