A COMPARATIVE STUDY OF FOOTBALL PLAYERS AT DIFFERENT LEVELS OF PERFORMANCE IN RELATION TO THEIR PHYSICAL FITNESS COMPONENTS.
Dr. Parveen Kumar,
Assistant Prof., Deptt. Of Physical Edu.
G.N.Khalsa College Of Physical Education, Yamuna Nagar.
Dr. Ranbir Singh
Assistant Prof., National College Of Physical Education, Chupki.
ABSTRACT : The study was conducted to find out the comparison in Physical Fitness Components
between performances at different levels of Football players. The sample consisted of 300 Football
players were selected as subjects. To assess the Physical Fitness variables of Football players AAPHER
Physical Fitness test was used. Data was analyzed through F-test and it was found that higher level of
players were better in their performance.
Keyword: Fitness, Football, Player
INTRODUCTION
Physical fitness is the motor abilities of men namely strength, speed, endurance, flexibility and
coordinative abilities. These motor abilities and their complex form (e.g. strength, endurance, explosive
strength etc.) are the basic pre-requisites for human action. Each sport requires a different type and
level of physical condition and as a result a different type of training or condition is required for different
sports (Singh H. 1991).
Physical fitness is an important component of total fitness. The term ‘Physical fitness’ means
efficient performance in exercise or work and a reasonable measure of skill in the performance of
selected physical activities.
Andrew (1976) conducted the study to compare the performance level and physical fitness of
Canadian High School basketball player as indicated by the performance on the AAPHER Physical Fitness
Test Battery. The study revealed that the players who are physically better fit have significantly higher
STATEMENT OF THE STUDY
“A Study of Football Players at Different Levels of Performance In Relation to their Physical Fitness Components.”
OBJECTIVES OF THE STUDY
To compare the independent and interactive effects of Physical Fitness Components of football
players playing at different levels of performance.
HYPOTHESES OF THE STUDY
Keeping in view the objectives of the study the following hypotheses have been formulated:-
There may exist significant difference between Physical Fitness Components of football players
playing at different levels of performance.
METHODOLOGY
The subjects of the present study consisted of 300 male football players in the age group of
18-25 years from Haryana, Punjab and Chandigarh, who have participated in inter-college, inter-university
and national level tournaments in football. To select the subject, the random sampling technique was
used.
To collect the data for physical fitness, the AAPHER Physical Fitness test batteries were used:
1. Speed : 50 Yard Run
2. Strength: Sit ups
3. Agility & Flexibility: Shuttle Run
4. Power & Balance: Pull ups
5. Muscular Strength: Standing Broad Jump
6. Endurance: 600 yard Run
Statistical Design:-
In order to achieve the objective of the present study, the investigator has applied ANOVA to made
Table No. 1
Mean Scores and SD of Football Players of the Physical Fitness components at different levels i.e. inter-college, intervarsity and national level
Variables Inter-college Inter-varsity National
Mean SD Mean SD Mean SD
1. 50 Yards dash 7.2238 .22186 6.7584 .23946 6.0230 .26277 2. Sit ups 34.01 4.197 34.78 4.153 35.19 4.067 3. Shuttle run 12.5363 .46447 12.1107 .44285 11.2280 .45465 4. Standing Broad jump 25.72 3.063 26.58 3.072 26.70 3.177 5. Pull ups 10.98 1.429 11.14 1.589 11.49 1.425 6. 600 Yard run 97.246 10.5750 95.758 11.1146 93.706 8.5235
Mean values of physical fitness component test for all three different groups of football players
have been presented in Table 1 for the purpose of analysis and understanding. The significance of
difference in the mean value on all the physical fitness components of football players have been
presented below.
To know the significant difference and to examine the data, the one way analyses of variance for
each variable separately have been computed. The procedure of the computing as given by Clark and
Clark (1972) were used in analyzing the data. The f-ratio obtained by one way analysis of various was
tested for significance at the .05 level of confidence. In one way, analysis was tabulated F- .05 df. 2/297
for significant difference between groups equal to 3.03.
FINDINGS
Finding pertaining to each of the physical fitness components of groups, which were subjected
to the analysis of variance and mean difference method have been given below:
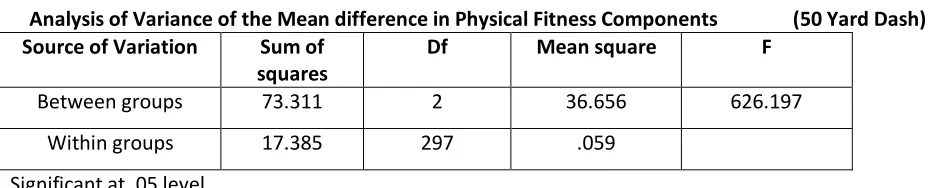
Table No. 2
Analysis of Variance of the Mean difference in Physical Fitness Components (50 Yard Dash) Source of Variation Sum of
squares
Df Mean square F
Between groups 73.311 2 36.656 626.197
Within groups 17.385 297 .059
Table reveals that there exists significant difference in physical fitness components (50 Yard
Dash) among the three groups of football players. The f-ratio obtained were much higher value than the
value of 3.03 required of F-ratio to be significant at .05 level with 2/297 degree of freedom.
Table No. 3
Analysis of Variance of the Mean Differences in Sit Up (Physical fitness Test Variables) among the Three Groups of Football players
Source of variation Sum of square
Df Mean square F
Between groups 71.780 2 35.890 2.095 Within groups 5088.740 297 17.134
Not significant at .05 level
Table 3 of this Section indicates the results of analysis of variance of mean difference in Sit ups.
The F-ratio obtained 2.095 were below the value than the value required of F-ratio which is not
significant at .05 level with (2/297) degree of freedom.
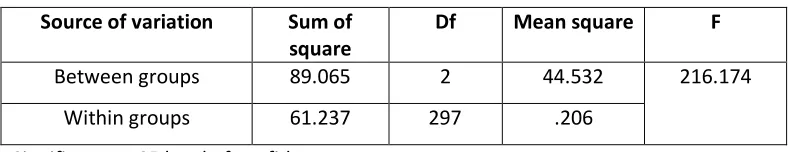
Table No. 4
Analysis of Variance of the Mean Difference in Shuttle Run
Source of variation Sum of square
Df Mean square F
Between groups 89.065 2 44.532 216.174
Within groups 61.237 297 .206
Significant at .05 level of confidence
Table 4.2.6 indicates that there is significant differences in Shuttle Run as obtained F-ratio of
Shuttle run 216.174 which was higher value than the value 3.03 required of F ratio to significant at .05
level with (2/297) degree of freedom.
Table No. 5
Analysis of Variance of the Mean Difference in Standing Broad Jump
Source of variation Sum of square
Df Mean square F
Between groups 57.638 2 28.819 3.991*
Within groups 2861.974 297 9.636
Table 4 shows the significant differences in standing Broad Jump among the three groups of
footballer. The F-ratio as obtained 3.991 is higher than the tabulated value 3.03 required to F-ratio to be
significant at .05 level with 2/297 degree of freedom.
Table No. 6
Analysis of Variance of the Mean Differences in Pull Ups Among the Three Groups of Footballers
Source of variation Sum of square
Df Mean square F
Between groups 13.722 2 6.861 3.120*
Within groups 653.197 297 2.199
Significant at .05 level
From table 4.2.10, it is observed that there were significant differences of pull ups between the
groups of footballers. The F-ratio obtained 3.120 is much higher than the tabulated value 3.03 required
of F-ratio to be significant at .05 level with 2/297 degree of freedom.
Table No. 7
Analysis of Variance of Mean Differences in 600 Yard Run/Walk (Physical Fitness Test) among the three Groups of Football Players
Source of variation Sum of square
Df Mean square F
Between groups 631.882 2 315.941 3.077*
Within Groups 30493.468 297 102.672
Significant at .05 level of confidence
Table 6 depict that there were significant differences in 600 yard run/walk test of physical
fitness variables, as obtained F-ratio of 600 yard run walk is 3.077, which is a higher value than the value
3.03 required for F-ratio to be significant at .05 level with (2/297) degree of freedom.
DISCUSSION OF FINDINGS
From the analysis of data, it is evident that football players at national level perform better
in physical fitness test than their counterparts at intervarsity and inter-college level. The significant
college and inter-university level football players. Physical fitness is one of the important ingredients for
performance at higher level in any kind of sports.
REFRENCES :
Andrew, Barry Craig. (1976). “Physical Fitness level of Canadian and South African School Boys.”
Dissertation Abstracts International, vol. 36, No.9.
AAHPER Youth Fitness Test Manual, Washington, AAHPER Publication 1976. N.E. and Fitness Department
1201, Sixteen St. N.W. Washington DC 1967 & 1973 Publication.Gray H. (1956). Body Built in
Football Players. Research Quarterly, 7:37.
Clark and Clark (1972). Relationship Between Standing Broad Jump and various Maturational
Anthropometric and Strength test of 12 years old Boys. Research Quarterly 35-3, Oct. 1964.
Singh Harnint (1991). “Relationship of social emotional adjustment to performance in 500 Mt. Race.