University of New Hampshire
University of New Hampshire Scholars' Repository
UNH Stormwater Center
Research Institutes, Centers and Programs
2-20-2016
MS4 Resource: BMP Cost Estimates
Karen Mateleska
EPA Region 1
Follow this and additional works at:
https://scholars.unh.edu/stormwater
This Article is brought to you for free and open access by the Research Institutes, Centers and Programs at University of New Hampshire Scholars' Repository. It has been accepted for inclusion in UNH Stormwater Center by an authorized administrator of University of New Hampshire Scholars' Repository. For more information, please [email protected].
Recommended Citation
1
MEMORANDUM
DATE:
February 20, 2016
TO:
Opti-Tool TAC
FROM:
Karen Mateleska, EPA Region- I
SUBJECT
:
Methodology for developing cost estimates for Opti-Tool
Introduction
EPA – Region I offered to provide TetraTech with BMP cost information for the New England Stormwater Management Optimization Tool (Opti-Tool). The goal was to include the latest available information that would accurately reflect capital costs for select BMPs installed in the New England region. This document describes the approach used to determine these values.
The unit cost estimates originally developed as part of a 2010 study were used as the basis/starting-point for the cost estimates for the Opti-Tool. This study, entitled Stormwater Management Plan for Spruce Pond Brook Subwatershed, was produced by the Charles River Watershed Association (CRWA). The full report can be viewed at:
http://www.crwa.org/hs-fs/hub/311892/file-636820515-pdf/Our_Work_/Blue_Cities_Initiative/Scientific_and_Technical/CRWA_Franklin_Plan.pdf . This subwatershed in the Town of Franklin (in eastern Massachusetts) was selected, in part, because it represented one of the many communities in the watershed that would be required to reduce nutrient (phosphorus) loads in stormwater runoff as part of EPA’s Phase II MS4 General Stormwater Permit and a TMDL for Nutrients in the Upper/Middle Charles River. The cost estimates developed in the study can predominantly be attributed to CRWA and both Rich Claytor and Nigel Pickering of Horsley Witten Group (CRWA et al. 2010). The development of these costs was based on a literature review of BMP cost information and Claytor’s extensive experience working in this field with Massachusetts
communities. These values were originally reported in Appendix B of the aforementioned CRWA document. Those cost estimates have also been used in additional stormwater studies supported by EPA – Region I, including the Sustainable Stormwater Funding Evaluation for the Upper Charles River Communities of Bellingham, Franklin, and Milford, MA (2011). (That report can be viewed at:
http://www.epa.gov/region1/npdes/charlesriver/pdfs/20110930-SWUtilityReport.pdf) Before simply relying on the CRWA cost estimates, additional research was conducted of publicly available (online) resources to determine if more recent BMP cost information for the New England region was available. These resources included:
EPA’s LID webpage: http://water.epa.gov/polwaste/green/
2
New England Environmental Finance Center: http://efc.muskie.usm.maine.edu/
UNC Environmental Finance Center’s Catalog of Finance Publications on Green Infrastructure Approaches to Stormwater Management (This spreadsheet provides a catalog of 46 publications related on green infrastructure for stormwater management that have finance relevance; Several of the sources from the catalog were reviewed for this document) :
http://www.efc.sog.unc.edu/reslib/item/catalog-green-infrastructure-and-stormwater-finance-publications
Houle, et al.Comparison of Maintenance Cost, Labor Demands, and System Performance for LID and Conventional Stormwater Management:
http://www.unh.edu/unhsc/sites/unh.edu.unhsc/files/Houle_JEE_July-2013.pdf
University of New Hampshire Stormwater Center’s Forging the Link: Linking the Economic Benefits of LID and Community Decisions: http://www.unh.edu/unhsc/forging-link-topics
Center for Neighborhood Technology’s Green Values Stormwater Tool Box: http://greenvalues.cnt.org/which included the Green Values Calculator:
http://greenvalues.cnt.org/national/calculator.php
Water Environment Research Foundation (WERF): User’s Guide to the BMP and LID Whole Life Cost Models, Version 2.0: www.werf.org/bmpcost
Low Impact Development Center: http://www.lowimpactdevelopment.org/
ECONorthwest’s The Economics of Low-Impact Development: A Literature Review:
http://www.econw.com/our-work/publications/the-economics-of-low-impact-development-a-literature-review/
Drexel University’s Low Impact Development Rapid Assessment (LIDRA Model)
http://www.lidratool.org/home/publications.aspx
A review of these resources did highlight the multitude of variables that can impact the cost of installing LID BMPs and the variety of cost analysis methods that can be used when assessing the cost
effectiveness of various LID storm water controls. For example, many of the resources emphasized that costs tend to be site specific. Costs often differ significantly among different geographical locations, depending upon labor and material expenses and the constraints of a particular site. Unfortunately, most of the aforementioned resources highlighted projects outside of the New England region (with the exception of the articles by Houle of the UNHSC and New England Environmental Finance Center.)
EPA’s recent (2013) report entitled Case Studies Analyzing the Economic Benefits of Low Impact Development and Green Infrastructure Programs listed the 7 different types of economic analyses that were represented by the 13 case studies highlighted in the report. These ranged from the simplest form of economic analysis (i.e., the capital cost assessment) to more robust forms, including the life cycle cost assessment. Whole life-cycle costs would provide a more accurate estimate of the cost of installing, operating, maintaining, and replacing a project (i.e., BMP) throughout its expected lifetime. However this type of analysis requires solid estimates for capital, land purchase, O&M, and other related costs.
3
entirely fruitless. Jamie Houle of the UNHSC did provide extremely valuable information on capital and maintenance costs for various BMPs that have been tested at the UNHSC. Cost estimates for a
particular BMP available from both the CRWA study and UNHSC were discussed among Mark Voorhees of EPA, Jamie Houle of UNHSC, and Karen Mateleska of EPA, and a best professional judgment decision was made.
The recommendation at this time is to use a combination of the CRWA cost estimates and UNHSC costs estimates as the basis for the Opti-Tool BMP cost estimates, and to use a modified capital cost
assessment (which includes a fixed percentage for Design and Contingency Costs) as well as a separate field for maintenance hours (from the UNHSC). The details supporting this approach are described below.
Overview of Scope and Approach
According to a draft memo, dated 6/20/14 from Tetra Tech to EPA Region I, the current SUSTAIN BMP Cost function has seven major individual components, using a formula that would likely be useful in a more detailed design mode. For purposes of simplicity, EPA Region I is proposing the following cost function formula for the tool’s “planning” mode:
General Cost Function Formula = Storage Volume of BMP* (ft3) X Cost Estimate for BMP ($/ft3)
X Adjustment Factor
* Storage Volume of BMP is more accurately defined as (Design) Physical Storage Capacity of BMP; See Section A below for more details
Initially, the intention was to include the preliminary Operations and Maintenance (O&M) costs in the general formula (page 3) by simply multiplying the formula results by our Preliminary O & M costs. However, such an approach would only include one year’s worth of operations and maintenance, which could have been misleading because it would not have reflected the true life cycle cost of the BMP (i.e., assume life cycle of 20 years). However, simply including the 20 year life cycle cost (O&M cost *20) in the above formula would have greatly increased the cost value and perhaps have created
misconceptions about BMP use and affordability.
Therefore, the subcommittee decided to include the anticipated operation and maintenance hours required for each BMP per year instead. This parameter was included as a completely separate field in the Opti-Tool. The rationale was that Opti-Tool users need to understand that operation and
maintenance impact the overall cost-effectiveness of BMPs and should be considered when selecting a BMP. Including O&M hours (instead of costs) as a separate field, would still highlight this important consideration for stormwater managers.
4
A. Storage Volume and Proposed Cost Estimate Values
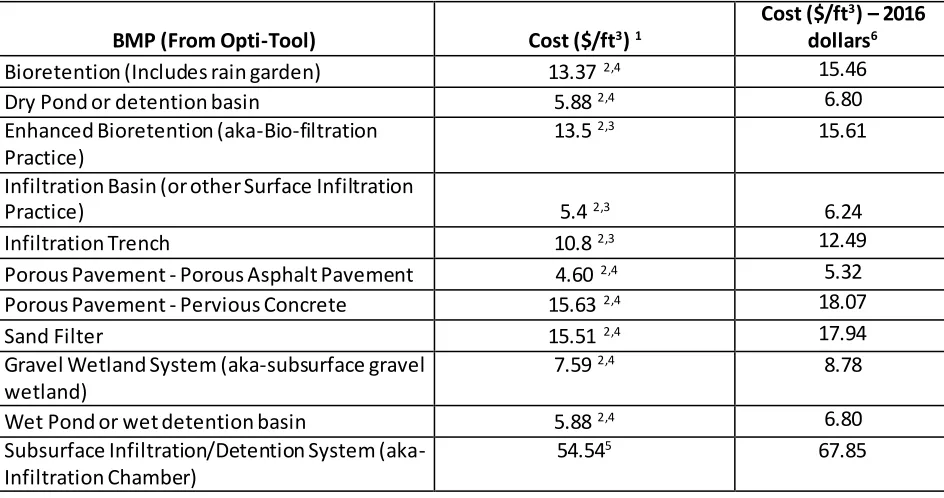
As highlighted above, the general cost function formula used in the Opti -Tool consists of 3 factors: the BMP storage volume, the proposed BMP storage volume cost estimate, and the adjustment factor. The first two factors will be covered together in this memo because they are so closely lin ked. Table 1 below summarizes the proposed BMP cost estimates for the Opti -Tool.
Table 1: Proposed BMP Cost Estimates for Opti-Tool
BMP (From Opti-Tool) Cost ($/ft3) 1
Cost ($/ft3) – 2016 dollars6
Bioretention (Includes rain garden) 13.37 2,4 15.46
Dry Pond or detention basin 5.88 2,4 6.80
Enhanced Bioretention (aka-Bio-filtration Practice)
13.5 2,3 15.61
Infiltration Basin (or other Surface Infiltration
Practice) 5.4 2,3 6.24
Infiltration Trench 10.8 2,3 12.49
Porous Pavement - Porous Asphalt Pavement 4.60 2,4 5.32
Porous Pavement - Pervious Concrete 15.63 2,4 18.07
Sand Filter 15.51 2,4 17.94
Gravel Wetland System (aka-subsurface gravel wetland)
7.59 2,4 8.78
Wet Pond or wet detention basin 5.88 2,4 6.80
Subsurface Infiltration/Detention System (aka-Infiltration Chamber)
54.545 67.85
1Footnote: Includes 35% add on for design engineering and contingencies
2 Costs in 2010 dollars
3 From CRWA Cost Estimates
4 From UNHSC Cost Estimates; Most of original costs were from 2004 and converted to 2010 dollars using U.S.
Department of Labor (USDOL). (2012). Bureau of Labor Statistics consumer price index inflation calculator. http://www.bls.gov/data/inflation_calculator.htm
5 From Cost Estimate of MA TT Rizzo Project (2008 Dollars)
6 2010 costs were converted to 2016 values to adjust for inflation. The ENR Cost Index Method was used for this
conversion.
Table 1 includes all of the BMPs that are included in the Opti-Tool. The unit costs represent the dollar amount ($) per cubic foot of storage volume (ft3), where the storage volume reflects the (design)
5
by a water quality flow rate as opposed to a water quality volume.) This unit cost per storage volume captured by a BMP differs from other (perhaps more traditional) methods that can be used. By choosing to use the unit cost per storage volume instead of volume of water treated, we are trying to eliminate confusion over what the actual dimensions of the BMP will be for the costs being
estimated. Additionally, this use of the unit cost per storage volume is consistent with the approach used in developing the BMP performance curves (used in the Opti -Tool) where the x-axis is the actual physical storage capacity to hold water. Lastly, expressing the unit costs in this manner will benefit users who are simply interested in using the unit costs (outside of the Opti-Tool) by eliminating the step of modeling hydrology and routing the water through the BMP, which can yield widely varying results depending on modeling approach and supporting assumptions. Attachment A describes the method used in calculating the design storage volume for each of the selected BMPs.
Also, each unit cost per storage value represents the capital cost of construction/installation of the BMP and includes a 35% design/engineering/contingency (D & E) cost. This 35% fixed percentage of the total construction cost follows a general “rule of thumb,” often used by consulting firms. Based upon a conversation between Mark Voorhees and Jamie Houle (two members of the Opti-Tool cost
subcommittee), a decision was made to include this D&E cost. The values in Table 1 do not include the cost of purchasing any land, nor does it include any O&M costs (which is discussed in more detail in a subsequent section). Therefore, each unit cost in Table 1 that was based on the CRWA’s 2010 values was calculated by multiplying the relevant BMP cost by 1.35.
Since the CRWA study did not include cost estimates for porous pavement or sand filters, which are BMPs included in the Opti-Tool, relevant data was obtained from Jamie Houle of the University of New Hampshire Stormwater Center (UNHSC). He also provided additional cost estimates (as denoted by Footnote 4 in Table 1) for some of the other BMPs included in the tool. UNHSC can provide valuable data because they have been directly involved with the engineering, design and construction of
numerous LID controls, as well as evaluating multiple stormwater treatment systems over multiple years at their primary field research facility in Durham, N.H. Since they could provide cost information for both porous asphalt pavement and pervious concrete, separately, the general category of porous pavement was divided into the aforementioned two sub-categories.
It should be noted that the costs used for the Opti-tool assume linearity, which will both allow for and
6
Since UNHSC typically calculates the capital costs per cubic foot (ft3) treated, using WQv, Jamie Houle
converted the costs to represent the capital costs per BMP storage volume (ft3). This was necessary so
the capital cost data would be consistent with the method used in the Opti-Tool. Also, all of the costs were converted to 2010, and ultimately 2015, dollars. As with the CRWA costs, the UNHSC capital costs were already adjusted to include the 35% design/engineering/contingency (D & E) cost. Details of all of these calculations, and any other assumptions made, are presented in Attachment B.
When developing cost estimates, another topic for consideration was whether or not to address the issue of inflation. CRWA’s BMP cost estimates were based on capital costs from 2010. As previously stated, UNHSW’s cost estimates have also already been converted to constant 2010 dollars using consumer price index inflation rates [U.S. Department of Labor (USDOL) 2014].1 Therefore, there was
the option of converting all of these 2010 costs to 2016 costs, using the U.S. Department of Labor’s consumer price index inflation calculator. However, another suggestion was made to use the ENR Cost Index method to adjust for inflation instead because it more closely tracks construction work. At least one New England state (i.e., Vermont) also uses the ENR Cost Index method, so this could provide some consistency, as well. Therefore, the decision was made to ultimately convert all of the costs to 2016 values using the ENR Cost Index method. These values are reflected in Table 1.
To use the index, one calculates the quotient of the current index number (based on the month and year of current date) divided by the index number from a given date (e.g., June of 2010). Since the month was not known for the 2010 costs, the month of June was used as an estimate. This assumption was used because it falls mid-way between the construction season and would likely provide a reasonable estimate. Once the quotient was calculated, it was multiplied by the construction cost (found in the middle column in Table 1, above) to provide the 2016 construction cost value
B. Cost Adjustment Factor
Since the cost of installing a BMP will vary depending on the specific site location, the TAC
subcommittee believed it was important for the Opti-Tool to include a scalable cost adjustment factor. The proposed cost estimates for the Opti-Tool (in Table 1) are all based on a Cost Adjustment Factor of 1. However, each Opti-Tool user has the option to choose and enter into the tool a cost adjustment factor that is appropriate for their site. This will adjust the storage volume cost function in the Opti -Tool.
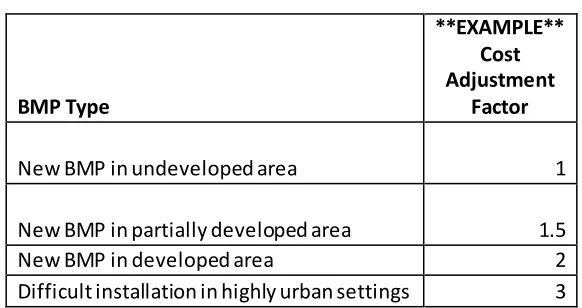
For example, the CRWA report included the cost factors summarized in Table 2.
1 Reference: U.S. Department of Labor (USDOL). (2014). Bureau of Labor Statistics consumer price index inflation
7
Table 2: Example of Cost Adjustment Factors
BMP Type
**EXAMPLE** Cost Adjustment
Factor
New BMP in undeveloped area 1
New BMP in partially developed area 1.5
New BMP in developed area 2
Difficult installation in highly urban settings 3
(Source: Table 4 of Appendix B of CRWA's Spruce Pond Brook Subwatershed Project for Town of Franklin)
The assumption made was that it would cost more to install a new BMP in a developed area (with more site constraints) than it would cost to install the same BMP in a previously undeveloped area. So in the above example, the cost adjustment factor would be 2 for installing a BMP in a previously developed area versus a cost adjustment factor of 1 for installing a BMP in an undeveloped area.
It should be noted that Table 2 (above) provides just one example of adjustment factors. The factor should be flexible enough so that another location (or Opti-Tool user) can adjust it, as needed. For example, the Charles River Watershed (in eastern Massachusetts) used an adjustment factor of 2 for installing a BMP in a developed area, while the State of Vermont uses an adjustment factor of 1.4 to estimate the cost of installing a BMP for existing development.
C. Maintenance (O&M) Costs
Originally, one goal was to include Operation and Maintenance (O&M) costs as part of the cost estimates for the Opti-Tool. These O&M costs would help to provide a more realistic reflection of the long-term expenses of structural storm water controls, which is obviously critical in the practical, real-world implementation of BMPs. However, it is difficult to obtain accurate maintenance costs and they will be highly variable depending on the size, location and equipment needed to perform long-term O&M.
This point was highlighted by a key finding in EPA’s recent (2013) publication, Case Studies Analyzing the Economic Benefits of Low Impact Development and Green Infrastructure Programs. The report indicated that only a small percentage of the entities that implement LID and GI approach for stormwater
management conduct economic analyses due to the “uncertainties surrounding costs, operation and maintenance (O&M) requirements, budgetary constraints, and difficulties associated with quantifying the benefits provided by LID/GI” and the need “to obtain better estimates of the O&M costs associated with different types of LID/GI projects” was a key finding of the report.
8
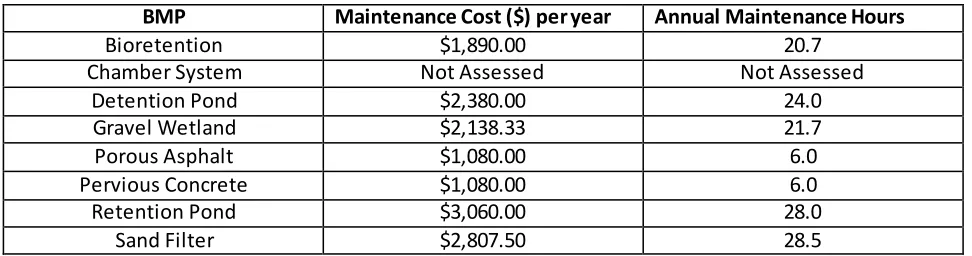
the concern that the O&M costs were not scaleable. For example, initial O&M costs for each BMP were based on the cost of operation and maintenance per year per acre of IC treated. Scaled differences such as the annual O&M costs for treating 0.5 acres of IC or 2 acres of IC have not been evaluated and may or may not result in a simple linear relationship. Yet the Opti-Tool costs subcommittee also realized the importance of including some maintenance parameter in order to initiate the conversation on the importance of accounting for O&M to maintain the functionality of the BMPs. Therefore Table 3, below, presents these annual maintenance costs (in $) for select BMPs, as well as the annual maintenance hours. Although the O&M costs have been presented in this memo, only the O&M hours will be included (as a separate field) in the Opti-Tool.
Table 3: Maintenance Costs ($) and Hours per year for select BMPs – From UNHSC
BMP Maintenance Cost ($) per year Annual Maintenance Hours
Bioretention $1,890.00 20.7
Chamber System Not Assessed Not Assessed
Detention Pond $2,380.00 24.0
Gravel Wetland $2,138.33 21.7
Porous Asphalt $1,080.00 6.0
Pervious Concrete $1,080.00 6.0
Retention Pond $3,060.00 28.0
Sand Filter $2,807.50 28.5
*Note: initial costs based on cost of maintenance per year per acre of IC treated
Annual maintenance strategies were evaluated by directly quantifying hours spent categorizing maintenance activities, and assessing difficulty of those activities. To better illustrate costs and anticipate maintenance burdens, activities were characterized into distinct categories and a standard cost structure was applied. This unit conversion can easily be adapted according to local conditions, current economic climate, and regional cost variations which is why we decided to go with maintenance hours as those were directly measured and should remain constant. These maintenance activity categories allow more accurate cost predictions and provide insight into the appropriate assignment of maintenance responsibilities.
Annual maintenance costs were normalized to 2012 dollars and calculated for all SCMs by both dollars and personnel hours per acre of IC treated per system per year. It is important to note that inflation was not considered in life cycle maintenance cost projections.