MODELING AND
CHARACTERIZATION OF A VIRTUAL
IMPACTOR
MAHMUDUL HASAN
Department of Mechanical Engineering, Rajshahi University of Engineering & Technology, Rajshahi-6204, Bangladesh
shakil_ruetbd@yahoo.com
DR. MD. SHAMIM AKHTER
Department of Mechanical Engineering, Rajshahi University of Engineering & Technology, Rajshahi-6204, Bangladesh
mdakhter3456@yahoo.com
Abstract
A virtual impactor has been characterized analytically to separate small (micro range) aerosol particles. In the current study, an approximate analytical expression relating to the collection efficiency and mean aerodynamic diameter of particles collected has been developed, Three sets of design parameters have been studied to investigate the effects of changes in solution concentration, collection probe diameter, nozzle diameter and the distance between them to the particle size and collection efficiency. Effects of major flows and minor flows have also been presented. It was found that, increasing solution concentration and decreasing the total flow rates, increased the particle mean diameter rapidly in the minor flow. But the interesting part is that, the particle mean diameter increased to a lesser extent as the rest parameters were increased.
Keywords: Virtual impactor; collection efficiency; aerodynamic diameter; design parameters ;Stokes number
1. Introduction
sheath of clean air has been designed and operated [Masuda.et.al.,(1979)]. Improvement in the separation efficiency has been quoted as the increase in the ratio of clean air flow rate to aerosol flow rate continues. The separation efficiency, however, fell below the predicted value if there was a distortion of the annular aerosol flow. A stable and precise separation of the aerosol particles was also obtained [Chen.et.al.,(1986)]. The important design parameters which influenced wall losses and separation characteristics of a virtual impactor with a clean air core were also identified experimentally [Chen.et.al.,(1988)]. It has been reported that a certain throat length of the probe opening was required to exhibit good separation characteristics. The flow velocity for a Reynolds number of 4000 by using finite element method in an improved virtual impactor was theoretically calculated too [Asgharian.et.al.,(1997)]. It was found that, spherical particle losses were typically below 10% except foe 4-5μm particles where the losses can reach 38% and for fibers; losses did not exceed 30% but were present for all sizes. Later the optimum diameter and position of the clean air core has been determined experimentally in the virtual impactor [Li.et.al.,(1997)]. It was found that the clean air core diameter should be at least twice as the converging nozzle diameter and that the clean air core should be positioned so that the ratio of the clean air flow to the aerosol flow ranges from 1.5 to 5.0 at the outlet of the clean air tube. Therefore, it is worth to note that, despite many numerical analyses and experimental investigations have been conducted, no analytical modeling of virtual impactor has been undertaken so far. This is what the current work aims at.
2. Style of Approach
At the outset, literature review has been carried out in the relevant field. Later, the equations representing physical model of impactor have been presented. In the present study, the flow is assumed to be steady, uniform, laminar and axisymmetric. Besides, density, viscosity and temperature of the fluid remain constant throughout the fluid passage. The streamlines following major flow are assumed to be arcs of a circle with a certain radius and the velocities of particle and fluid (air) parallel to impactor axis are also presumed to be of same magnitude. Then, results have been depicted in different diagrams.
3. Modeling and Characterization
A schematic view of a virtual impactor and related parameters are shown in Fig.1. The nozzle exit diameter, collection probe inlet diameter and nozzle to collection probe distance have been denoted by D, d and S respectively.
Fig.1: Simplified impactor model Fig.2: Conical area for V
2 of major flow
The total flow rate, major flow rate and minor flow rate are denoted by Q1, Q2, and Q3 respectively. Figure 2 dictates a simplified impactor model along with some important parameters. Particles travelling along a circular streamline of the major flow experiences a centrifugal force causing it to move towards the collection probe. If these departures are slight, the particle will depart from its original streamline with a constant radial velocity Vr while traversing curve part of the streamline. Hence for slight departures:
Where the relaxation time and αr is is the radial acceleration of the particle. Now radial deceleration at any elapsed time t can be written as:
.
]
2
……….. (3.2)
Where, . , is the linear velocity of the particle at any time t and its direction is as shown in Fig.2. Hence, from Eq. (3.1), the radial velocity at any time t becomes:
.
]
2
………(3.3)
Now, differential deviation of the particle from air streamlines d during time dt is given by:
.
]
2dt………….. .(3.4)
Hence, total deviation:
.
……… ..(3.5)
Assuming the particle concentration (C) to be constant over the whole cross section, the collection efficiency, EI, the fraction of entering particles that are collected, is given by:
4
8
0.25
3
. . 3.6
Eq. (3.6) can also be expressed in terms of Stokes number as:
4
0.25
3
. . . 3.7
Where, (Stk)= , the ratio of particle stopping distance to nozzle radius. If is very small, the above Eq. takes the form:
……… (3.8)
Now, and,
Where Q1 is the nozzle flow (total flow) and Q2 is the major flow through the conical area with velocity V2. Letting, B= (D=d), Eq. (3.8) gives:
.
…. ….. (3.9)
Where, and
√4
1.1
……. .Where,
4
, and4
1
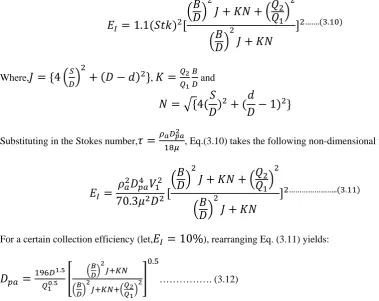
Substituting in the Stokes number, , Eq.(3.10) takes the following non-dimensional form:
70.3
……….. .For a certain collection efficiency (let,
10%), rearranging Eq. (3.11) yields:
. .
.
………. (3.12)
4. Results and Discussion
A review of Esq. (3.9)-(3.11) shows that Stokes number is the relevant parameter for characterizing the phenomena of virtual impactor. From the expression of Stokes number, it is evident that the aerodynamic diameter of the particle is proportional to . All relevant graphs therefore have been plotted with as a parameter. The large particle collection efficiencies obtained from Eq. (3.10) for various Stokes number and for the base values of
1.5,
1.0, and
0.9 have been displayed in Fig. 3 which reveals that large
particle collection efficiencies increase at higher values of Stokes number.Fig.3: Large particle collection efficiency Vs.
√
Fig.4: Large particle collection efficiency Vs.√
Equation (3.12) gives the relation between aerodynamic diameter of the particle for certain collection efficiency and various parameters of the virtual impactor. Different values of design parameters used in this study are tabulated in table 1.
Table 1: Values of design parameters used in the study
D(cm) (lpm) d/D S/D Q2/Q1
1 46 1.25 0.66 0.95
1.25+ 56+ 1.5+ 1+ 0.9+
1.7 66 1.87 1.5
“+” base case
4.1. Effect of probe diameter(d)
The probe diameter ratio (d/D) was set at 1.25 and 1.87 besides its base value of 1.5. The aerodynamic diameters of large particles collected are calculated by Eq. (3.12) and plotted in Fig. 5 which confirms that as the collection probe diameter increases, the particle. aerodynamic diameters also increase slightly. The particle aerodynamic diameter decreases with the increase in total flow rate for all collection probe diameters.
Fig.5: Particle aerodynamic diameter vs. total flow rate
Fig.6: Particle aerodynamic diameter vs. total flow rate
4.2. Effect of nozzle to probe distance(S)
Effects of S/D on aerodynamic diameter of large particle collected have been realized from Eq. (3.12) and depicted in Fig.6. It is observed from the Fig.4.4 that, as the value of “S” increases, the aerodynamic diameter increases very slightly.
4.3. Effect of major flow rate
Fig.7: Particle aerodynamic diameter vs. total flow rate Fig.8: Particle aerodynamic diameter vs. (S/D)
4.4. Effect of nozzle diameter (D)
The nozzle diameter was varied in accordance with the values of 1.0 cm and 1.7 cm besides its base value of 1.2 cm while the other parameters were kept constant at base values. The Reynolds number increases as the nozzle diameter decreases and it is clear from the Fig.8 that the cut-off size decreases. The aerodynamic diameter decreases from 14 µm at D=1.7 cm to about 6.33 µm at D=1.0 cm for S/D=1. So, smaller nozzle diameter is required to attain sharp cut-off siz
4.5. Effect of total flow rate (Q1)
The effect of total flow rate on particle aerodynamic diameter of large particles collected is mainly related to flow Reynolds number through the nozzle. When any of the above parameters increases, the velocity of flow through nozzle increases and thereby increasing the Reynolds number and hence, the mean aerodynamic diameter of particles decreases.
Fig.9: Particle aerodynamic diameter vs. (d/D)
Fig.10: Particle aerodynamic diameter Vs. (S/D)
5. Conclusion
An approximate analytical expression has been developed relating to the collection efficiency and mean diameter of particle collected with the relevant parameters of a virtual impactor. The influence of nozzle outlet and probe inlet diameters, nozzle to probe distance and different flows on final particle size in minor flow has been studied. The results show that most parameters with the exception of nozzle outlet diameter and flows through nozzle have little effect on the particle size in the minor flow.
Acknowledgement
This work is funded by “HEQEP sub-project (CP-521)”, UGC, Bangladesh
References
[1] Asgharian, B. and Godo, M.N., “ Aerosol Science and Technology”, 27:499-506,1997.
[2] Chen, B.T.and Yeh, H.C.,“Aerosol Science and Technology”, Journal of Aerosol Science”, 18:203-214.
[3] Chen, B.T., Yeh, H.C. and Cheng, Y. S., “Aerosol Science and Technology”, 5:369-376, 1986.
[4] Fourney, L. J., Ravenhall, D. G. and Lee, S. S. “Environmental Science and Technology”, 16:492-497
[5] Fourney, L. J., Ravenhall, D. G and Winn, “ Journal of Applied Physics”, 49(4), 2339-2345, 1978
[6] Li, S. N. and Lundgren, “ Aerosol Science and Technology”, 27:625-635, 1997.
[7] Loo, B.W., Cork, C.P. “ Aerosol Science and Technology”, 9:167-176. 1988.
[8] Loo, B. W., Jaklevic, J.M. and groulding, F.S.”Fine particles ( B.Y.H.ed.), Academic Press Inc”., New York, U.S.S., 1978.
[9] Marple, V. A. and Chein, “Environmental Science and Technology”,14(8), pp. 976-985, 1980.
[10] Masuda, H., Hochrainer, D. and Stober, W., “ Journal of aerosol Science”, 10:275-287, 1979
[11] Ravenhall, D. G., Fourney, L. J. and Hubbard,” Journal of Colloid and Interface Science”, 85(2),pp. 508-520, 1982.
[12] Ravenhall, D. G., Fourney, L. J.., Jazayer, M J “Colloid Interface Science”, 65(1), 1978.