An Approach to risk quantification in
construction projects using EMV analysis
R. C. WALKE*
Research student for Ph. D. course,
V. J. T. I., Mumbai University
PROF. V.M. TOPKAR
Head,
Civil and Environmental Engineering Department,
V. J. T. I., Mumbai University
NISHA U. MATEKAR
P. G. Student for M. Tech.Course
V. J. T. I., Mumbai University
Corresponding Author
R. C. Walke*
Research student for Ph. D. course,
Civil and Environmental Engineering Department,
Veermata Jijabai Technological Institute,
Matunga, Mumbai 400 019. India
Abstract
There are many risks events that adversely affect the timely completion, cost, quality and scope of construction projects. Therefore it is important to have understanding about risks that occur during planning, execution and maintenance of construction projects, their probability of occurrence as well as consequences of their occurrence and probability of consequences.
area of risk management. The system is checked for practicability and can be used by client as well as contractor’s organization.
Key words: Risk, Consequences, EMV, Risk Management
Introduction
Construction industry has a wide horizon, wide scope and there is a need for successful risk management. Many construction projects fail to meet dead line and cost target due to various inherent risks. Too often, risks are either ignored or are dealt in a completely arbitrary way resulting in an expensive delays, litigations and even bankruptcy (Ross 1986). Structured approach to risk management includes identification of risks, their classification, analysis, deciding upon risk response strategies and monitoring as well as controlling of the implemented risk response strategies.
The researchers aim to present a simple yet useful system for getting a primary estimation of total risks that a construction project may face in terms of cost and provides a rational basis to make decisions related to risk response strategies. The system developed for risk quantification in construction projects is an outcome of extensive study of Literature and guidelines on risk management .The basic concepts and principles related to risks and its management are discussed first, followed by the description of proposed risk qualification system. Scope of proposed paper is restricted to quantification of risks in construction projects.
Risk and its management: A brief review
In the literature, the word ‘Risk’ has been used in many different meanings with many different words such as hazard or uncertainty (Boodman 1977, Faber 1979, Lifson and Shaifer 1982, Hertz and Thomas 1983). Risk has been defined in variety of ways. The Webster’s dictionary defines risk as ‘The possibility of loss, injury, disadvantage or destruction’. Businesses would like to quantify risks for many reasons. Knowing how much risk is involved will help decide if costly measures to reduce the level of risk are justifiable (Jannadi and Alamshari 2003).
Symbolically, we could write Risk as
Risk = f (Uncertainty of event, Potential loss/gain from event) (Jamal and Keith 2003).
The concept of risk varies according to viewpoint, attitudes and experience of an individual and thus risk has a different meaning to different people. Engineers, designers, and contractors view risk from the technological perspective, Lenders and developers tend to view it from economical and financial side, and health professionals, environmentalists, chemical engineers take a safety and environmental perspective. Risk is, therefore, generally seen as an abstract concept whose measurement is very difficult (Baloi and Pence 1977).
Risk management is the critical part of project management as ‘unmanaged or unmitigated risks are one of the primary causes of project failure’ (Royer 2000). The risk management process aims to identify and assess risks in order to enable the risks to be clearly understood and managed effectively (Hillson 2002 b). The term ‘risk management’ has multiple meanings. Many use this term synonymously with risk identification. For many others, it is synonymous to risk analysis, risk monitoring and /or risk control. In fact, these all are the phases of risk management. According to PMBOK (PMI 2004), project risk management is defined as ‘the process concerted with identifying, analyzing and responding to uncertainty throughout the project life cycle’.
The general consensus in current literature, available in the field of risk management, incorporates four steps in the process of risk management. These are Risk identification, Risk Analysis, Risk Response planning and Risk Monitoring and control (Thevendran and Mawdesley 2004).
List, questionnaires and interviews, Delphi group or normal group techniques and various diagrammatic techniques like cause effect diagram, influence diagrams etc. (Hillson 2002 a).
Risk analysis is an evaluation process of uncertainty associated with occurrence of internal and external risks, as well as consequences of occurrence of these risks on the basis of best available information. Certain risks affect the project performance negligibly. Such risks can be very well ignored and their impact on project need not be quantified. While certain risks have potential to adversely affect the project objectives to large extent. These risks are to be quantified. Risks analysis can be subjective as well as objective. Risk analysis involves the Qualitative is and quantitative assessment of the identified risks. Project management has to estimate the probability of occurrence of the risks as well as their potential consequences. The risk management database can then be updated with the new information (Schatteman 2008).
Qualitative risk analysis is to determine the likelihood and potential effect of identified risks on project objectives. It helps in prioritizing risks for further attention. Techniques like Fault tree analysis, Event tree analysis, Sensitivity analysis and probability impact grid are used for qualitative risk analysis (Ammar 2007).
Quantification of risks involves evaluating risks and risk interactions to assess the range of possible project outcomes (PMI 2004). It is primarily concerned with which risk events warrants response. Statistical sums, Expected monetary value, expert judgment etc. are some of the tools used for quantification of risks.
Risk response planning is a process of determining appropriate response to the risks that are screened and analyzed quantitatively. Having identified the risk exposure and having quantified its potential consequences, it is time to deploy well known suitable strategies such as risk avoidance, risk probability reduction, risk impact reduction and risk transfer (Schatteman 2008). The PMBOK (PMI 2004) gives four response strategies. These are Risk avoidance, Risk transfer, Risk mitigation and Risk Acceptance.
Risk Monitoring and Control is a process where effectiveness of the responses is monitored and controlled. At the same time, identification and analysis of newly arising risks is done at this stage.
Proposed Risk Quantification System
For the purpose of this paper, risk management is defined as a systematic process of identifying, classifying, analyzing, responding and, monitoring and controlling of risk events throughout the life cycle of a construction project in order to eliminate or control risk exposure to the project. To carry out risk management work of construction project a ‘Risk Management Team’ shall be formed. This team shall consist of not more than 3-5 members (Stake holders or their representatives).This team shall work on the proposed risk quantification system. The effectiveness of risk management shall be clearly dependent to a substantial degree on the capability and experience of the team members undertaking risk management (Ward 1999).
Proposed System consists of three step framework as below
a. Identification and Classification of identified risks b. Qualitative analysis of risks
c. Quantification of risks
Every step of the proposed system is detailed below
Identification and Classification of Risks
In the context of this paper and for the proposed system, risk management is defined as a systematic and continuously identifying the significance of risks associated with a construction project under consideration. Team members of Risk Management Team shall identify risks in the project using Brainstorming session. Expert opinion may be taken, if needed. This shall generate a check list of risks in the project.
different categories. Many researchers have suggested the different ways of risk classification. Names of some of these authors include Ross 1986, Shen 2001, Baloi 2003 and Flanagan and Norman 1993.
For the proposed system, classification exclusively for construction risks, suggested by Ross and Perry 1986 is considered. This classification of risks is as below
a. Political Risks b. Environmental Risks c. Physical Risks
d. Legal and contractual Risks e. Design Risks
f. Construction Risks g. Financial Risks
Procurement risks are not a part of Ross and Perry’s classification. But considering Importance of procurement for large and complex construction project, it is also considered as one of the category for classification of risks in proposed system.
Qualitative Analysis of Risks
In the proposed system, for qualitative risk analysis, probabilities and consequences are assessed on subjective basis using following tools.
a. QRA sheet (Qualitative Risk Analysis sheet) b. P-C Matrix (Probability – Consequences Matrix)
a. QRA sheet
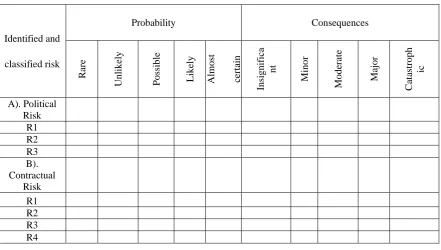
This is designed, in particular, to evaluate individual risk responses subjectively (Table 1). It has a list of identified risks and classification of these risks. It shall ask for probability and consequences of each risk in a subjective way. For probability assessment, a probability scale shall be used. This scale shall be used respectively for the probability range like rare, unlikely, possible, likely and almost certain. In the context of consequences the same scale shall be used. Here the scale shall be used respectively for insignificant, minor, moderate, major and catastrophic consequences.
Team members shall discuss together to decide the level of probability and consequences of individual risk. A QRA sheet shall be filled after reaching consensus, where only tick marks shall be put in appropriate boxes in QRA sheet, against individual risks.
b. Probability consequence Matrix
Response in QRA sheet shall be further analyzed using probability - Consequence Matrix. It consists of vertical column for probability and horizontal column for consequences using the scale, same as that is used in QRA sheet. This matrix shall give combined effect of probability and consequences associated with each risk. This combined effect shall be expressed as very low, low, significant and high, dividing PC Matrix into four Zones (Table2).
Table -1
QRA (Qualitative Risk Analysis Sheet) (www.scribd.com)
Identified and classified risk Probability Consequences Rare Un lik el y Possi ble
Likely Almo
st certain Insi gni fica nt Mi n or Mo de rat e Maj o r Catastro ph ic A). Political Risk R1 R2 R3 B). Contractual Risk R1 R2 R3 R4 Table-2
Probability – Consequence Matrix (Hillson 2002 a)
C
P
In significant Minor Moderate Major Cates tropic
Rare Very Low Very Low Low Low Significant
Unlikely Very Low Low Low Significant Significant
Possible Low Low Significant Significant High
Likely Low Significant Significant High High
Almost
Certain
Significant Significant High High High
Quantification of Risks
Team members shall discuss together and after reaching consensus, shall fill details about individual risks as well as about their interdependency, if exists, in quantification format.
Basic occurrence probability of selected risks – Team members shall decide about the probability of occurrence of risks i.e. chance of risks actually occurring, after discussing, brainstorming and reaching consensus. For example, the basic occurrence probability of a particular risk can be decided as 70% by the Team members after reaching consensus. This means that there are 70% chances of occurrence of that particular risk and there shall be 30% chance of non occurrence of that particular risk.
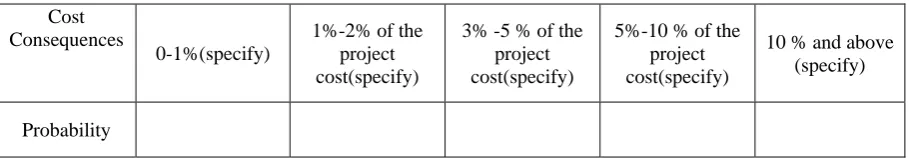
Scale for probabilities for different cost consequences– In the proposed system, scale for cost consequences shall be used where a range of cost consequences in terms percentage of the total project cost shall be given and associated probabilities shall be filled by team members after reaching consensus. This scale is shown below in Table 3. (“Author”)
Table 3
Scale with a Range of Cost Consequences and associated Probabilities
Cost Consequences
0-1%(specify)
1%-2% of the project cost(specify)
3% -5 % of the project cost(specify)
5%-10 % of the project cost(specify)
10 % and above (specify)
Probability
(Here it means: What is the probability that consequences due to a particular risk will lead to 0-1% increase the total project cost, 1 to 2% increase in total project cost and so on).
Note: Above classes being mutually exclusive, sum of the probabilities for all the ranges of consequences should be 100%.
Experience shall influence the responses while filling the above table. The scale for cost- consequences and associated probabilities is subjected to modification, considering various factors like total project cost, completion period, importance of the project etc.
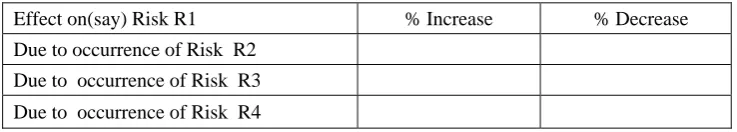
Interdependence and cost consequences
Table 4
Interdependency Format
Team members shall write the percentage increase or decrease in cost consequence of risks in term of total project cost. For example, as shown in Table 4, influence of risks R2, R3 and R4 on risk R1 can be filled by Team members. This Format (Table 4) shall be used for interdependent risks in project to find changes in cost consequences.
Calculations for Risk Quantification
In the proposed approach, Expected Monetary Value (EMV) analysis is used as a tool to carry out risk quantification. EMV is a product of risk event probability and risk event consequences. Risk event probability is an estimate of probability that a given risk will occur (Basic Occurrence probability).
The calculations using EMV analysis in the proposed risk quantification system are as below (“Author”)
1. The lowest and highest cost consequences related to each risk are considered as “Low1” and “High 1” values. As the consequences are described in scales, the mid-point of each class is taken as cost consequences for calculation.
Example – For class 1-2% - 1.5% taken for calculations
Similarly, For class 3-5% - 4% is taken for calculations
Expected Monetary Value 1 is calculated for every risk using following formula
Expected Monetary Value 1 = Cost consequence of a risk x Probability of this cost consequence
(Eqn-1)
2. Next step is to consider basic occurrence probability of each risk and multiply it with its Expected Monetary Value 1.This shall give Expected Monetary Value 2 for a particular risk. Thus,
Expected Monetary Value 2 = Basic occurrence Probability x Expected Monetary Value 1
(Eqn-2)
Modification is also applied to Expected Monetary Value 2 for interdependencies, in order to get Final Expected Monetary Value. Low 2, High 2 and Final Expected Monetary Value is determined using following formula.(Refer Table 4 for clarity of this formula )
Low 2 = Low 1+ [(Low 1 x %change in a particular risk say R1 due to occurrence of another risk say R2) x Basic occurrence probability of risk R2 ] + [(Low 1 x %change in a particular risk say R1 due to occurrence of another risk say R3) x Basic Occurrence Probability of Risk R3 ] + [( Low 1 x %change in a particular risk say R1, due to occurrence of another risk say R4) x Basic occurrence probability of risk R4]
Effect on(say) Risk R1 % Increase % Decrease
Due to occurrence of Risk R2 Due to occurrence of Risk R3
(Eqn-3)
High 2 = High 1+ [(High 1 x %change in a particular risk say R1 due to occurrence of another risk say R2) x Basic occurrence probability of another risk R2 ] + [(High 1 x %change in a particular risk say R1 due to occurrence of another risk say R3) x Basic Occurrence Probability of Risk R3 ] + [(High 1 x %change in a particular risk say R1 due to occurrence of another risk say R4) x Basic occurrence probability of another
risk R4] (Eqn-4)
Final Expected Monetary Value = Expected Monetary Value 2 + [(Expected Monetary Value 2 x %change in a particular risk say R1 due to occurrence of another risk say R2) x Basic Occurrence Probability of R2] + [(Expected Monetary Value 2 x %change in a particular risk say R1 due to occurrence of another risk say R3) x Basic Occurrence Probability of R3] + [(Expected Monetary Value 2 x %change in a particular risk say R1 due to occurrence of another risk say R4) x Basic Occurrence Probability of R4]
(Eqn5)
The total project risk, in terms of cost, varies between the sum of Low 2 values and sum of High 2 values, for all the risks considered for quantification. Proposed System also gives the sum of Expected Monetary Value of all the project risks, which is calculated in a proposed system as ‘Final Expected Monetary Value’.
Discussion and Conclusion
Proposed risk quantification system is a simple and effective tool to understand and quantify risks in terms of cost. It has a potential to contribute in a great way in a project risk management process. The system can be used to find:
1. Range within which the individual risk (in terms of cost) may vary 2. Range within which the risk of total project (in terms of cost) may vary 3. Expected monetary value of the total project risk
The system can be used by the clients as well as contractors for bidding on construction projects and for deciding upon risk response strategies. Though the system does not give a very detailed quantitative analysis of the risks, it can be used fairly for decision making at the starting point of every phase of the project. It helps in identifying the high risk areas which need to be controlled and monitored for the achievement of project objectives in terms of cost. This approach can be made suitable for incorporating and implementing with a computer aided decision support system, provided precise data is made available for the proposed risk quantification system.
References
1 Ammar Ahmed, et. al., (2007), “A review of techniques for risk management in projects” Benchmarking: An International Journal, Vol.14, No.1, pp. 22-36.
2 Baloi Daniel and Pence Andrew D. F.(2003), “Modeling global risk factors affecting construction cost performance”, International Journal of Project Management, Vol.21,pp. 67 – 76.
3 Boodman, D. M. (1977), “Risk Management and Risk Management Science: An overview”, Paper presented at the Session of Risk Management, TIMS 23rd. Annual Meeting of Institute of Management Sciences, Greece.
4 Faber, W.(1979), “Protecting giant projects: study of problems and solutions in the area of risk and insurance”, Wills Faber, London, England.
5 Hertz, D.B., and Thomas, H.(1983), “Risk analysis and its application”, John Wiley and Sons,Inc., New York.
6 Hillson David.(2002 a), “ Extending the risk process to managing opportunities”, International Journal of project management. Vol.20, pp.235 – 240.
7 Hilson David.(2002 b), “Use of Risk Breakdown Structure (RBS) to Understand Your Risks”, Proceedings of the Project Management Institute Annual Seminars and Symposium, October, San Antonio, Texas, USA.
8 http// www.scribd.com/doc/6457287/Authentication-Risk-Analysis-Worksheet-Answers
9 Jamal F. Al- Bahar and Keith C. Crandall. (1990), “Systematic Risk Management Approach for Construction projects”, Journal of Construction Engineering and Management, Vol.116, No.3.pp.533-546
10 Jannadi Osama Ahmed and Almishari Salman. ( 2003), Risk Assessment in Construction, Journal of Construction Engineering and management, ASCE .September-October,pp.492-503
12 L.Y.Shen, (2001), Risk Management, International Journal of Construction Engineering and Management, Vol. 127, No.1, Jan-Feb. 13 Project Management Institute. (2004), “Guide to the Project Management Body of Knowledge), PMBok Guide
14 Roger Flanagan and Norman G. (1993), “Risk Management and Construction”, Black Well Science Ltd.,United Kingdom.
15 Royer P.S. (2000), “Risk Management: The undiscovered Dimension of Project Management”, PM Network, Volume.14, pp.31-40, 36770 edition.
16 Ross W. Hayes et.al., (1986), “ Risks Management Engineering construction” – An SERC Project Report.
17 Schatteman Damien et.al., (2008), “Methodology for Integrated Risk Management and Proactive Scheduling of Construction Projects” Journal of Construction Engineering and Management, ASCE, November Volume, pp.885-893.
18 Turnbaughs Lisa, (2005), “Risk Management on large capital projects”, Journal of Professional issues in Engineering Education and practice, ASCE, October Volume, pp.275 -280.
19 Thevendran Vicknayson and Mawdesley M.J, (2004), Perception of human risk factors in construction projects. An exploratory study, International Journal of Project Management Vol.22, pp.131 – 137.